Bitcoin ready to correct to 92,000A treasure channel that, after a little suffering and fear, cascades down.
Tp:92000
USTBTC trade ideas

Why Everyone’s Stop Loss Gets Liquidated?!!...Why does your stop loss always get hit first?
Is it possible that everyone else placed theirs exactly where you did?
Maybe it's time to face an uncomfortable truth about the market and crowd psychology.
Hello✌️
Spend 3 minutes ⏰ reading this educational material.
🎯 Analytical Insight on Bitcoin:
BINANCE:BTCUSDT has established a well-defined range in this zone, triggering multiple stop hunts and now approaching a fresh daily resistance. A confirmed breakout above this level could open the door for an 8% upside move toward the 128,000 area. 📈🧠
Now , let's dive into the educational section,
🎯 Crowd Psychology: The Fixed Target of the Market
In crypto markets, when everyone thinks the same, they tend to lose the same way. One of the clearest signs of this is where stop losses are placed. When a level becomes too obvious to too many traders, it becomes a magnet for liquidity hunters.
Public stop losses are usually placed right below obvious lows or above clear highs. These are areas that everyone has mentally marked as strong support or resistance. Ironically, that’s exactly where a sudden wick appears, takes out stops, and then the market goes right back in the original direction.
🧠 Your Brain Wants Safety, The Market Wants Liquidity
New traders search for “safe” places to hide their stops. That very logic makes those places unsafe. The market needs liquidity to move, and the most liquidity sits right where people feel safe placing their stops.
Remember: stop losses are actual market orders, buy or sell triggers. When yours gets hit, someone else enters a position. Your loss is their entry. This is a zero-sum game.
🐋 Whale Activity Before the Trap
Ever noticed how, just before your stop gets hit, there’s a small move in the opposite direction? That’s bait. Right after, a strong wick sweeps through, takes out public stops, then reverses. It’s not an accident. It’s planned.
If you observe these small shifts with suspicion rather than trust, you’ll often catch the trap before it happens.
💡 Your Trigger Shouldn't Be Where Everyone Else Sets It
There’s a smarter way to manage your stops, ways that avoid the obvious traps:
Use ATR to dynamically calculate distance
Place stops based on candle structure, not just price levels
Wait for confirmed reversal patterns before setting stops
Consider mental stops based on invalidation logic, not fixed price points
⛔️ Blind Trust in Repeated Zones
When a support or resistance level holds multiple times, people begin to trust it blindly. That collective trust becomes a weakness. The market doesn’t respect obvious levels, it exploits them.
If you see it, everyone else sees it. And so does the market. But the market plays a different game. You seek safety, it seeks liquidity.
🎲 Is It Really Your Fault?
Many traders blame themselves when their stop gets hit. The truth? You’re not the problem, your thinking pattern is. Most traders make the same decisions because they learned the same textbook strategies. That’s what makes their stops predictable.
It’s not always about poor analysis. Sometimes, it’s just about being part of the herd.
📉 Practical TradingView Tools to Track Public Stop Zones
Here are a few powerful TradingView tools and indicators you can use to figure out where stop loss clusters are likely hiding. Use them together for better accuracy:
Session Volume (Fixed Range)
Apply this tool to recent ranges or high-volatility zones. Peaks in volume often reveal where most traders are entering or exiting, which means stops are likely nearby.
Liquidity Pools Finder
This indicator estimates areas with potential liquidity pools. These are often the next targets for large moves.
Horizontal Ray or Box Tool
Use these to mark the areas just above highs and below lows. These zones are where most public stops typically sit.
Fair Value Gap (FVG)
Gaps in price action can act as magnets. It's no coincidence that public stops often get hit in these areas during fakeouts or trap moves.
📌 Final Thoughts
When everyone looks at the same level, the market attacks it. Public stop losses are a primary fuel source for liquidity-based moves. Use TradingView tools, train your eye, and place your stops where no one else dares. That’s how you stay out of the trap.
✅ Wrap-Up
If your stop always gets hit right before the big move, it’s not a coincidence, it’s a mindset issue. Stop thinking like the crowd, and the market will stop treating you like one.
✨ Need a little love!
We pour love into every post your support keeps us inspired! 💛 Don’t be shy, we’d love to hear from you on comments. Big thanks , Mad Whale 🐋
📜Please make sure to do your own research before investing, and review the disclaimer provided at the end of each post.

BTC Price Prediction and Elliott Wave AnalysisHello friends,
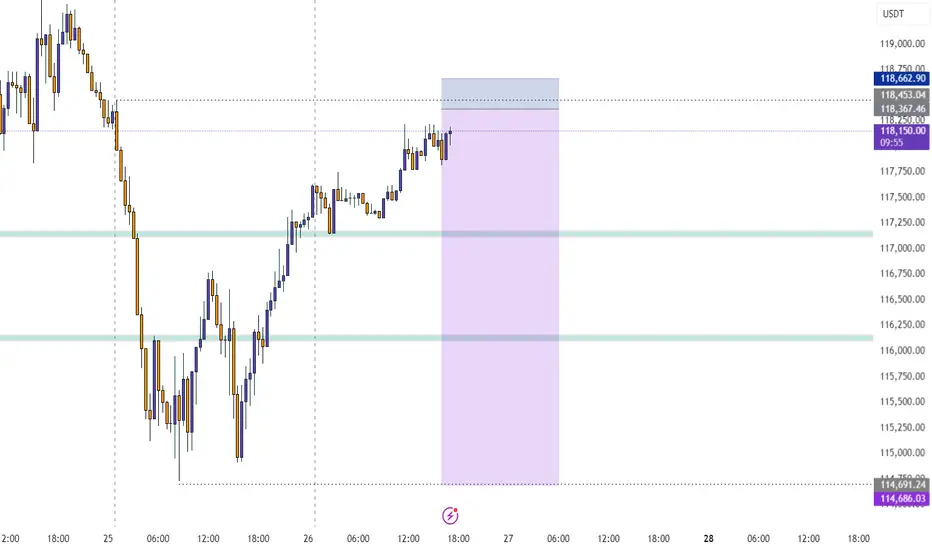
>> Thank you for joining me in my analysis. I think we have finished the 1st wave in B wave as Pink W, in this micro correction. In my opinion, we will watch 2nd & 3rd waves XY as in pink color, or Yellow B wave ended successfully, just I need to these confirmations:
* Day TF: Breaking 118451 for the next days and keep on above it, lead to ending B wave successfully.
* 4Hr TF: Breaking 118451 for the next hours and keep on above it, lead to ending W wave successfully ( maybe also B ?)
keep like and support me to continue, See you soon!
Thanks, Bros

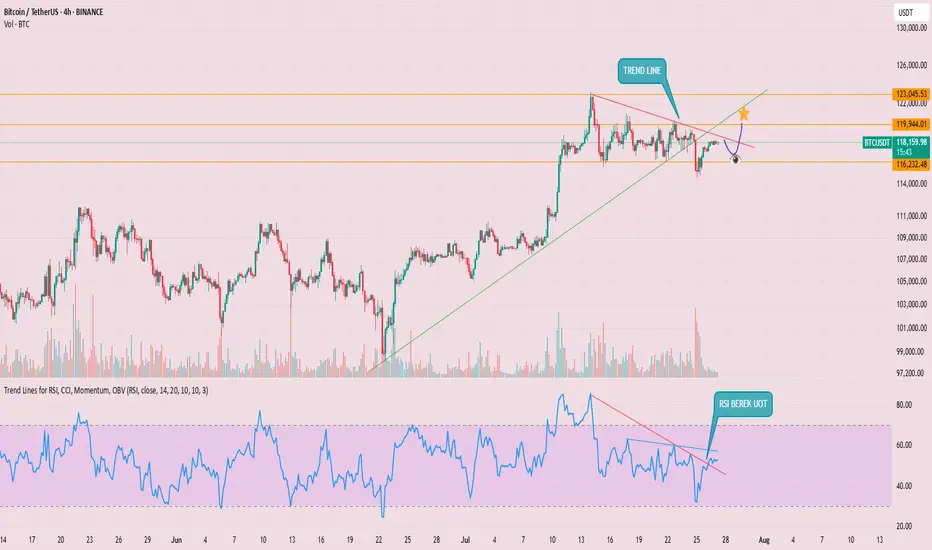
Btc UpdateBTC is moving within a falling wedge and is making its fourth breakout attempt.
A successful breakout and retest of the wedge would confirm a bullish trend, while rejection could signal further movement within the wedge.

BTC short setupGiven the bearish divergence on the lower timeframe and grabbing liquidity, we may be able to open a short position with low volume.

BITCOIN next target 130000-134000 pattern repeatedHi guys, this is my analysis for BTCUSDT in the next few days.
Feel free to check it and write your opinion in the comments.
BITCOIN had been consolidating for two weeks before it reached the ATH 123500 and I think bitcoin has proven to repeat itself. This happened before, and it will happen again.
After reaching the ATH, Bitcoin has been consolidating for the last two weeks.
Therefore, I think that BITCOIN will reach
130000-134000
In the next few days.
Please respect each other's ideas.
This is not financial advice, it's just my humble analysis.
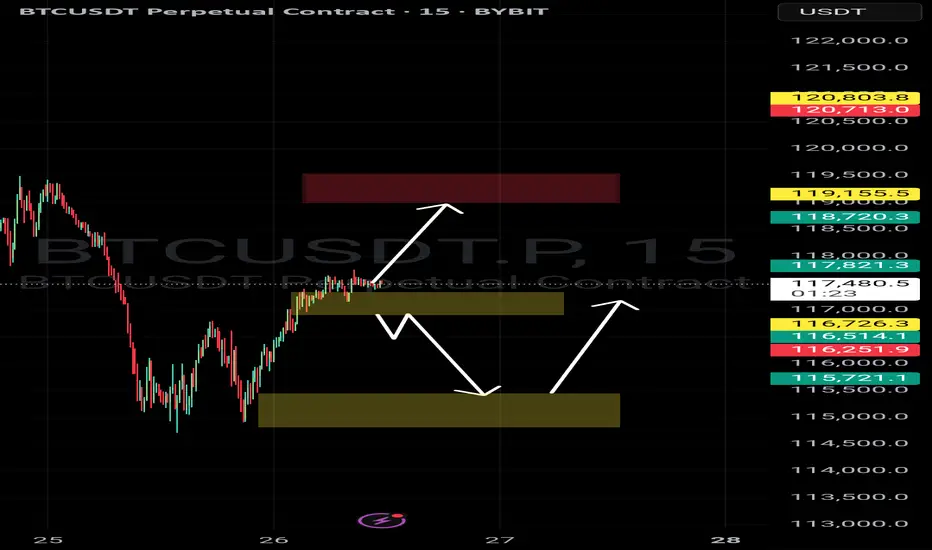
The move is up to the buyersHi traders and investors!
The price has already played out the upper boundary of the scenario, rising above 120,500. Then it also reached the lower boundary by dropping below 115,222.
Now we are at an interest moment: will the price continue to move upward or not?
This situation is clearly visible on the 8-hour timeframe.
On the 8H chart, we see a sideways range, similar to the 1D timeframe. The lower boundary is 115,736 and the upper boundary is 123,218. The active initiative is currently with the buyers, and their target is 120,998 и 123,218.
There is a notable bar attacking the lower boundary (115,736) with very high volume. The high of that bar is 118,451. We’re watching to see whether buyers absorb this bar — that will determine how the next move plays out.
There are three key levels where buyers may step in: 116,782, 116,128, and 115,736. If the price drops to any of these, we can look for a long setup.
Above, we also have three resistance levels from the sellers: 118,451, 119,676, and 120,247. We’ll be watching how sellers react if the price tests these zones.
This analysis is based on the Initiative Analysis concept (IA).
Wishing you profitable trades!

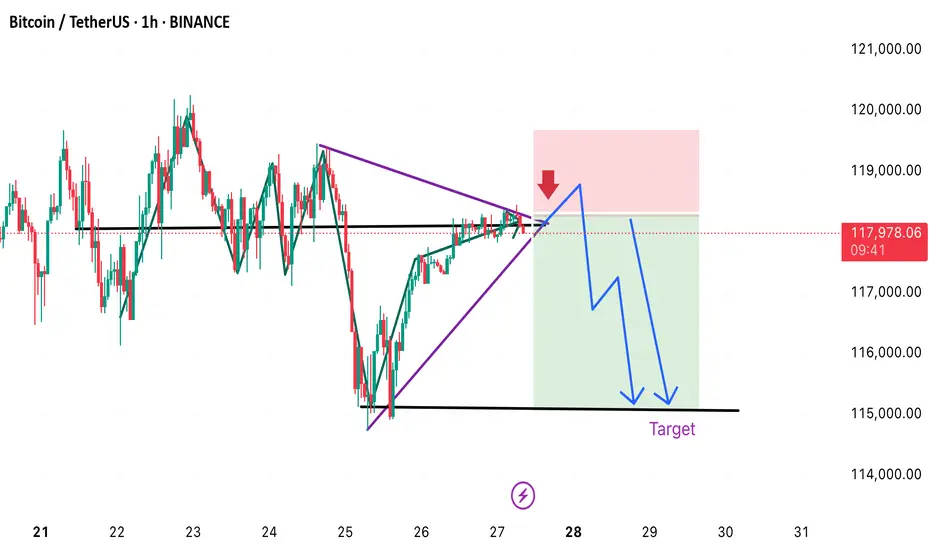
BTC 1H CHART LOOK OUTBitcoin breaks down from the triangle, the expected move is downward toward the $115,000 target. The trade setup reflects a short position, with risk clearly defined by the red stop-loss zone above ~$118,800.
#BTC Update #10 – July 27, 2025#BTC Update #10 – July 27, 2025
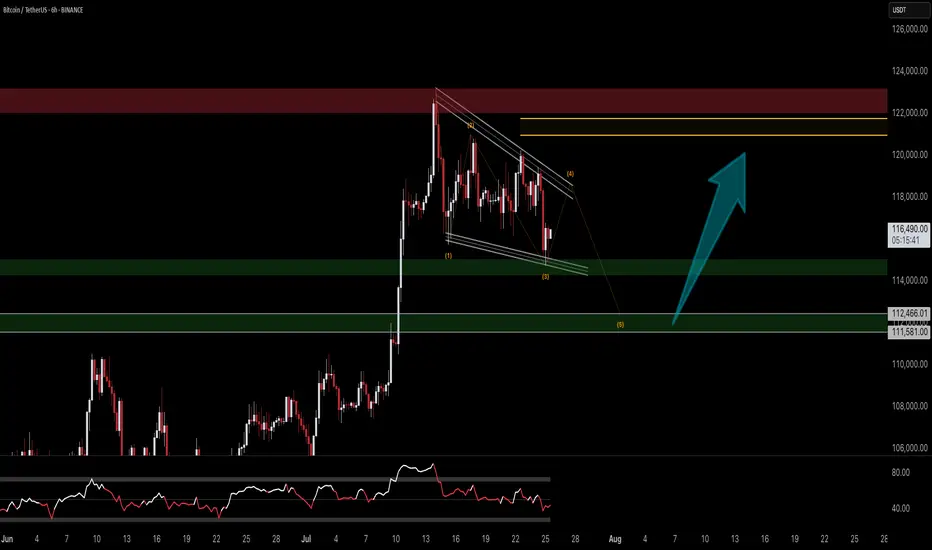
Bitcoin continues to move between $116,400 and $118,900, and staying within this range is actually a positive sign, even in bearish scenarios. A decisive close below $114,000, however, could open the door for a deeper and more prolonged correction.
Although BTC hasn’t broken to new highs yet, its ability to hold here means the trend isn’t broken. A strong breakout above $118,900 could lead to a rally toward $123,300 and possibly even $128,000.
🔹 On the 4H chart, BTC seems to have completed its minor correction.
🔹 On the daily chart, the correction remains incomplete – despite dipping to $114,700, the key $112,900 zone hasn’t been tested.
In lower timeframes, BTC remains squeezed within a symmetrical triangle. While it occasionally pokes out, it quickly returns inside — showing indecision.
📌 Direction is unclear at the moment. There’s no strong signal for Long or Short. Waiting for confirmation with volume and a clear breakout is the safer play.

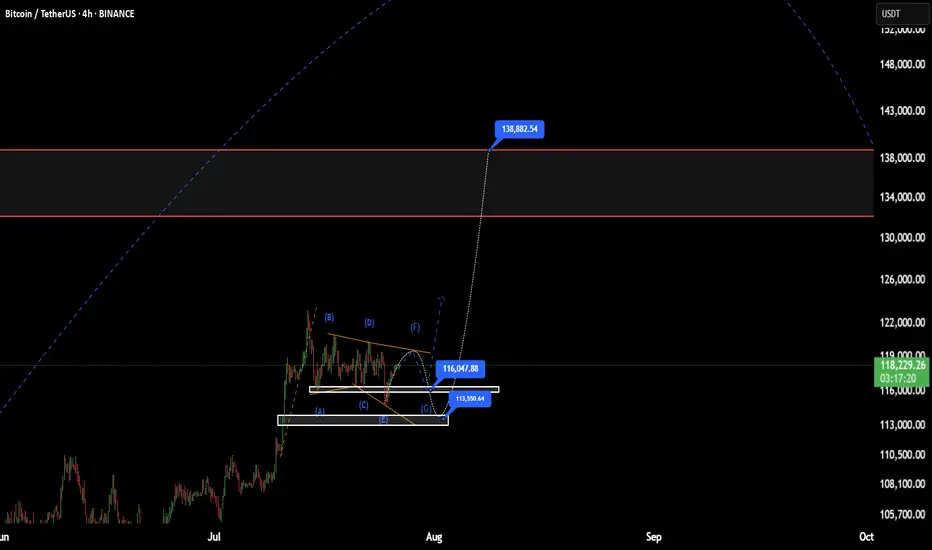
BTC(based on NEo wave)This range price is shown as a bow-tie diametrical.
I think G wave will end at one of those prices, 113 or 116
after this it will start a good bullish wave.
stop loss is 110K and the first target is 138K.
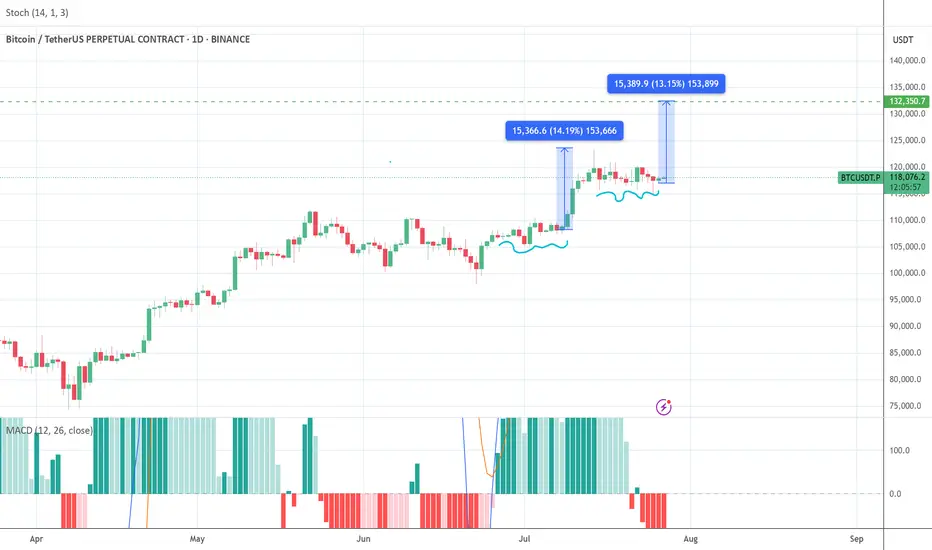
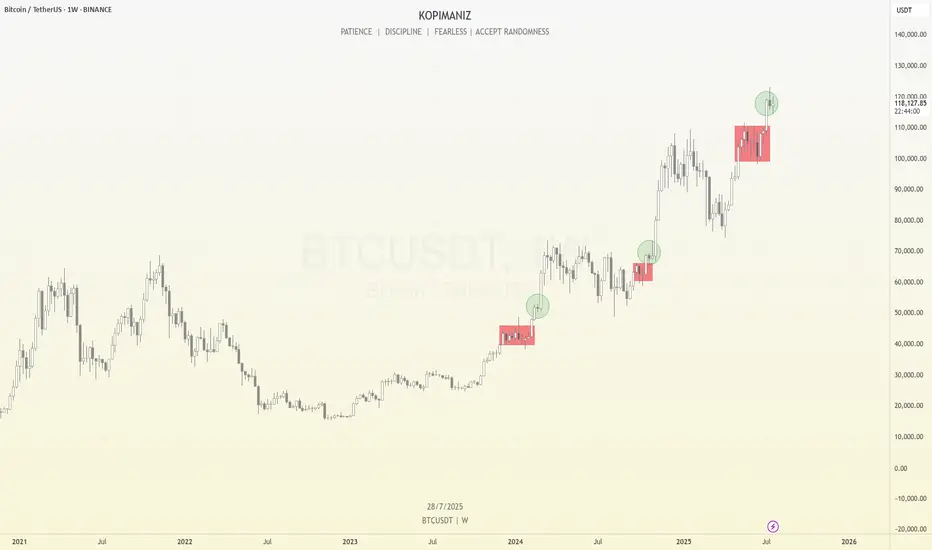
Bitcoin Weekly Structure: Repeating Rhythms and What’s Next
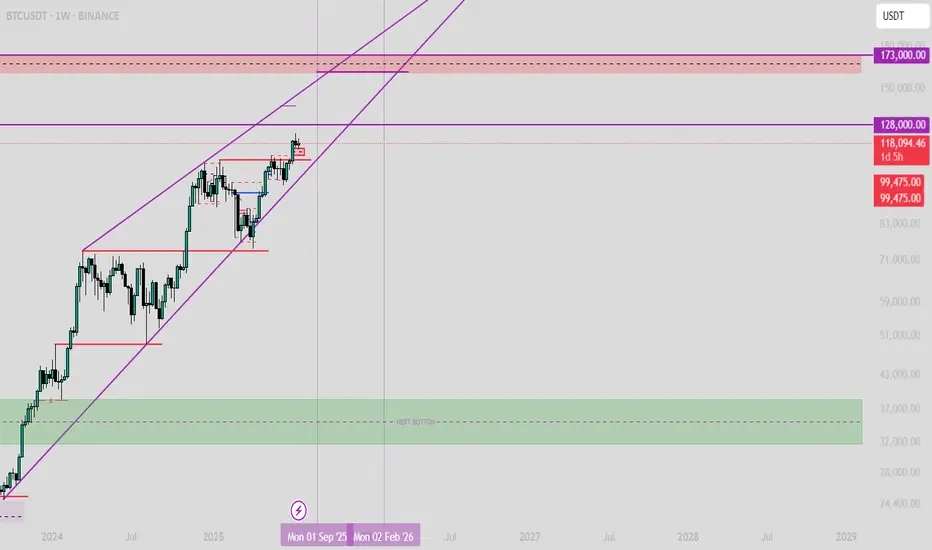
Bitcoin continues to follow a consistent structural rhythm on the weekly timeframe. We can observe that before every major breakout, price enters a multi-week consolidation phase, which I’ve marked using red boxes on the chart. These red box zones represent long periods of sideways movement, typically acting as reaccumulation phases. Once price breaks above these levels, it often results in a strong impulsive move, confirming that these areas serve as foundational support for trend continuation.
After each of these longer consolidations, Bitcoin tends to enter a brief 1–2 week consolidation right after the breakout, which I’ve marked with green circles. These short pauses are signs of healthy bullish momentum, often acting as flags or continuation patterns before the next leg up. What’s notable is that each of these green circle phases occurs after a clean breakout from a red box, and they consistently lead to further price appreciation.
Currently, Bitcoin has just broken out of another red box zone between ~$100k and ~$110k. Over the past two weeks, it has formed a small range near $118k, resembling the same green circle structures we’ve seen earlier in the trend. Given this recurring pattern, there’s a high probability that we are once again in the early stages of a bullish continuation. If the pattern plays out as it has in the past, the next move could be another strong weekly candle pushing toward new highs.
However, I’m paying close attention to the $125k–$126k level. This psychological zone may act as a major turning point. It could lead to either a prolonged consolidation phase that lasts for months, or potentially trigger a significant correction if the market faces strong resistance. This level marks a critical area where momentum may shift, so it deserves extra caution as we approach it.
This type of structural repetition helps me stay grounded in my analysis—focusing not just on price, but also on how long and where Bitcoin consolidates. So far, the rhythm has been clean and reliable.
Let’s see if Bitcoin respects the rhythm once again.
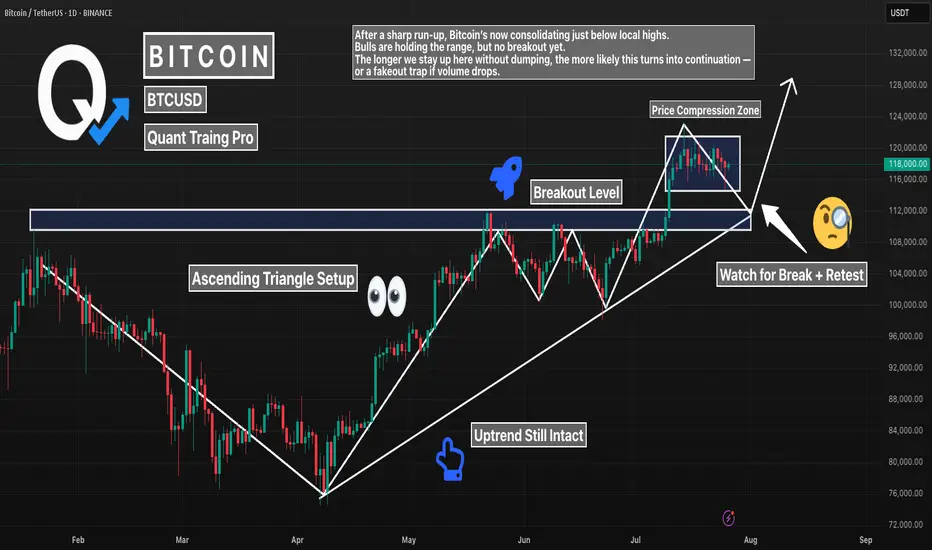
BTC 1D – Major Break of Structure. Now What?Bitcoin just broke major structure — flipping a key resistance level into support. After months of building higher lows, we finally saw price close above the previous swing high, confirming a bullish break of structure (BOS).
Now, BTC is coiling above that zone, forming an ascending triangle and refusing to give up ground. That’s a strong sign — but confirmation still matters.
What to watch:
– Break + retest of current range for continuation
– Or false breakout if volume fades and price sweeps below the level
Structure has shifted bullish. Now it’s all about follow-through.
#BTC #Bitcoin #BreakOfStructure #BOS #CryptoTrading #PriceAction #TechnicalAnalysis #QuantTradingPro
BTC SELL SHORT IDEA H1quick momentum short,to create weekly low manipulation for any masjor move, right now focus is on the sell move, following sub struture ltf trend pull back
Bitcoin - August 25This technical analysis is for informational and educational purposes only. It does not constitute financial advice. Remember to always research and consult with a professional before making investment decisions. Good luck! 📈💼🚀
BTCUSD LONGIt's a long time to write and explain everything, just buy the level with the limit that is at ~117.550. You can count on a short-term rebound.
The one below the touchdown is not worth taking. I'll let you know if it works or not later.

BTC - Prediction for the Final TOP AND the next BOTTOMAfter several analyses that I published on Trading View, I want to share my opinion on the Final Top and the next Bottom for Bitcoin!
The final Top will be between 160,000 and 174,000.
The next Bottom will be between 31,000 and 40,000. (Simply under 40,000).
This is not guaranteed, and it's just an analysis; it can happen or not, so be careful.
$BTC Important levels to watch1- Important levels to watch for TOP are:
128,000
139,000
161,000
173,000
2- The most important levels are 161K & 173K
3- But apart from these levels, be ready for any level to be the TOP.
(and again, Bull market is not over, watch my previous analysis BTC/XAG on the last post)

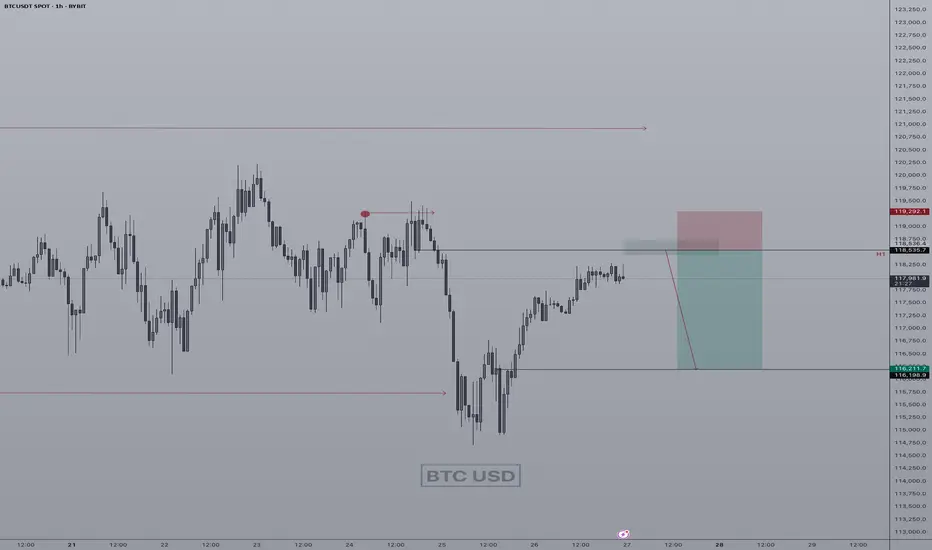
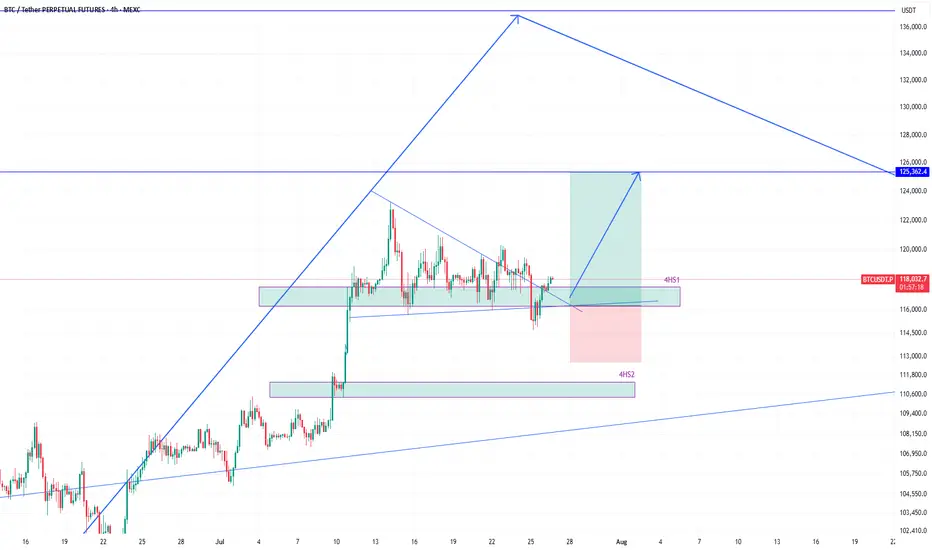
BTCUSDT eyeing 125k next after bounce from 116k zoneEarlier I shared the high time frame view of #BTCUSDT. We know that its heading higher and that helps in holding spot positions.
However, the move to the high frame target will not happen in a straight line, instead with various push to the upside and then subsequent corrections to the down side.
Therefore, as a trader, we must profit from those movements as we see some good high probability setups.
And there is one right now which is a long position.
The price broke 4h support 4HS1, but quickly reclaimed it. That is a sign of demand and strength required to move higher.
Therefore, this presents a long opportunity where the target of this long position should be 125k.
As the price enters into 4HS1 zone, I will scale into long position.
It is quite likely that the price will bounce hard once it taps into 4HS1 zone.
I am talking this long position targeting 125k. What about you? Share with me what you think.
BTC NEXT MOVE UPWARS OR BREAKDOWN?We can see btc hovering over bullish ob
We can expect a pump from here
If breakdown both bullish ob we can look for shorts
Indicator used tuffycalls smc orderblock
SellRejection Level
Daily Volume
Market Structure Shift
London US Session
Trend Line Break
Untapped Order Point
Teach me to fish, don’t hand me the catch.
---
🎯 **“Teach me to fish, don’t hand me the catch.”**
That’s the mantra behind what we do.
We’re not here to hand you quick wins—we’re here to equip you with the tools, mindset, and precision to master the art of **technical analysis**.
📚 **Follow Us** as we unlock proven strategies, crafted through years of experience and sharpened by real market conditions.
💼 **What You'll Get:**
- High-performance analysis techniques
- Visual case studies from our **actual trades**
- Clear examples from the insurance sector and beyond
- A blueprint to recognize and seize winning setups with confidence
💥 Whether you're new or seasoned, this isn't textbook theory.
This is **applied strategy**, built for clarity and verified by results.
---

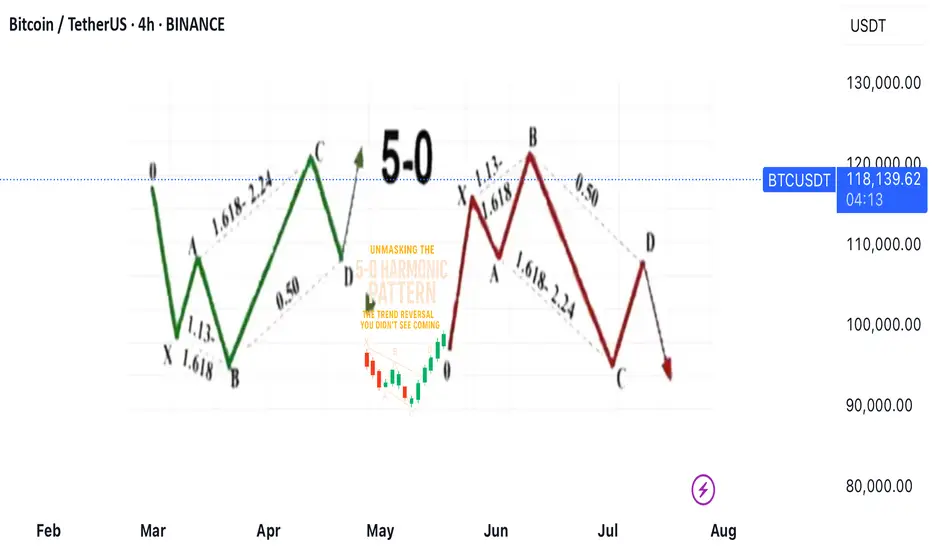
Unmasking the 5-0 Harmonic Pattern
---
🎯 **Unmasking the 5-0 Harmonic Pattern: The Trend Reversal You Didn't See Coming**
Discovered by the visionary Scott Carney and unveiled in _Harmonic Trading, Volume Two_, the **5-0 pattern** isn't just another blip on a trader’s radar—it’s a siren of market reversal.
📈 **Why It Stands Out**
- Unlike the familiar Bat or Gartley structures, the 5-0 pattern is fueled by **precise Fibonacci ratios**, making its reversal zone deadly accurate.
- Centered around the pivotal **Point B**, this model doesn’t just hint at change—it defines it.
🌀 **The Anatomy of a Flip**
- Often marking the **first true pullback in a major trend reversal**, the 5-0 isn’t a lagging indicator—it’s your early warning system.
- The **AB leg?** That’s no ordinary wave—it’s usually the final gasp of a fading trend, setting the stage for powerful new momentum.
💥 **Bottom Line**
This isn’t just technical analysis—it’s strategic foresight. The 5-0 pattern reveals where the market **hesitates... and where you strike**.
---
_"To truly learn, we must see it in action.
So let’s pull back the curtain and share a powerful example from our **past insurance market trades**—a deal that blended precision, timing, and strategy.
In comments