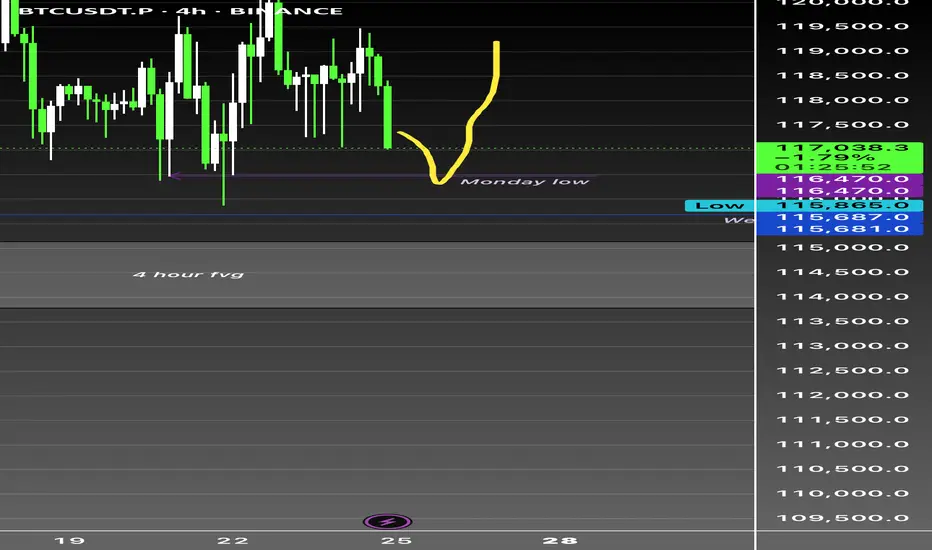
Btc bullish as long as weekly holds CRYPTOCAP:BTC 4H Analysis - Current: $117,150 (-0.97%)
Range-bound between $115,687 week low and $120K+ resistance. Monday low at $116,500 serving as immediate support - critical inflection point.
4H Fair Value Gap clearly defined - institutional liquidity zone demanding respect. Market structure showing inducement above $120K highs with potential liquidity sweep of Monday lows to trigger directional move.
Order blocks forming around $116.5K-$117K zone. Break below $116,500 targets $115,687. Reclaim of $118,500 needed for bullish continuation.
Higher timeframes remain constructive despite 4H consolidation.
#Bitcoin #BTC #SMC
USTBTC trade ideas
BTCUSD SHORTI've spotted a potential short-term bearish move in Bitcoin. Taking a closer look at the 4-hour chart, it seems like we're on the brink of a short-term reversal that could align perfectly with the higher time frame trend. Let's see how this plays out

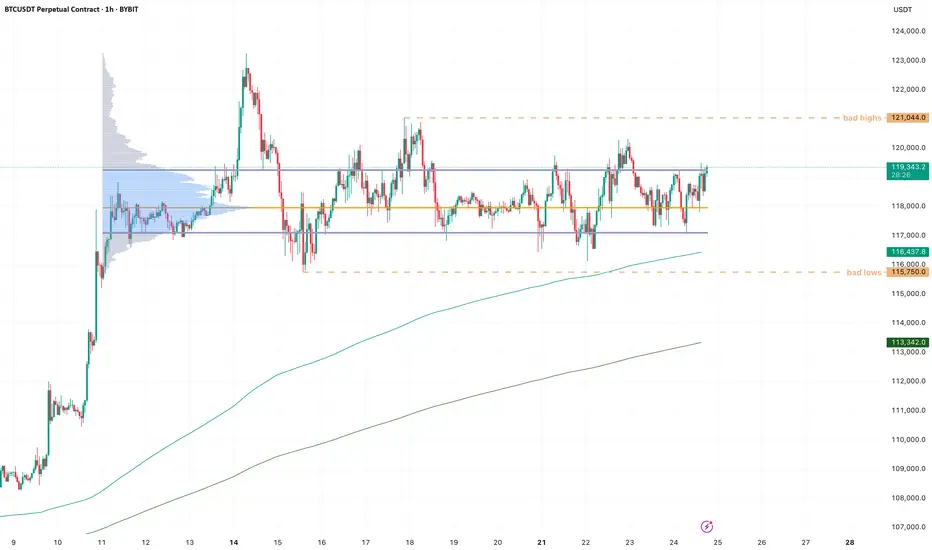
BTC - RotationsStill pingponging between VAL and VAH, so there is not much to update on BTC.
I think patience is key here, most of all don't chase moves but position at the extremes for opposite side, then you are much better placed for continuation moves.
I never try to have much expectations, but there is a smol gut feeling that ETH puts in a new high locally (let's say around 3920-50) while BTC takes out the internal highs at 121k and makes a lower high.
I can be wrong and we simply keep drifting higher, but divergences between ETH and BTC are often worth watching, because the market as a whole usually struggles to maintain strength when alts attract more capital than BTC does (relative to mc).
BTC-----Buy around 117600, target 118000-119000 areaTechnical analysis of BTC contract on July 24:
Today, the large-cycle daily level closed with a small negative line yesterday, the K-line pattern was single negative and single positive, the price was at a high level, and the attached indicator was dead cross running, but note that the overall trend has entered the range of fluctuations, and there is no continuation of price increases and decreases. In this case, we should pay attention to the rhythm of washing the plate, which is a very common trend rule, and it is also the trend that many trading friends are most likely to lose money. If you can't find the rhythm and are not calm enough, then the result is back and forth stop loss; the short-cycle hourly chart fell yesterday without breaking the low US market and the price consolidated in the early morning. The Asian morning rose continuously. The current attached indicator is golden cross running, and the price is above the moving average, so today's trend is still rising during the day and then retreating under pressure. It is likely to remain in the range of fluctuations, with a high point near the 121000 area and a low point of 115700 area.
Today's BTC short-term contract trading strategy:
More in the 117600 area, stop loss in the 117000 area, target 118000-119000 area;

It's an Evacuation Through Green Candles💥 "One Last Leap of Faith?" - What Bitcoin Might Be Hiding Before September
The world’s on fire: Israel, Iran, Strait of Hormuz, oil, elections, the dollar, rates, black swan whispers.
And someone’s out here saying Bitcoin might still go up?
Yes. We are. Not because we believe - but because we see.
📉 Everyone’s afraid. The whales aren’t.
When the crowd goes into survival mode, the real game begins.
Whales aren’t exiting - they’re accumulating.
ETFs aren’t pausing - they’re inflowing.
The technical setup isn’t breaking - it’s compressing like a spring.
$104,000. Coil building.
If we break out - targets at $132K–$140K are absolutely in play.
👉 But that’s not the point.
The point is why this is happening while the world is burning.
🧠 The idea: Bitcoin isn’t a safe haven. It’s a distribution machine.
Gold is for panic.
Bitcoin is for structure.
Institutions don’t ask “is it scary?” - they ask “where’s liquidity?”
Everything is aligning for one last upside move.
Until September. After that - chaos is back on the table.
💣 The Global Playbook:
Now (Summer) - Consolidation, ETF flows, geopolitical fear - Strategic entries, low exposure
Breakout - FOMO panic, retail rushes in - Profit-taking via options
September–Fall - Macro/geopolitical shock - Already in cash or hedged
📌 Bottom Line
Yes, Bitcoin might pump. Not because the world is fine - but because someone needs to exit beautifully.
If you're reading this - you're early enough to think.
Markets don’t reward justice. They reward positioning.
🛠 What to do right now:
Watch the $104,000 level - it's the pivot
Breakout = final upside push to $132K–140K
Keep your eyes on September - reversal zone
Think in scenarios: entry, exit, protection
Follow EXCAVO - we don’t guess, we read the game
I've been talking about this scenario for a long time

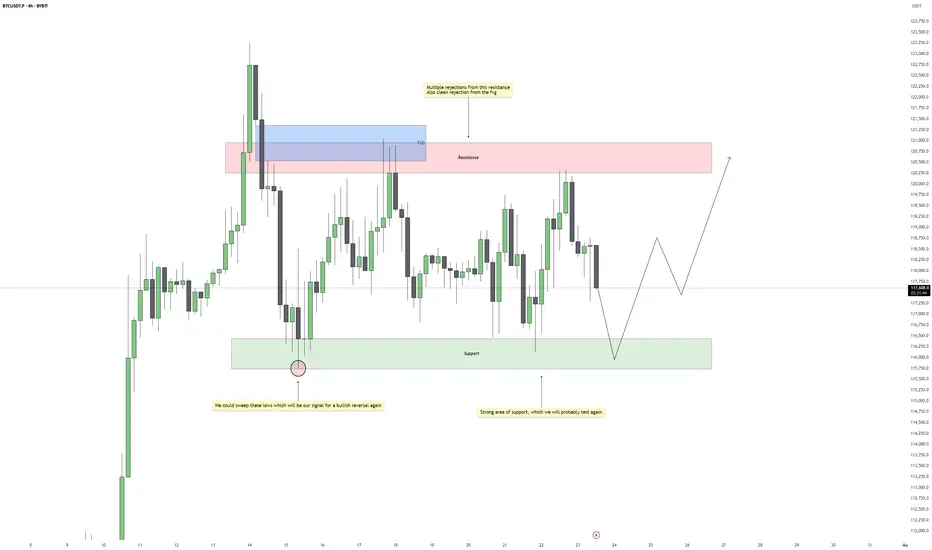
Bitcoin - Bullish Reversal PotentialBitcoin is currently consolidating within a well-defined range, with repeated rejections from the upper resistance zone and strong reactions from the support below. Price continues to respect both ends of the structure, suggesting that liquidity is being built up on both sides. Until a clear breakout occurs, we should expect more range-bound movement with sharp rejections near the boundaries.
Support Zone and Liquidity Engineering
The support zone beneath current price action has already held several times, showing clear buying interest. However, the lows around this area remain relatively clean. A sweep of those lows would not only engineer sell-side liquidity but also set the stage for a reversal if buyers step back in. This would align well with typical accumulation behavior seen during consolidation phases.
Rejections from Resistance and FVG Influence
Price has shown multiple rejections from the resistance zone, particularly inside the fair value gap that sits just above it. This confirms that the area is actively defended and will likely be the next upside target if price manages to bounce from support. The FVG itself acts as a magnet once price begins to trend again, especially if a strong displacement follows a sweep.
Expected Flow and Trade Opportunity
The anticipated scenario involves price dipping back into support, possibly sweeping the lows for inducement, and then bouncing with a shift in short-term structure. If that happens, we can expect a move back toward resistance, completing another rotation within the range. The sweep would offer an added layer of confirmation, giving a stronger reason to look for long setups.
Invalidation and Risk Perspective
If support fails to hold and price breaks beneath the range without immediate recovery, that would invalidate the bullish view and point to a potential shift in directional bias. As long as price stays inside the current consolidation, however, this remains a waiting game for either a clean reaction from support or a sweep followed by structure shift.
Conclusion
Bitcoin remains locked in a clear range, and until the breakout happens, the edges of that range offer the best trading opportunities. A sweep of the lows would act as a high-probability signal for a reversal back to the highs. Patience is key, wait for the sweep and confirmation before committing to the upside.
___________________________________
Thanks for your support!
If you found this idea helpful or learned something new, drop a like 👍 and leave a comment, I’d love to hear your thoughts! 🚀
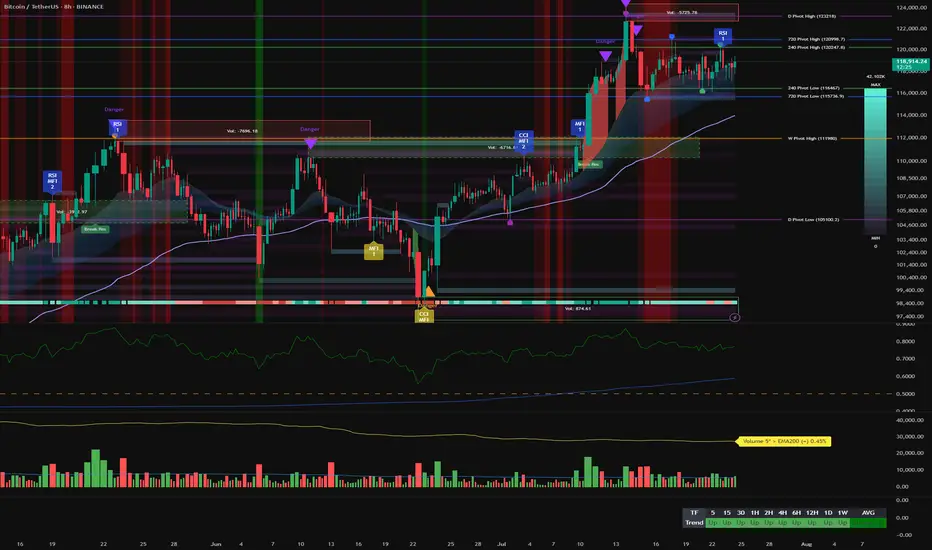
Bitcoin Bullish Structure Holds: Focus on Support Entries & Brea__________________________________________________________________________________
Technical Overview – Summary Points
__________________________________________________________________________________
Momentum: Uptrend synchronization on all timeframes (MTFTI Strong Up). Risk On / Risk Off Indicator: strong buy on larger TF, neutral intraday.
Supports/resistances: Main HTF supports well below current price (115,736–117,000, 111,980). Key resistances to break: 120,998.7 and 122,318.
Volumes: Normal to moderate, no climax, no distribution detected.
Multi-TF behaviour: No behavioural excess, no sell signal, intraday phases are consolidative just below resistance, which is normal.
__________________________________________________________________________________
Strategic Summary
__________________________________________________________________________________
Overall bias: Strong bullish, no end-of-trend alert. Buying retracement towards the Pivot Lows is preferred.
Opportunities: Entries on dips to 115,700–117,000 (2H/4H); breakout above 120,250/122,300.
Risk zones: Return below 115,700 or 111,980 = structural alert. Increased vigilance for macro releases (ECB/PMI/Jobless Claims).
Macro drivers: Fed in focus (no move expected), volatility risk around July 29–30 (FOMC).
Action plan: Entry on retracement, dynamic management. Stop-loss under 115,736 then 111,980. Partial exits on excess or confirmed breakout.
__________________________________________________________________________________
Multi-Timeframe Analysis
__________________________________________________________________________________
1D: Resistances 122,318, 120,998.7; supports 115,736.9, 105,100.2. Risk On / Risk Off Indicator: strong buy, all synchronized bullish, no exhaustion. Daily bias: robust uptrend.
12H/6H/4H: Bullish confluence. Strong momentum, stable volume, validated supports. No ISPD excess, sectoral strength intact.
2H/1H: Consolidation below resistance; healthy structure. Supports to be favored for swing/intraday positioning. Minor intraday hesitation, no reversal.
30min/15min: Behavioural neutrality, lateral movement. Volume normal to mildly elevated, no overheating. Structural risk absent.
Additional indicators:
Risk On / Risk Off Indicator: Strong buy up to 2H; neutral on short TF.
ISPD DIV: Neutral, healthy market, no excess detected.
Volume: No climax or distribution, multi-TF structural support.
Cross-timeframe synthesis: Multi-timeframe bullish alignment, no structural weakness. Opportunities on retracement, breakout plays above all-time highs.
__________________________________________________________________________________
Synthesis & Strategic Bias
__________________________________________________________________________________
BTC trend and momentum remain aligned, sector leadership (Risk On / Risk Off Indicator) intact.
Strong HTF support, major resistances must break for extension.
External risk: macroeconomic catalysts (Fed, ECB, US PMI).
Premium opportunities on dips to supports, dynamic management essential around macro events.
Final bias: as long as supports and indicator alignment hold, bull run continues. Partial exit at resistance; stops below validated pivots.
The combination of the Leo New Moon and the Gann Square support Astrologically, we have two important events, the first is the new moon in Leo, which will cause a new movement in the market and give new life to the market. The second is the opposition of the Sun and Pluto, which caused a power struggle between buyers and sellers and at some point there were several stop hunts, but now it seems that the price above 118 thousand is stabilizing and could start a new rally upwards.

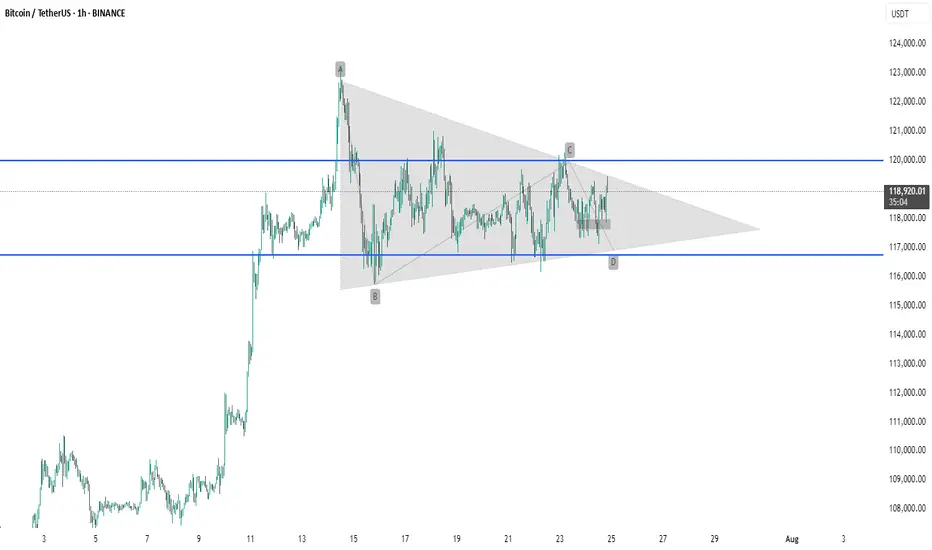
BTC #The chart shows Bitcoin (BTC/USDT) on a 1-hour timeframeThe chart shows Bitcoin (BTC/USDT) on a 1-hour timeframe forming a symmetrical triangle pattern, marked by points A, B, C, and D. This consolidation pattern indicates potential for a breakout as price volatility contracts. Key support is around $117,000, and resistance is near $120,000. A breakout above or below the triangle could signal the next major move. Traders typically watch for volume confirmation before entering a trade.
thanking you
Bitcoin is testing the triangle ┆ HolderStatBINANCE:BTCUSDT is ranging $132K–$137K in a triangle pattern. Breakout above $137K may target $143K. Decision point near.

Historic moments for BTC?! Perhaps these are the most exciting weeks in BTC's history! The most persistent trendline many of us have been watching over the years is here on our horizon...!
Let's see what happens...

Is it time for BTC big reverse?According to oscillators and volumes, we can expect BTC to soon undergo a significant correction:
- RSI peaks are declining, forming a divergence. A divergence is also observed on the weekly timeframe.
- MACD also shows a divergence.
- Falling volumes amid rising prices.
Horizontal lines mark two levels with minimum volumes in the profile. Such volume drops usually characterize support levels, which can be used as targets for shorting.

BTC LONG : Next Target - 133KBTC bull run is back in full swing with no visible resistance in sight.
Next area of interest according to fib extension is 133K.
Bulls in full control till then.

BTC/USDT Analysis. Inside the Range
Hello everyone! This is the daily analysis from a trader-analyst at CryptoRobotics.
Yesterday, Bitcoin tested the previously mentioned POC (the point of control — the area with the highest volume concentration within the range). A reaction followed: buyers prevented the price from falling below that level.
At the moment, we still expect a breakout from the range to the upside. On the lower timeframe, buyers are once again trying to gain control through delta. If the price breaks above $118,800, we can expect a move at least toward ~$120,000. A potential retest of the local zone at $118,000–$117,600 (signs of market buying aggression on the 15m timeframe) is also possible, followed by a continuation of the uptrend. Larger buy zones are marked below.
Buy zones:
~$115,000 (zone of initiating volumes)
$110,000–$107,000 (accumulated volumes)
This publication is not financial advice
BTCUSD NEW OUTLOOKBTCUSD market Continuously running in both sides from last couple of days now market will be touch the support zone you have to great chance to go long from
SOPPORT ZONE if you want
TRADE AT YOUR OWN RISK
REGARD ALBERT

BTCUSDTHello Traders! 👋
What are your thoughts on BITCOIN?
After setting a new all-time high, Bitcoin remains in a corrective phase, marked by sideways price action and choppy movements.
There's a notable gap around the $114,000 level, which may act as a magnet for price during this correction.
The ongoing pullback is likely to extend toward the key support zone, which aligns with the previous breakout level and the bottom of the ascending channel.
Once this support holds, we could see a bullish reversal, targeting the upper boundary of the channel once again.
As long as Bitcoin remains above the marked support zone, the overall structure stays bullish and this correction may present a buy-the-dip opportunity.
Will Bitcoin fill the gap and bounce back toward new highs? Let us know your thoughts! 🤔👇
Don’t forget to like and share your thoughts in the comments! ❤️

TradeCityPro | Bitcoin Daily Analysis #136👋 Welcome to TradeCity Pro!
Let’s get into the analysis of Bitcoin and major crypto indices. As usual in this analysis, I’m going to review the futures triggers for the New York session.
⏳ 1-Hour Timeframe
On the 1-hour timeframe, price is still ranging inside the box, and none of its triggers were activated yesterday.
✔️ The support floor is at 117,342, and another key support zone is around 116,000.
✨ If these zones break, Bitcoin may begin a deep correction. In that case, we can open short positions or close long-term long positions that we’re already holding.
⭐ For long positions, we still have the 119,395 and 120,594 triggers. A breakout of either zone could provide a very good entry point for the next bullish leg of Bitcoin.
👑 BTC.D Analysis
Let’s move on to Bitcoin Dominance. Yesterday, dominance stabilized above the 61.20 zone, and as I mentioned before, breaking this zone led to a bullish leg, which continued up to 62.41, and currently, it has more bullish momentum.
💥 If 62.41 breaks, the bullish momentum will intensify. However, I still believe the overall trend is bearish, and if 60.46 breaks to the downside, the decline could continue.
📅 Total2 Analysis
Let’s go over Total2. This index has continued to correct and has now dropped to the 1.41 zone, which corresponds to the 0.5 Fibonacci level. It has now created a trigger around 1.47.
⚡️ If 1.47 breaks, we can open a long position. Our next trigger will be 1.53.
A breakout of 1.53 would signal the start of the next bullish wave.
📅 USDT.D Analysis
Now to Tether Dominance. This index has finally exited its range box and has broken the 4.25 level.
The current resistance stopping price is 4.36.
🔔 If dominance drops back below 4.25, strong bearish momentum could hit, increasing the likelihood of a breakdown of 4.13.
❌ Disclaimer ❌
Trading futures is highly risky and dangerous. If you're not an expert, these triggers may not be suitable for you. You should first learn risk and capital management. You can also use the educational content from this channel.
Finally, these triggers reflect my personal opinions on price action, and the market may move completely against this analysis. So, do your own research before opening any position.

BTC AI Prediction Dashboard - 6h Price Path (23.07.25)
Prediction made using Crypticorn AI Prediction Dashboard
Link in bio
BTCUSDT Forecast:
Crypticorn AI Prediction Dashboard Projects 6h Price Path (Forward-Only)
Forecast timestamp: ~11:00 UTC
Timeframe: 15m
Prediction horizon: 6 hours
Model output:
Central estimate (blue line): -118,258
Represents the AI’s best estimate of BTC’s near-term price direction.
80% confidence band (light blue): 118,206 – 118,719
The light blue zone marks the 80% confidence range — the most likely area for price to close
40% confidence band (dark blue): 117,712 – 119,423
The dark blue zone shows the narrower 40% confidence range, where price is expected to stay with higher concentration
Volume on signal bar: 133.21
This chart shows a short-term Bitcoin price forecast using AI-generated confidence zones.
Candlesticks reflect actual BTC/USDT price action in 15-minute intervals.
This helps visualize expected volatility and potential price zones in the short term.

[SeoVereign] BITCOIN BULLISH Outlook – July 24, 2025We are the SeoVereign Trading Team.
With sharp insight and precise analysis, we regularly share trading ideas on Bitcoin and other major assets—always guided by structure, sentiment, and momentum.
🔔 Follow us to never miss a market update.
🚀 Boosts provide strong motivation and drive to the SeoVereign team.
--------------------------------------------------------------------------------------------------------
Hello.
This is SeoVereign.
I am still holding the long position that I suggested in the idea posted on July 9th.
Regarding the upward trend that started around 107,200 USDT, I have consistently maintained my position without much doubt until just before posting this idea, as there were no clear signs indicating a decline.
However, at the time of writing this idea, some elements suggesting downward pressure are gradually being detected. Nevertheless, this idea is constructed around the upward scenario. The reason is that, as mentioned in this idea, a ‘single upward move’ is expected to occur with relatively high probability. Whether this rise leads to a trend reversal or serves as a precursor to a downturn will likely depend on how the chart unfolds.
The average TP (target price) is set around 119,300 USDT.
As always, I will carefully observe how the chart develops over time and will update with further explanations that organically integrate the detailed interpretations and grounds of this idea accordingly.
Thank you.

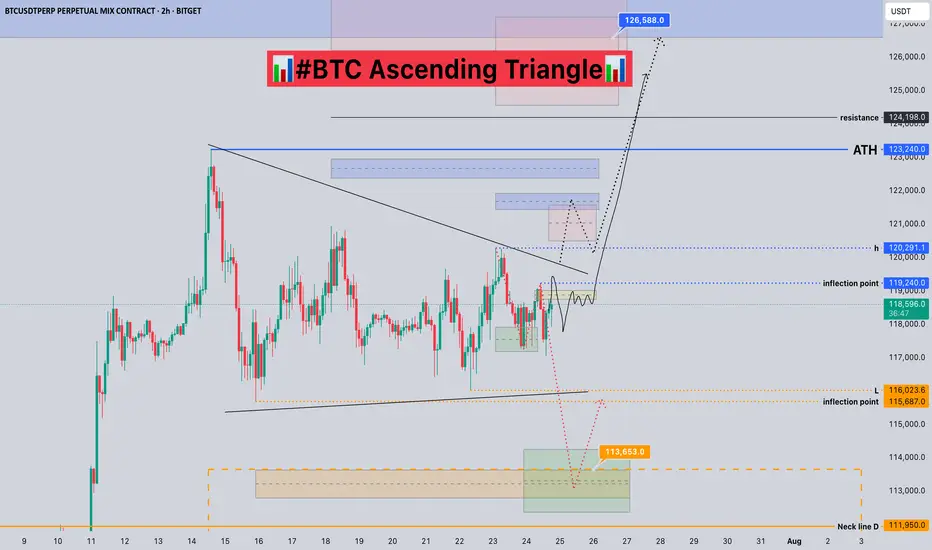
#BTC Ascending Triangle📊#BTC Ascending Triangle📊
🧠From a structural perspective, we are still in a sideways consolidation phase. We have already built a short structure. If we want to continue to rise, we need to break through the blue turning point 119240 and stabilize before we can usher in a big surge.
➡️From a morphological perspective, an ascending triangle is forming. After breaking through h, it is confirmed that the upward breakthrough will occur. The subsequent pullback is worth our participation.
⚠️If we fall below the low point near 116000, we cannot blindly go short, because the sideways consolidation time is too long. After the selling pressure is exhausted, the lows that appear are all opportunities for us to participate in long transactions.
🤜If you like my analysis, please like 💖 and share 💬 BITGET:BTCUSDT.P
Sell Signal on Bitcoin (1-week timeframe)The IQTrend indicator shows a Sell signal on the weekly timeframe for BINANCE:BTCUSDT .
I also noted the percentage of movement after previous signals so that you understand the seriousness of the situation.
Of course, this time it may be a little different, but I think it's worth keeping this signal in mind anyway.
DYOR

BTCUSDT-LONG IDEABTCUSDT is in accumulation forming a triangle if it break this triangle then it will be heading toward top end of the pole buy using a buy stop Stop loss and take profit is mentioned in the chart

Bitcoin (BTC): Liquidity Hunting + Buyside Dominance | Bullish!What a week we have had so far; it has moved this whole week so far like one big rollercoaster, but nevertheless we are still above the $116K zone so we are bullish.
While we see slight buyside dominance,, we also see huge order limits sitting at $115K,, which means we might still see some kind of "last liquidity hunting."
That being said, we are keeping an eye on $116K and $115K zones.
Swallow Academy
