Potential head and shoulders pattern appears on Bitcoin’s globalHey everyone!
I've been on TradingView for a while, but this is my first post — so go easy on me 😄
I'll keep it short and straight to the point.
---
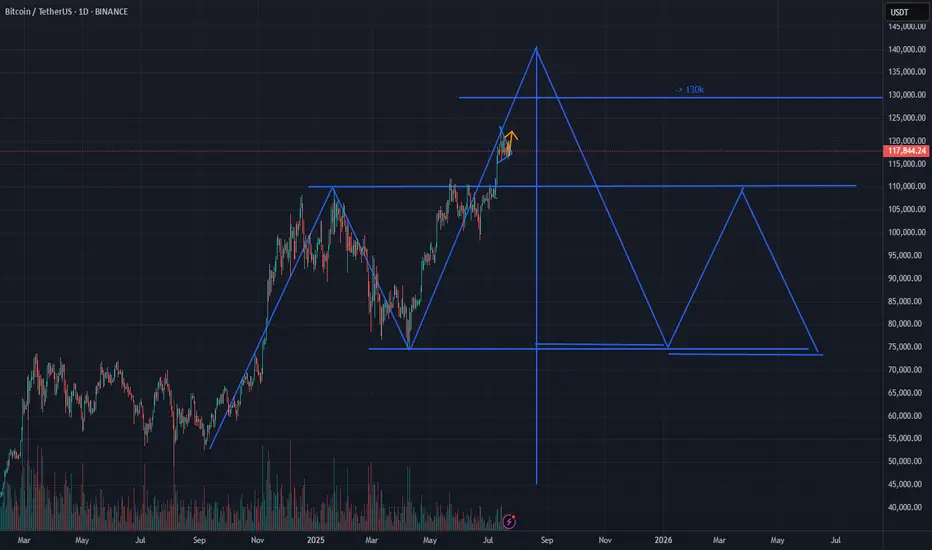
A head and shoulders pattern is forming on the global Bitcoin chart
The pattern is not yet fully formed, and it is difficult to draw any conclusions, but what has already formed may indicate the implementation of this pattern, which we may see in the near future, which means that an upward movement is possible, before the head is formed
Current price: $118k
With this pattern, there is a low probability of a price breakout to $103.4k
The head of the pattern may be at $124k or $129k, provided there is no strong positive news background from the US government regarding Bitcoin
This analysis is based on the technical pattern and also incorporates AI to provide more accurate results.
---
I'd be happy to hear your thoughts, feedback, or any constructive criticism in the comments!
USTBTC trade ideas
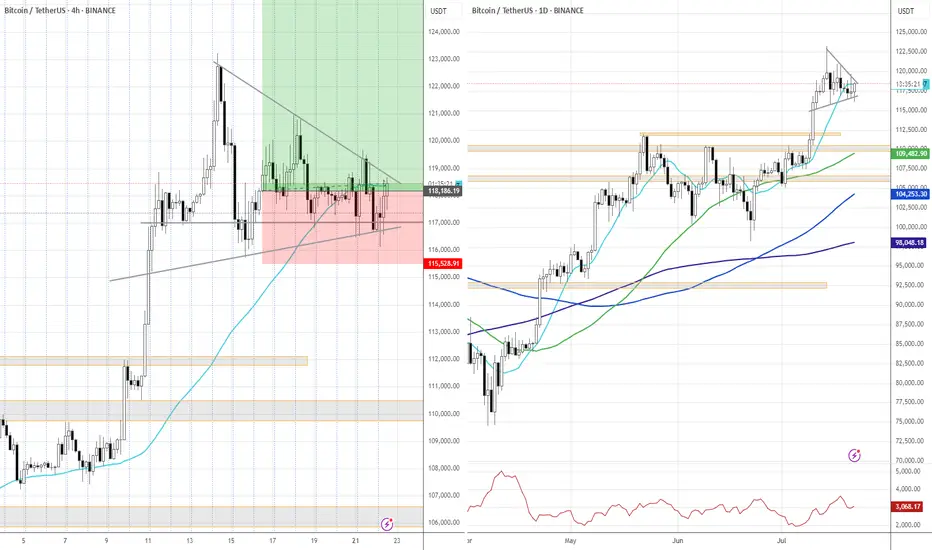
Bitcoin (BTC): as long as we are above $116K we are BULLISH!First things first, we are still above $116K, and since hitting the ATH, we have been forming a perfect zone of accumulation, which is ideal for another retest of the local high and movement to the next ATH.
What we are looking for here is maybe further movement in the sideways channel, which eventually should lead the price to ATH for a breakout attempt!
Swallow Academy

Bitcoin is OverheatedI’m observing the current situation in the BTC market and want to share a brief reflection. The latest upward impulse doesn’t just look confident—it’s starting to resemble overheating.
The price has detached from its averages, and the movement is accompanied by local euphoria. I see the community piling in “at the highs,” hoping for continuation. But it’s crucial to understand: markets don’t grow forever. Especially when the growth lacks proportional volume and fundamental support.
I use a comprehensive technical approach, and one of my indicators has given a clear signal—the market is overheated. We’re currently seeing a classic state of overbought conditions: the price is moving too far, too fast.
This doesn’t mean you should immediately short or panic. But as a trader, I understand that in such a phase, it’s wiser to:
– Partially take profits,
– Move stops closer to the market,
– And absolutely avoid entering new longs on emotions.
Typically, after such surges, the market either consolidates or corrects by 10–20% to shake off the overheating and provide an opportunity to enter at fairer levels. Personally, I’m waiting for a return to balance and a reset. I don’t rule out a final “explosive” move upward on news, but such breakouts usually end as quickly as they begin.

BTCUSD 16.07.2025 ~+ General gloom over USD (pressure on Powell, tariffs, BB Bill)
* Mostly technical trade
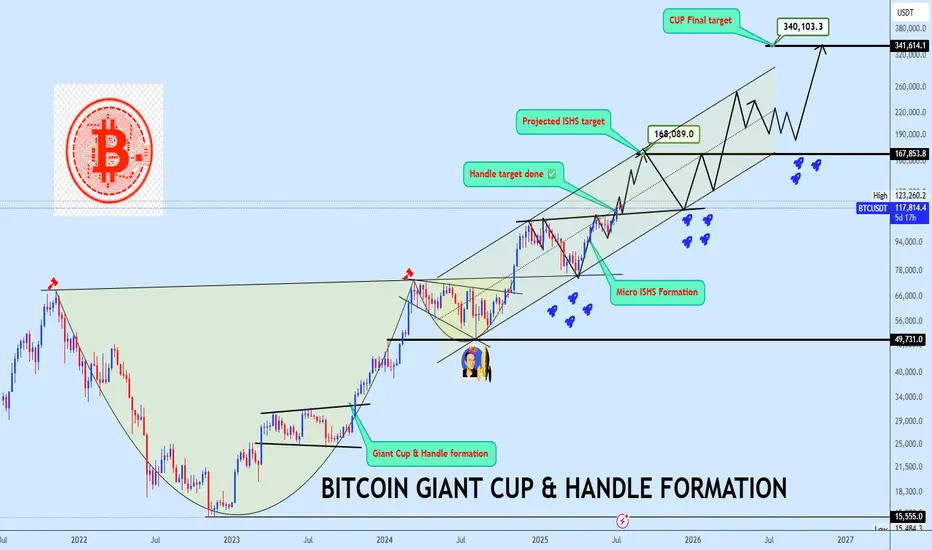
Bitcoin Bottom Three in progress targeting $340kBitcoin continues to defy the doubters, extending its dominance and triggering milestones that once seemed unreachable. A few years ago, we projected a massive rounding bottom with a target near $123K to complete the bottom two of the third halving cycle a bold forecast that has now played out in full:
📌
With bottom two now in the rearview, our focus shifts to bottom three of the fourth halving cycle, projected to mature around October 2025, barring time shifts:
📌
As shown on the chart, price has now split into a giant Cup & Handle formation and successfully broken out from the neckline. BTC is currently coiling inside a rising channel structure with trajectory toward the final projected target at $340K. A micro inverse head and shoulders (ISHS) formation has also emerged, offering a key accumulation zone near the neckline, this will be a crucial region to watch for entries.
Let price action do the talking. Share your view and let’s dissect this historic setup together.
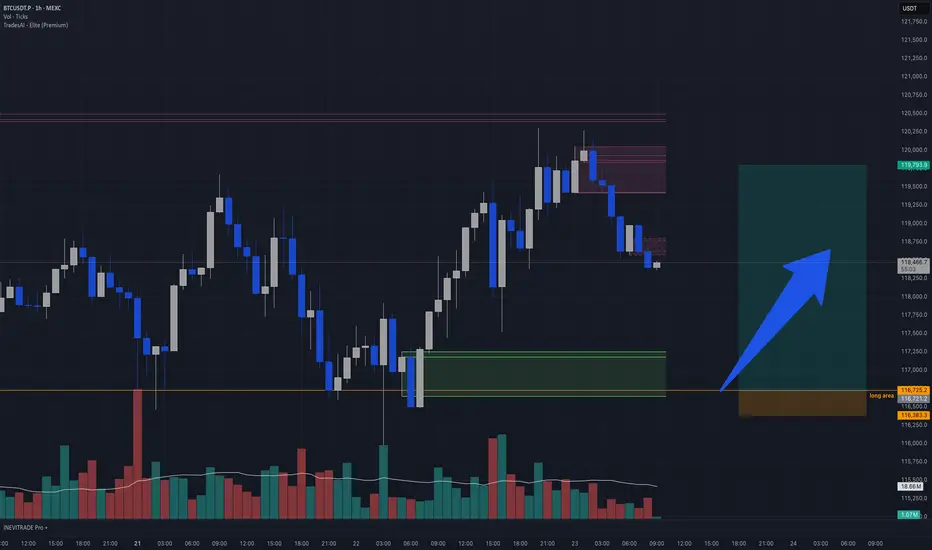
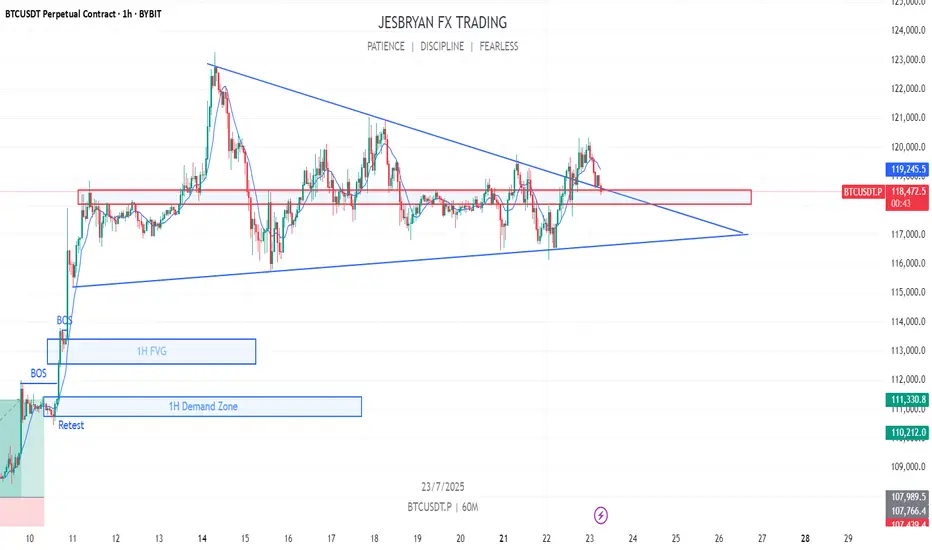
BTC intraday long idea BTCUSDT Intraday Idea | 1H Chart
Price recently pushed into a key supply zone and is now pulling back after a strong impulsive move. The highlighted green box marks a demand block or breakout origin, with confluence from high volume and previous rejection.
🟩 Long Area:
116,725 – 116,300
This area acted as a bullish breaker and low-volume node. Price previously wicked deep into this zone before a strong bullish push, suggesting unfilled orders remain. If price retests this zone, a reaction is likely.
Reason for Entry:
• Strong displacement from demand
• Price forming lower highs into potential mitigation
• Decreasing sell volume on the pullback → signs of absorption
• Clean R/R with tight invalidation
📉 Short-term Sell-off:
This retracement is likely a liquidity grab or order block mitigation, pulling into the long zone to refill institutional orders.
📈 Target Zone:
119,750+ – aligned with recent inefficiency and prior high.
BTC analysis: FOR 23 JULY 2025Bitcoin has broken out of the triangle pattern in an upward direction and is now set for a retest. If the price is able to hold above this level, we could see a continuation of the upward movement. The first resistance level is at $120,000, and a break above this could propel us toward a new all-time high.
Can BTC Reclaim 118,700?1% a day can near 400% my life.
I Spot Longed BTC looking for a 1% up, might take awhile but, BTC is king, I will wait. and when it hits, a couple of memes have retraced on the daily, I will be looking for more riskier memes for a higher %pump.
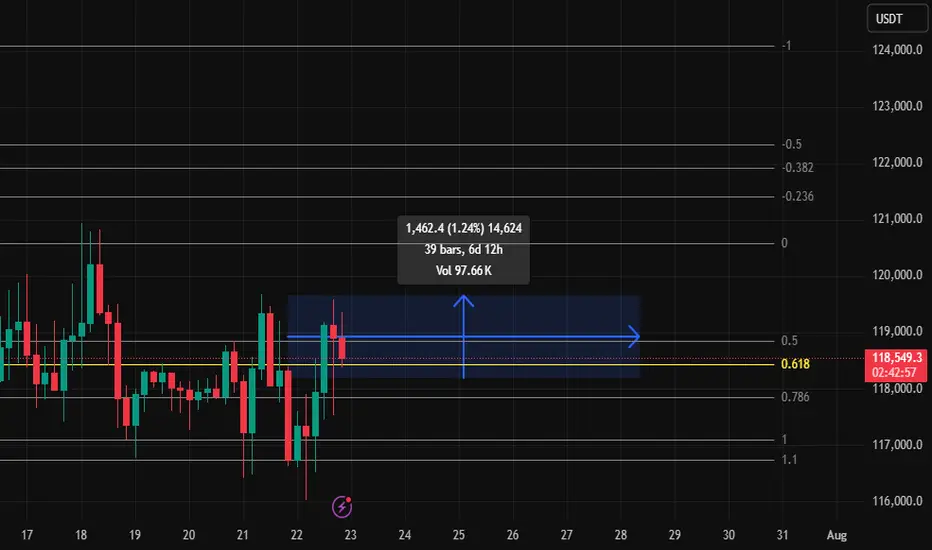
BTC/USDT – Range Formation Before Next Move?Bitcoin is currently consolidating between $117,000 support and $120,000 resistance, forming a tight sideways range after a strong breakout.
🔹 Structure Insight:
Bullish rally stalled at $120K resistance zone.
Range-bound candles with wicks on both ends = indecision.
Strong demand zone near $117K, acting as short-term floor.
🔸 Indicators Flash Neutral Bias:
RSI cooling off below overbought zone (~63) – no strong momentum.
ADX low and flattening – trend weakening.
MACD losing strength – bull momentum fading.
Volume declining during consolidation = awaiting catalyst.
🟢 Bullish Trigger: Break above $120K with strong volume could ignite next leg up → Targets: $122K–$127K
🔴 Bearish Trigger: Breakdown below $117K opens door to $114K–$112K retest.
🧭 Outlook: Sideways range – wait for breakout confirmation before positioning aggressively.
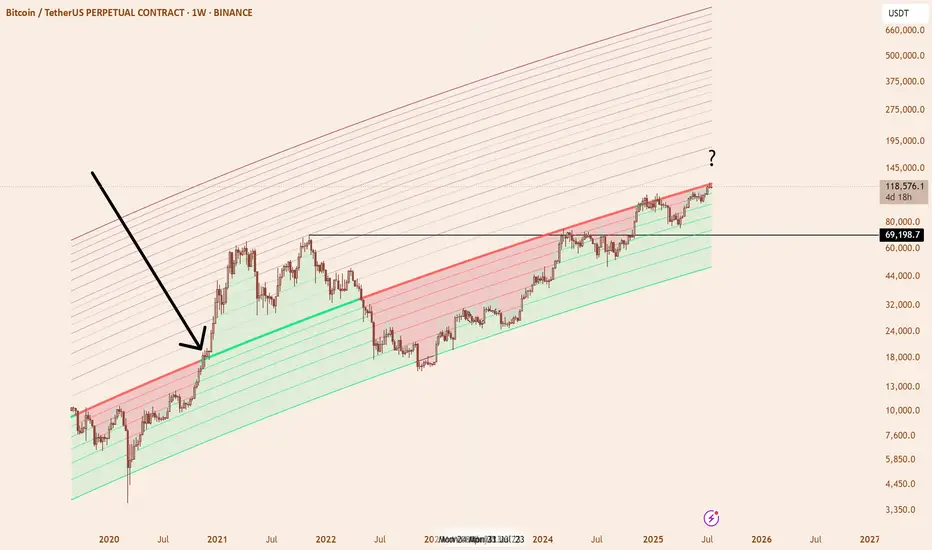
Power Law GrowthWhat you’re seeing is a Power‑Law Growth Corridor plotted over the weekly BTC/USDT price. In essence, it’s a dynamically‑sloped channel built on a power‑law fit of price vs. time, rather than the usual straight‐line
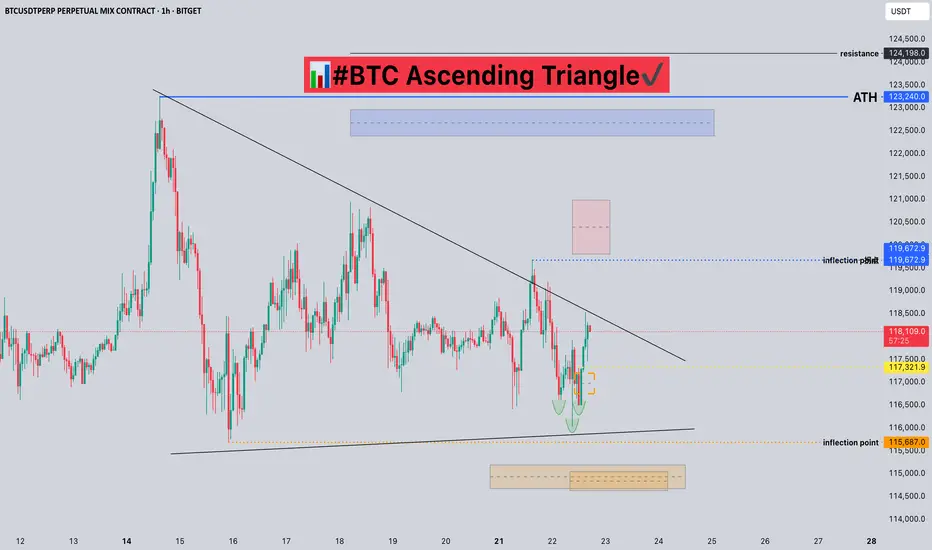
#BTC Ascending Triangle📊#BTC Ascending Triangle✔️
🧠From a structural point of view, we are still in a long-term bullish trend, and the short-term short structure of the small cycle is difficult to change the trend force of the large cycle. And we have been sideways here for a long time, digesting the selling pressure here, and it seems difficult to pull back. And the 15m level has built a bullish head and shoulders structure, so please be cautious about shorting!
➡️From a morphological point of view, the price is gradually compressed and formed into an ascending triangle. Generally, we will use this model to continue the original trend force.
⚠️Note that if we fall below the inflection point of 115687, it means a short structure at the 4h level. We need to be alert to further pullbacks. At that time, if we want to participate in long transactions, we need to find a lower support level to participate, such as around 112000.
Let's take a look👀
🤜If you like my analysis, please like💖 and share💬 BITGET:BTCUSDT.P
BTCUSD BULISH TRANDE Btuusd buy from 117,500
tp 118,500
tp 119,500
tp 120,590
Stope Lose 116,000
TRADE AT YOUR OWN RISK

long reng for mach timei thing we have reng sid for long time and 77500 / 133000 is on
but in line i see very opportunity fo trad
for just personal in other coin :)

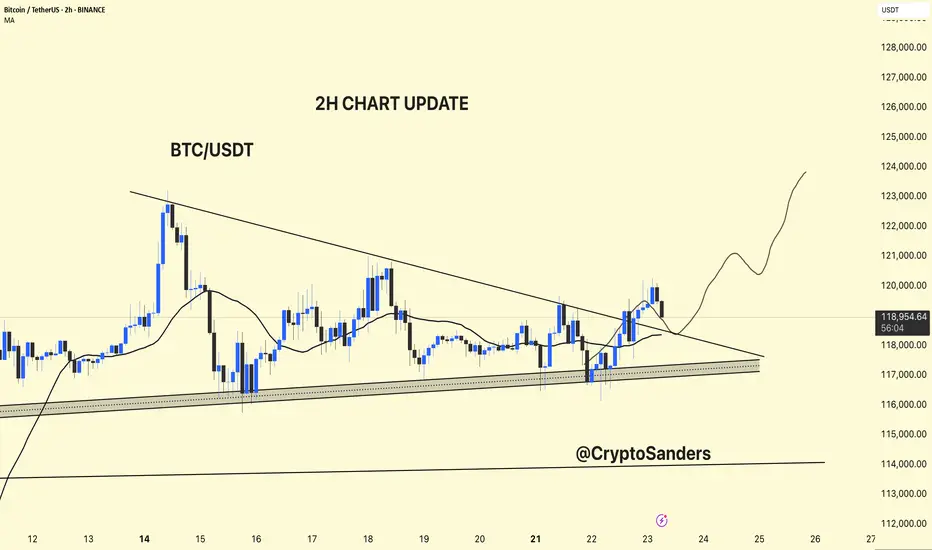
BTC/USDT – 2H Chart Update!!BTC/USDT – 2H Chart Update
Breakout Confirmed:
BTC has broken above the descending trendline but is currently facing resistance at around $ 119,500.
Support Zone:
Strong ascending support between $ 117,000 and $ 118,000 remains intact.
Moving Average:
Price is currently testing the 2H MA (~$118.3). Holding above this could confirm bullish continuation.
Outlook:
If BTC holds above $ 118,000, a move toward $ 123,000–$ 125,000 is likely.
Failure to hold may retest $117K support.
Bias: Short-term bullish unless price breaks below ascending trendline.
Thanks for your support!
DYOR. NFA
BTC # 15-minute BTC/USDT chart This 15-minute BTC/USDT chart shows a key breakout structure:
Ascending trendline (red) supported price before a breakout.
Horizontal line marks a previous resistance turned support post-breakout.
Vertical red line represents the breakout height.
50% retracement level of the breakout move is highlighted — a critical area for potential price reaction.
Price is currently pulling back after a recent high near $120,400, trading around $119,059, nearing the breakout support zone.
This setup suggests a possible bullish retest scenario if support holds near the 50% level
thanking you

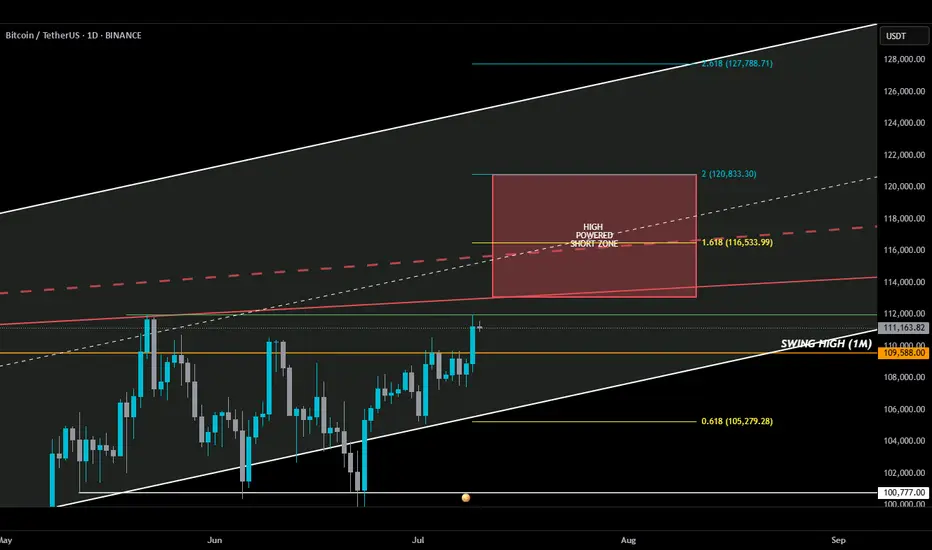
HIGH POWERED SHORT ZONE 2.0HIGH POWERED SHORT ZONE ⚡️
Usually, a 3% move doesn’t make anyone blink—but this one? It sent BTC into all-time high territory. I almost popped the champagne… until I remembered I’m in a short.
Not because I don’t believe in upside—but because my add zone in the HIGH POWERED SHORT ZONE hasn’t been tagged. Yet.
Here’s the breakdown 🧵👇
________________________________________
Before anyone goes bUCK wilD and cracks open that dusty bottle of Veuve, double-check something:
📅 The July 10th daily candle needs to close above the monthly swing high (orange line).
If BTC bulls lock that in, then a move deeper into the HIGH POWERED SHORT ZONE becomes real...
play-the-game real…
________________________________________
Where’s this HIGH POWERED SHORT ZONE coming from?
🔻 Solid red line – a trendline from Dec 2024 that has held strong through three separate tests — marking it as a key line on the sand.
🔻 Dashed red line – goes all the way back to Dec 2017. A seasoned veteran of resistance.
I also drew in a white ascending channel—not just for looks. If BTC breaks out, this channel will help us ask:
“How high is too high?”
________________________________________
Now enters Fibonacci — where nature maps out key alignments on the chart. 🌱
🟡 Gold lines = Fib golden ratios
🔵 Teal lines = Fib Degen Ratios
It’s wild how they just line up:
• 2.618? Right on the top of the channel.
• 1.618? Sitting on the 2017 trendline.
• 0.618? Near current support + bottom of the channel.
Also had to draw that horizontal support white line to keep an eye on.
A Bounce or bust? Ask the bUCKmOON!
My thoughts on Bitcoin.. ABC -> 129K Top?I think we correct down to 112K area to fill the FVG and CME then we Turn up, topping at 129K and then the rest of the Alts blow off top from there..
Thoughts?

BTC - A POSSIBLE SCENARIO (MARCH 2025)BTC - A POSSIBLE SCENARIO (MARCH 2025)
BTC is still showing weakness. Overall, I remain bullish, but it may dip to $68K–$73K.
Alts are a real bargain now in March 2025. They won’t stay like this forever—soon, they’ll surprise everyone. But obviously they are extremely risky assets.

This time it's not different. Still The same macro structure. This time it's not different. we are in the last phase of the bull market cycle.
Bitcoin Wave Analysis – 22 July 2025
- Bitcoin reversed from support level 116065.00
- Likely to rise to resistance level 122775.00
Bitcoin cryptocurrency recently reversed up from the key support level 116065.00, which also stopped the earlier minor correction 2 at the start of June.
The support level 116065.00 was further strengthened by the support trendline of the daily up channel from June and the 38.2% Fibonacci correction of the upward impulse from July.
Given the strong daily uptrend, Bitcoin cryptocurrency can be expected to rise further to the next resistance level 122775.00 (which stopped the previous impulse wave 1).

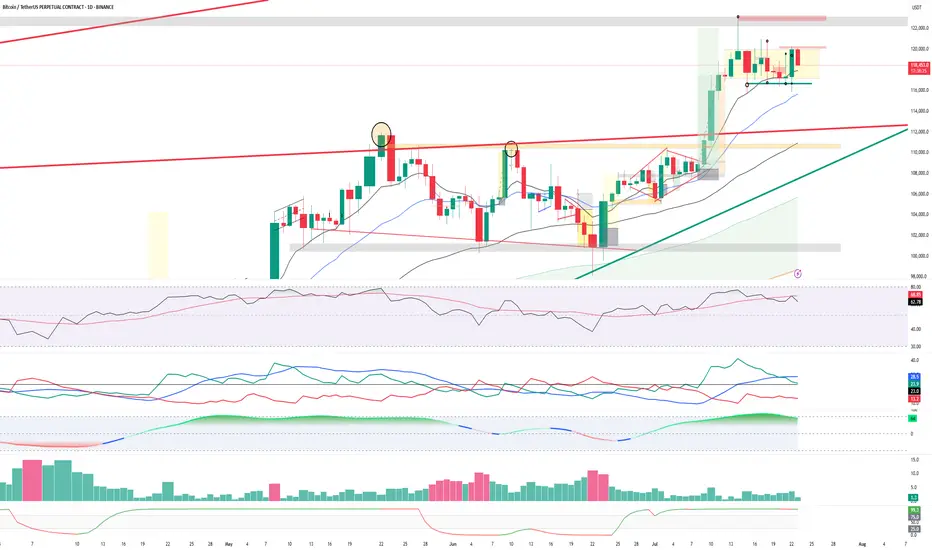
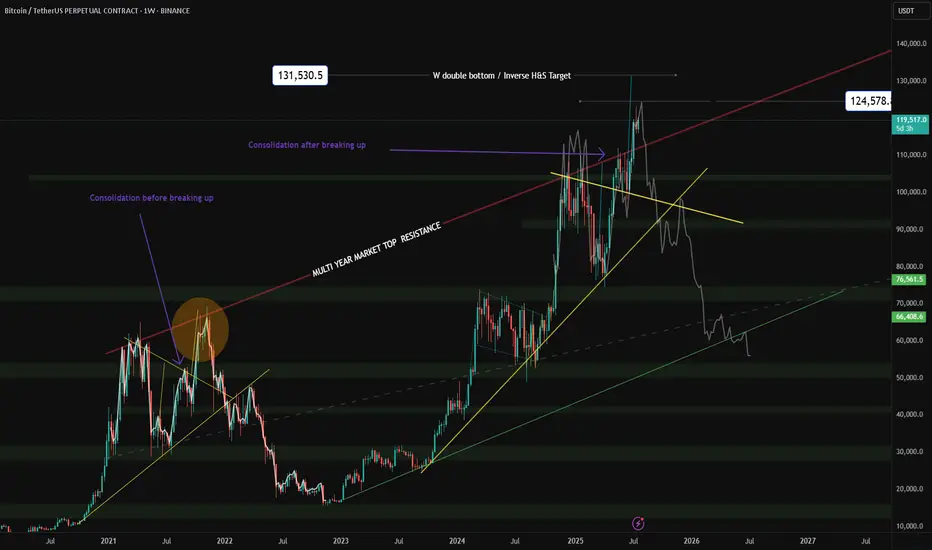
$BTC Macro UpdateBitcoin Macro Outlook BINANCE:BTCUSDT.P
Weekly
Bias & momentum remain bullish. Price is pressing toward new ATHs despite last week’s pullback.
Next macro target: ~$133,550 (extension of the current DeCode V-Range: 111,959.5 – 77,111.0).
A weekly close back inside that range (<111,968.0) = Failed Auction → serious red flag for reversal.
Daily
Clean rejection off the 21-Day Rolling VWAP + bounce at the structural HL V-Level (116,862.4).
A strong bullish engulfing today would set the tone for follow-through this week.
10-Hour
Structure is still bullish. Multiple Failed Auctions from ~116,960.0 are driving price toward the ATH.
Intraday
Choppy and hugging range lows → harder read. That behavior near balance edges triggers AMT Rule #5: “If time/volume builds at the edge of balance, price is likely to push through.”
Auction Market Theory – Quick Reminders
Price : advertises opportunity
Time : regulates opportunity
Volume : tells you if the auction is succeeding or failing
Rule #5 (above) is in play right now. Stay patient, wait for confirmation, and don’t FOMO.

"BTCUSDT Bearish Reversal: FVG Breakout & Sell Target Zone AnalyThis BTCUSDT 1D chart highlights a Bearish Market Structure, showing a Break of Structure (BOS) followed by a Fair Value Gap (FVG) and Breakout. A Support Level within the Demand Zone was tested, and the price is projected to fall toward the Sell Target Zone near 99,581 USDT.

targetRemember, day trading is risky and most traders lose money. You should never trade with money you can’t afford to lose. Prove profitability in a simulator before trading with real money.
❗❗My results are not typical. We do not track the typical results of past or current customers. As a provider of trading tools and educational courses, we do not have access to the personal trading accounts or brokerage statements of our customers. As a result, we have no reason to believe our customers perform better or
