TradeCityPro | Bitcoin Daily Analysis #142👋 Welcome to TradeCity Pro!
Let's get into the Bitcoin analysis. Yesterday, Bitcoin continued its correction and we need to see what is going to happen in the market today.
📅 Daily Timeframe
First, let’s take a look at the higher timeframe. On the daily chart, that curved upward trendline we had was broken by yesterday's candle, and the breakout candle had high volume.
✔️ For now, I don’t consider this trendline as broken and I’m waiting to get confirmation of the break.
🔍 Currently, the price is in a correction phase, and this correction is quite natural since the price had very low volatility for a long time and was stuck below the 120000 zone.
💥 But no trend reversal has occurred yet. In my opinion, as long as the price is above the 110000 zone, the trend is bullish, and I will consider the trend reversal confirmed only if a lower high and a lower low below 110000 are formed.
⏳ 4-Hour Timeframe
Yesterday, the corrective movement of the price continued, and after a pause at the 0.5 Fibonacci level, another bearish leg formed down to the 0.618 zone.
🔔 The RSI oscillator also entered the oversold area and then exited it again. I believe there’s a high possibility that until the end of the week, Bitcoin will range in these areas and the probability of a bullish or bearish move is much lower.
🔽 However, if the 0.618 Fibonacci level breaks, the price can move to lower areas like the 111000 zone. I think the likelihood of this happening in the future is high because that zone is a strong PRZ, and at the same time, it counts as a pullback to the 110000 zone.
📈 In the bullish scenario, if the price is supported from this area and starts to move upward, since we currently have no highs below the 116000 zone, we need to wait until the first bullish leg is formed and then enter on the second leg after the new high is broken.
⚡️ For now, I’m not opening any short or long positions. I prefer the price to form more structure so I can make a more comfortable decision.
❌ Disclaimer ❌
Trading futures is highly risky and dangerous. If you're not an expert, these triggers may not be suitable for you. You should first learn risk and capital management. You can also use the educational content from this channel.
Finally, these triggers reflect my personal opinions on price action, and the market may move completely against this analysis. So, do your own research before opening any position.
USTBTC trade ideas

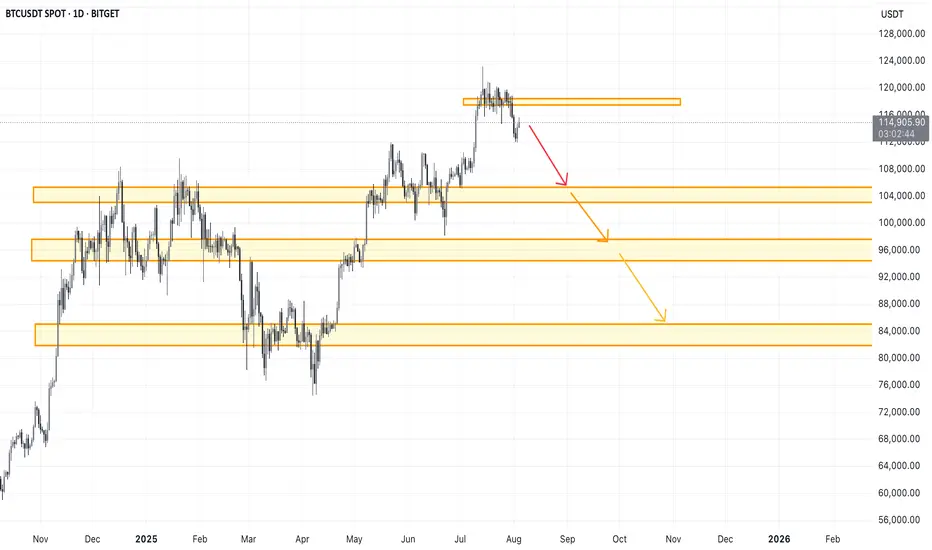
BTCUSDT local correction is expectedExpecting local correction on BTC, as the price didn't manage to fix above 118500. Main target is around 103-105. In case of the deeper correction - next targets are mentioned on chart.
Invalidation will occur when price will fix above 118500 at least with one full candle.
$BTC 1HR TA CRYPTOCAP:BTC Survived the pressures of war and tariffs and bounced well off the 112 zone. The market proved the bulls still have control.
But It's Friday and we know the markets tend to get pull back and get choppy... I'm expecting CRYPTOCAP:BTC to pull back some.
BTC 1H Analysis – Key Triggers Ahead | Day 4💀 Hey , how's it going ? Come over here — Satoshi got something for you !
⏰ We’re analyzing BTC on the 1-hour timeframe .
👀 After triggering our long entry levels , Bitcoin faced increased buying volume , and the U.S . unemployment claims came in higher than expected, which was interpreted positively for the crypto market .
🔼 With rising buying volume, Bitcoin may continue moving toward higher levels and could even aim for a new local high. Our key support zones are the same trigger levels we've been watching—these are also our ideal long entry points .
⚡️ There is a strong resistance around $117,000, where taker sellers are actively selling their Bitcoin at premium prices. In order to break through this area, we’ll need solid volume inflow from both market makers and retail buyers .
⚙️ There’s no clear RSI support zone at the moment, since on the 1-hour chart RSI is already in the Overbought area and oscillating there .
📈 Long position : Be a bit patient here . Wait for Bitcoin to pull back to key Fibonacci levels , preferably around 0.236 and 0.382, and then bounce back up . Once we break above the pullback, you can consider entering a long trade .
📉 Short position : A short setup could form only if both of our marked trigger levels get stop -hunted, combined with increased selling pressure , support breakouts , and confirmation from bearish candlestick patterns.
That said — we are not looking to short right now, as there are better opportunities to catch strong long entries .
❤️ Disclaimer : This analysis is purely based on my personal opinion and I only trade if the stated triggers are activated .
Lingrid | BTCUSD Consolidation PHASE ContinuesBINANCE:BTCUSDT is bouncing from the confluence of an upward trendline and the $112,175 support level, forming a higher low structure. Price remains within an upward channel, with the current pullback holding above key structural support. As long as the higher low remains intact and price stays above $112,175, a continuation toward $120,500 is likely. Momentum appears to be rebuilding within the bullish framework after a period of consolidation.
📉 Key Levels
Buy trigger: Break and hold above $114,680
Buy zone: $111,500 – $112,500
Target: $120,500
Invalidation: Break below $111,000
💡 Risks
Failure to hold the trendline could trigger deeper downside
Resistance at $114,680 may reject early attempts to move higher
Market may stay range-bound if volume remains low
If this idea resonates with you or you have your own opinion, traders, hit the comments. I’m excited to read your thoughts!

TradeCityPro | Bitcoin Daily Analysis #141👋 Welcome to TradeCity Pro!
Let’s dive into Bitcoin analysis. Yesterday, the exact bearish scenario I told you about happened. Let’s see what opportunities the market is offering us today.
⏳ 4-Hour Timeframe
Yesterday, I mentioned that the price had tested the 116829 zone too many times and that this area had become very weak. I also said that if the price made a lower high than 120041, deeper corrections would be likely.
✔️ Another perspective I have on the market is that sometimes certain support and resistance levels simply aren’t strong enough to continue the trend.
🔑 For example, in this case — despite Bitcoin being in an uptrend across all cycles — the 116829 support couldn’t hold, and the price broke it to reach a stronger support zone, one that might be capable of continuing the trend.
📊 Right now, this is what might be happening again. Support levels like 0.5, 0.618, and 0.786 Fibonacci retracement zones could be where the next bullish leg begins.
✅ At the moment, price has reached the 0.5 Fibonacci level, and the previous strong bearish momentum has slightly weakened. If you look at the volume, momentum is still in favor of sellers, but based on the long lower wicks on the candles, we can say the bearish trend is showing signs of weakness.
💥 On the other hand, RSI is approaching 30, and in an uptrend, when RSI nears the Oversold zone, it can often be a good entry point for a long. However, we’re not acting on this yet — we’ll wait for more confirmations before opening any positions.
⭐ For now, there’s no trigger for a long position on this timeframe. A break below 115000 could act as a short trigger, but given the trend Bitcoin is in, I’m not opening any short positions at the moment.
⏳ 1-Hour Timeframe
The price has dropped down to 114560, and I believe today we might enter a corrective phase. However, if the price stabilizes below 114560, the correction could continue. The next targets would be the Fibonacci levels from the 4-hour timeframe.
🔽 I won’t open a short position with the break of 114560, and I suggest you don’t take that short either.
📈 If this move turns out to be a fakeout, the first trigger we have now is at 118736, which is quite far from the current price. For this trigger to activate, we’d need to see a V-pattern form.
🔍 There are no other triggers right now. But if more range structure forms, we might consider opening a risky long on the breakout of the range top.
❌ Disclaimer ❌
Trading futures is highly risky and dangerous. If you're not an expert, these triggers may not be suitable for you. You should first learn risk and capital management. You can also use the educational content from this channel.
Finally, these triggers reflect my personal opinions on price action, and the market may move completely against this analysis. So, do your own research before opening any position.

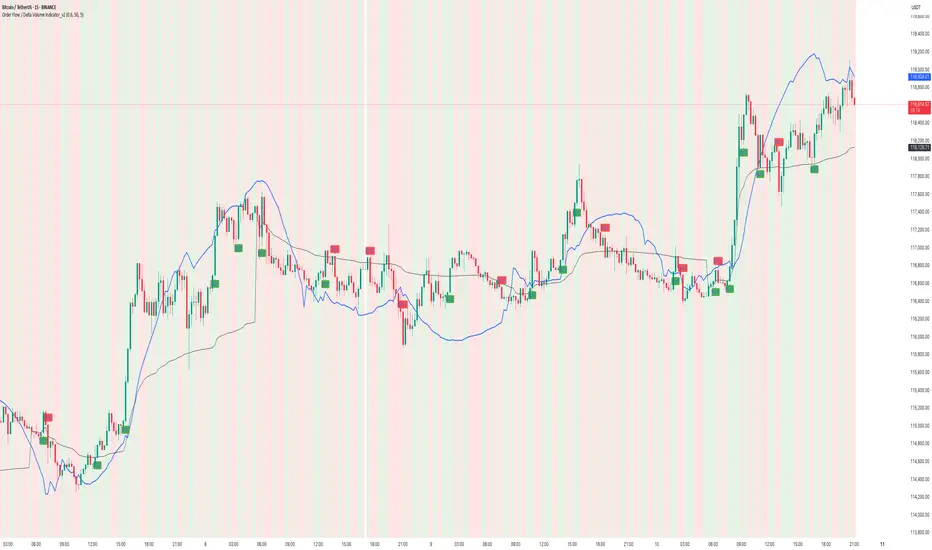
How to use Order Flow / Delta Volume Indicator for IntradayWhat you’re seeing
This idea visualizes an intraday session with my Order Flow / Delta Volume study applied. The chart overlays three things that matter for short-term context:
• Cumulative delta (blue line) : running sum of delta, rescaled so it’s easy to compare to price swings.
• VWAP (grey line) : session anchor for bias and mean-reversion context.
Signal logic (kept simple & rule-based)
A bar is considered imbalanced when one side’s volume dominates the bar’s total volume.
• Imbalance: upVol / totalVol > 0.60 → buy-side imbalance; downVol / totalVol > 0.60 → sell-side imbalance.
• Trend/strength filters (optional but enabled here):
• VWAP filter → longs only when price > VWAP; shorts only when price < VWAP.
• RSI(14) filter → longs only if RSI > 50; shorts only if RSI < 50.
• Noise throttle: minimum 5 bars between signals + price must exceed the prior close by ±ATR(14) to avoid tiny wiggles.
These rules try to capture moments when flow (delta) and context (VWAP/RSI) line up, while the ATR and cooldown help skip low-quality, back-to-back prints.
How to read the chart
• Rising blue cumulative-delta with price above VWAP → constructive backdrop for longs; fading/ranging delta warns to de-risk or wait.
• Green “ BUY ” labels plot when a buy-side imbalance clears the filters; red “ SELL ” labels mark sell-side imbalances with bearish context.
• Background tints briefly highlight where the raw imbalance occurred (light green/red), even when a trade filter blocks a signal.
Walk-through of the attached example
• Trend leg after a base: cumulative delta turns up first and price reclaims VWAP → several filtered BUY signals print into the push; ATR gate avoids chasing the very first small upticks.
• Mid-session chop: delta flips around the zero line and price hovers near VWAP → far fewer signals; most imbalances are filtered out by RSI/VWAP or fail the ATR move requirement.
• Late expansion: a swift VWAP reclaim with strong positive delta → clustered BUY signals that track the follow-through, while opposing sell imbalances near VWAP are rejected by filters.
Inputs used on this chart
• Imbalance threshold: 0.60
• VWAP filter: On
• RSI filter: On, threshold 50
• Cooldown: 5 bars
• ATR length: 14
Notes
• This is not a trade recommendation. Signals highlight where participation leans, not certainty of direction.
• Best paired with your execution plan (risk unit, stop location, partials near prior S/R or VWAP).
• In fast spikes, delta can be extreme—ATR and the cooldown help, but slippage and whipsaws are always possible.
• For instruments with very low volume or during illiquid hours, consider raising the imbalance threshold or disabling signals altogether.
Takeaway
Order-flow imbalance by itself fires often; layering VWAP, RSI, and an ATR-based movement check concentrates signals to moments when both flow and context align. The attached session shows that behavior clearly: fewer prints in chop, more conviction when cumulative delta trends and price holds its side of VWAP.
Educational post for discussion only. No financial advice.
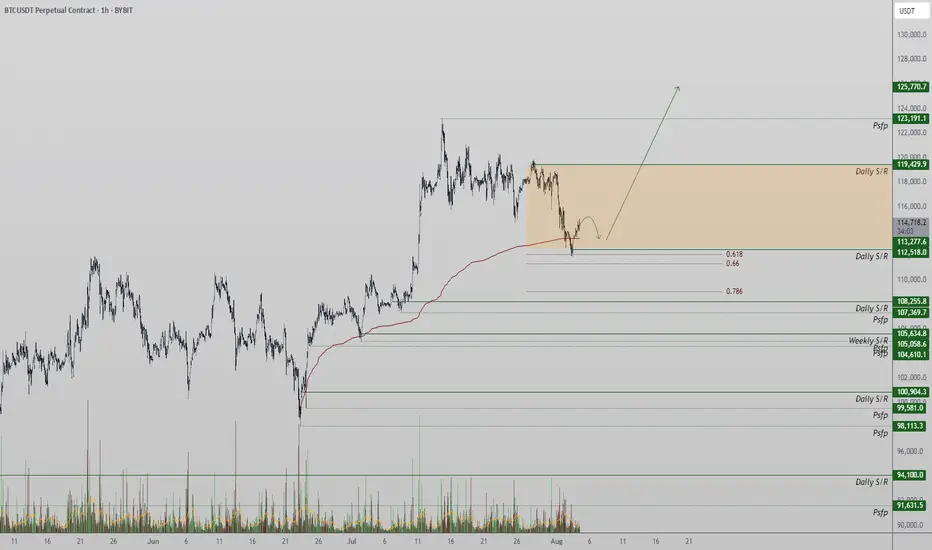
Bitcoin Price Action: Key Support & Resistance Levels to WatchKey levels are marked on the chart. These are all validated by at least three touches.
The pale blue line, that seemingly comes from out of nowhere, is the most significant one because it is the longest running. The ATH trendline for Bitcoin. The choppiness around this level is to be expected. If Bitcoin can gain the fuel to power above here, it'll almost certainly go parabolic.
Bulls need the bottom of the orange box at $116k to hold to maintain control.

Skeptic's Night Byte: How to Catch Altcoin MovesHey, welcome to the first episode of the Skeptic's Night Byte
In this quick lesson, we’ll dive into how to spot when liquidity moves from Bitcoin into altcoins .
Each video is about 60 seconds, giving you fast, no-fluff insights to help improve your trading game :)
If you find this useful, give it a boost and share it with your trading circle.
Let’s get started!

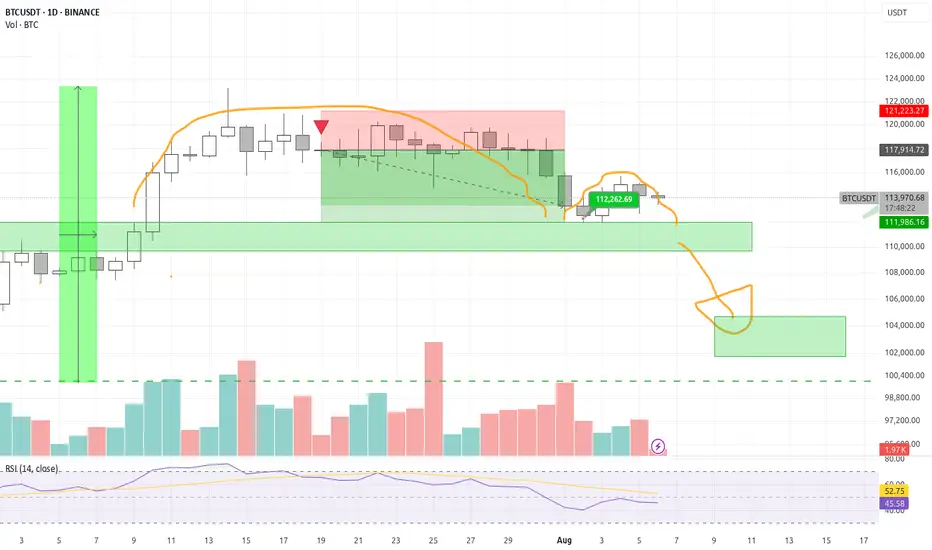
Bitcoin Tests Major Support at $112,500Bitcoin is currently in a local downtrend, with price now testing a major support zone around $112,500. This level, backed by multiple technical confluences, may serve as the base for a potential reversal if defended on lower timeframes.
Price action has been drifting lower over the past sessions, finding its way into a key support zone defined by the 0.618 Fibonacci retracement, the blue upward trendline, and prior structure. The $112,500 region now acts as the immediate level to hold from an intraday perspective. If bulls are able to defend this zone and volume confirms participation, the probability of a rotation higher toward $123,000 increases significantly.
Key Technical Points:
- Support at $112,500: Aligned with 0.618 Fibonacci, trendline support, and structural pivot
- Intraday Confirmation Required: Holding this level on lower timeframes improves the
probability of reversal
= $123,000 Target in Sight: Technical target for rotation if a bottoming structure forms and holds
From a short-term perspective, Bitcoin has clearly shifted into a local downtrend, creating a sequence of lower highs and lower lows. However, the current area around $112,500 presents a strong confluence of support that could interrupt this trend. This zone includes the 0.618 Fibonacci retracement from the most recent swing move, a respected upward trendline (blue), and a previous structural pivot. Together, these elements increase the probability of a bounce—provided price can stabilize.
At this stage, price may still trade sideways and consolidate within this region to form a bottoming structure before any meaningful move higher. For traders, this means confirmation is key. Watching for multiple intraday candle closes above the support zone, paired with an increase in bullish volume, would suggest that demand is building. Only then would the setup favor an entry targeting the local highs.
The upside technical target from this area remains at $123,000, representing the recent swing high and a clear resistance level. A reclaim and rotation to this level would validate the support zone and reintroduce the bullish bias in the short term. Until that occurs, however, price could continue to consolidate, especially if volume remains low or indecisive.
The overall structure still leans constructive, as long as $112,500 holds. A breakdown below this level would weaken the short-term setup and potentially open the door to deeper downside probing. But for now, the region remains a high-probability bounce zone on lower timeframes.
What to Expect in the Coming Price Action
Bitcoin is testing critical intraday support at $112,500. If this level holds with volume confirmation and intraday structure aligns, a rotation toward $123,000 is likely. However, price may continue consolidating at this level before a clear direction forms.
BTC - 1H Elliott Wave Analysis - 11.08.25Welcome back to our updated Elliott Wave Count for Bitcoin.
Apologizes for not publishing an update yesterday, I caught a cold over the weekend so I wasn't in a good position to do a proper analysis :( We try to post a daily BTC update and occasionally EW counts for other coins too :) Going to try to keep that style up but no promises got to see how it works out.
We have seen a strong move up from our support area as we expected.
Today we got another count on the charts which doesn't mean that the other count (diagonal) we have been discussing throughout the last week is invalid. More on that later this analysis.
In this count we assume that the move up isn't a diagonal but rather multiple 1-2 set ups.
This count allows us to go higher more directly with a strong Wave 3. We got three 1-2's, a green one, a blue and a white one on the chart. We assume that the recent aggressive push was the white Wave 3 and we're now seeing a pullback in white Wave 4 which will be followed by the white Wave 5 which finishes the blue Wave 3 etc.
The support area for the white Wave 4 is between the 0.236 FIB at 120'892 USD and the 0.5 FIB at 119'150 USD. Preferably we would see a bounce from here now in this count as we have already entered it and tested the 0.5 FIB of the support area which Bitcoin seems likes to be doing recently. In case we go lower it could be that the white five move is already done but we'll see how it develops. The blue Wave 4 support area would be around 118'000 USD to 120'500 USD.
As above mentioned this doesn't invalidate the diagonal count. It is hard to distinguish between multiple 1-2's and a diagonal. We lean towards the multiple 1-2's count because the last move up was impulsive and aggressive. If you connect the Wave 1 and 3 high you get a trendline which can be overshot by the 5th Wave in a diagonal in a such called "throw-over" which usually comes with high volume which we indeed had here. The issue is we are looking for a leading diagonal and this throw-overs are more common in ending diagonals which is the main reason for the switch of the counts. :) Hope it makes it more transparent and understandable!
I just want to make aware that with this counts we got multiple support areas which are close to each other or even overlap. Essentially the whole price range of 114'000 USD to 121'000 is important, preferably we still want to bounce from the mentioned support area above but what we want to make aware of is that a break of it doesn't turn the count bearish. Just keep that in mind when trading on smaller timeframes :)
We would appreciate a follow and boost if you like the analysis! :)
Thanks for reading.
NO FINANCIAL ADVICE.

BTC - 1H Elliott Wave Analysis - 06.08.25Welcome to our Elliott Wave Count for Bitcoin!
We have seen a decent reaction to the upside from our Wave 2 support area.
We did remove the bearish red Wave count even if it hasn't been strictly invalided yet but we think it keeps the chart cleaner. Additionally if we take the recent high at 115'686 USD we would have an overlap of red Wave 2 and 4 which would decrease the probabilities of the bearish count.
It appears that we held the Wave 2 support and got a decent reaction to the upside.
At the moment we are continue to see the price surge to the upside.
We did add some Elliott Wave counts displayed each in 5 Waves in turquoise, white and green to help keep track of the price development.
Additionally we added a provisional support area for Wave 4 of the white count.
It sits between the 0.5 FIB at 114'469 USD and the 0.236 FIB at 115'083 USD with the invalidation at the 0.618 FIB at 114'194 USD.
Be aware that the support area moves with the price surging.
Preferable we stay above that support area.
Thanks for reading.
We would appreciate a follow and boost if you like the analysis! :)
NO FINANCIAL ADVICE.

[SeoVereign] BITCOIN BEARISH Outlook – August 12, 2025Today, I will introduce my short position outlook for Bitcoin on August 12.
There are two grounds for this idea.
First, an arbitrary wave X forms a 0.382 length ratio with another arbitrary wave.
In general, the 5th wave often has a length ratio of 0.382 compared to the 1st wave.
In this case as well, it can be counted in the same way.
Second, as a result of applying the Fibonacci in reverse to the wave that appears to be in a diagonal form,
the point where the ratio of 2 is formed almost exactly matched the recent high of around 112,360.
I often use this kind of “reverse Fibonacci.”
Normally, Fibonacci is drawn with the past point as the first point and the future point as the second point,
but I do the opposite — setting the future point as the first point and the past point as the second point.
In this case, ratios such as 1.618 / 2 / 2.24 / 2.618 / 3 / 3.618 are often used.
It is especially effective for measuring ratios between wave pairs that skip one wave,
such as between wave A and wave C, or between wave 3 and wave 1.
thank you.

08/10-10/12/25 BTC SHORT Right now will retrace however, it wont' present us with large enough move to profit from. but will soon sweep the highs listed below.
Preferred: Short BTC in $118,950–$119,200 zone after rejection.
Trigger: Wick into zone + aggressive sell reaction (fast candle back under $118,900).
Stop-loss: Above $119,300.
TPs:
TP1: $118,500
TP2: $118,300
TP3: $118,050

BTC 08/09-08/11 Levels To PlayPlay them after confirmation as many times as they are met you can enter them. They are NOT in any sequential order. Horizontal lines for easy reading. This is valid until BTC breaks below or above and those breakout levels are listed too.
LONG #1 (breakout): Break and hold above 119,500, buy the pullback 119,400–119,600 → targets 121,900 → 122–123k. Invalidate on loss of 119,000.
LONG #2 (sweep-reclaim scalp): Sweep 116,200–116,400, reclaim and hold above ~117,000 → 117,900–118,100. Invalidate on loss of the reclaim (~116,800).
SHORT #1 (rejection): Fail/sweep at 119,300–119,800 and close back inside → 118,900 → 118,000 → 117,500. Invalidate on H1 close > 119,800.
SHORT #2 (intraday fade): Reject 117,200–117,400 → 116,600 → 116,200. Invalidate on push/hold > 117,500.

Bitcoin testing 116k zoneIf we are successful in breaking above the 116k zone resistance. Bitcoin will pump hard to 120k and 123k next. As the high time frame trend continues to stay uptrend. Let's see if bitcoin breaks it now or has some other plans.
Stay tuned!

BITCOINTHE daily structure of the bitcoin shows a break out of the daily ascending trendline ,but on 4hrs we are protected by 4hr ascending trendline line ,the daily sr/rs level holds superior opinion of price action than any intraday time frame .so trade with care and know that any key level on 4r/3r can fail while contesting with daily TF and weekly structure.
#bitcoin #btc
Weekly trading plan for BitcoinBINANCE:BTCUSDT has shown strong growth since last week; the main task now is to print a new ATH. The price will likely test the 126K–130K zone we marked a couple of weeks ago, with a final monthly target at 132K .
We’re seeing some pressure and a pullback, but as long as the trendline holds, there’s a real chance to see a new ATH today/tomorrow . If the trendline breaks, I’ll look for a reversal from the moving averages or after a test of the weekly pivot.
If 115K breaks, I’ll expect further downside toward 110K .
More details are in the idea video.

BITCOIN THE daily structure of the bitcoin shows a break out of the daily ascending trendline ,but on 4hrs we are protected by 4hr ascending trendline line ,the daily sr/rs level holds superior opinion of price action than any intraday timie frame .so trade with care and know that any key level on 4r/3r can fail while contesting with daily TF and weekly structure.
#bitcoin #btc

"Bitcoin’s Big Heist – Are You In or Out?"🚨 BTC/USDT HEIST MISSION – SWIPE THE BULL RUN BEFORE THE BEARS WAKE UP 💰💣
🌟Hi! Hola! Ola! Bonjour! Hallo! Marhaba!🌟
Money Makers & Robbers, assemble! 🤑💰✈️💸
Here’s your decoded BTC/USDT “Bitcoin vs Tether” Crypto Market Heist Plan, fully loaded with Thief Trading Style 🔥 TA + FA combo. We’re prepping for a bullish breakout loot – eyes on the vault, ignore the noise.
🎯 PLAN OF ATTACK:
🎯 ENTRY (BUY ZONE):
💥 “The vault’s open—time to sweep!”
DCA/Layer your buy limit orders near the 15–30 min swing lows/highs for sniper pullback entries.
Use multi-entry method to stack positions (layering / DCA) as per your ammo (capital 💵).
🛑 STOP LOSS:
Set SL at the nearest swing low wick (4H TF) — around 115000.00, adjust based on your risk/load.
SL = insurance. Not optional.
🏁 TARGET:
Lock sights on 125000.00
🎉 Or… vanish with profits before the bear cops arrive.
🔎 MARKET BACKDROP & ANALYSIS:
📈 BTC/USDT currently signals bullish vibes on the swing/day horizon — fueled by:
Macro Fuel & Fundamentals
Sentiment Radar
COT Reports
On-Chain Pulse
Intermarket Clues
🚀 Connect the dots. The smart money's already prepping a breakout move.
🧲 Scalpers Note:
Stick to the long side only. No shorting the beast — unless you’re made of diamonds.
Secure your bag with trailing SLs.
⚠️ NEWS TRIGGER ZONE – TRADE WITH TACT:
📢 Upcoming high-volatility news events can spike charts.
Avoid new entries during releases and guard open trades with trailing SLs.
Protect the loot. Always.
💖 SUPPORT THE HEIST GANG: BOOST IT!
Smash that ❤️ to boost our thief squad’s momentum!
Every click powers this underground mission – making money with style, one pip at a time. 🎯💣💵
🚀 See you in the next heist drop.
Until then – Stay stealthy. Stay profitable. Stay legendary. 🐱👤💸🏆

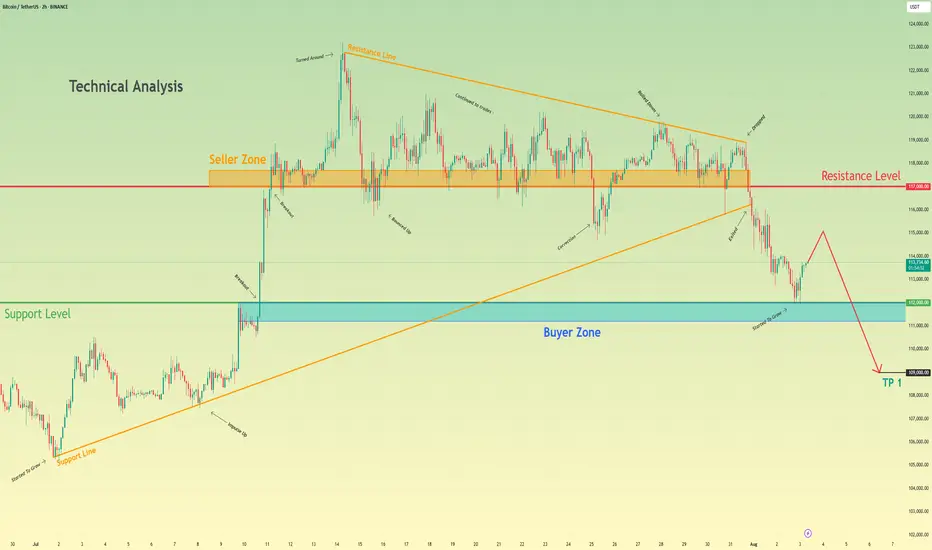
Bitcoin can continue to decline and break support levelHello traders, I want share with you my opinion about Bitcoin. Following an earlier upward trend, bitcoin entered a prolonged phase of consolidation, forming a large upward pennant where price action was tightly contested between the seller zone near 117000 and an ascending support line. This period of balance, however, has recently resolved to the downside with a significant change in market structure. A decisive breakdown has occurred, with the price breaking below the pennant's long-standing support line, signaling that sellers have ultimately gained control. Currently, after the initial drop, the asset is undergoing a minor upward correction, which appears to be a classic retest of the broken structure from below. The primary working hypothesis is a brief scenario that anticipates this corrective rally will fail upon encountering resistance from the broken trendline. A confirmed rejection from this area would validate the bearish breakdown and likely initiate the next major impulsive leg downwards. The first objective for this move is the buyer zone around the 112000 support level, but given the significance of the pattern breakdown, a continuation of the fall is expected. Therefore, the ultimate target price for this scenario is placed at the 109,000 level, representing a logical measured move target following the resolution of the large consolidation pattern. Please share this idea with your friends and click Boost 🚀
Disclaimer: As part of ThinkMarkets’ Influencer Program, I am sponsored to share and publish their charts in my analysis.
btcHello
My opinion is that the market trend is bearish.
We are currently in a compression pattern, and if we can break this pattern to the downside and establish a strong candlestick below the price of 115,700, the bearish scenario will be activated.
