USUALUSDT 8H#USUAL has formed a Cup and Handle pattern on the 8H timeframe. It is currently facing the Handle resistance and the SMA200. In case of a breakout above these levels, the short-term targets are:
🎯 $0.1031
🎯 $0.1167
If the price then breaks above the Neckline, which serves as the main resistance zone, the mid-term targets are:
🎯 $0.1302
🎯 $0.1494
🎯 $0.1739
⚠️ As always, use a tight stop-loss and apply proper risk management.
USUALUSDT trade ideas

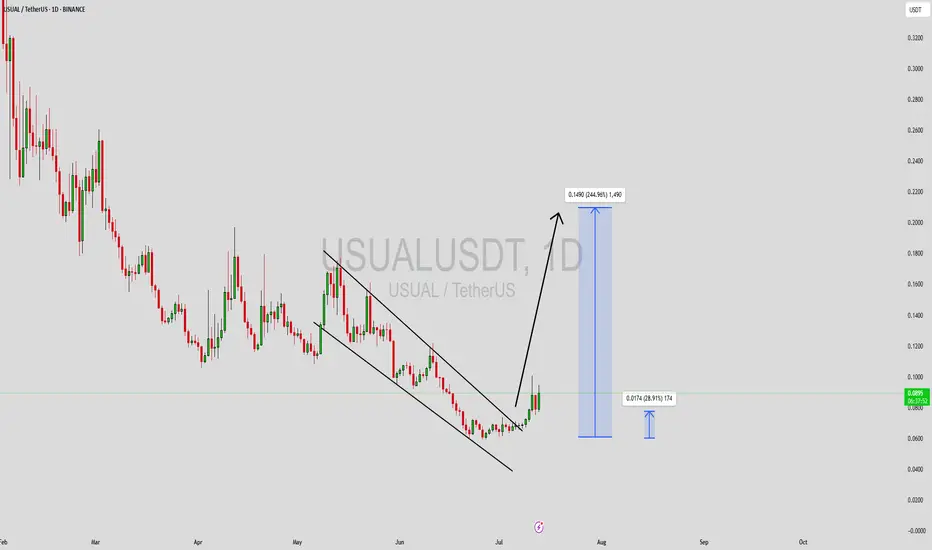
Usual 1,122% Target Mapped · Can Go Higher Late 2025Usual grew 700% in one month, between November and December 2024. Then the market went on to produce a major lower low bottom and now everything is changing. I am sharing this one again because I believe it will produce a massive bullish wave.
Good evening my fellow Cryptocurrency trader, how are you feeing in this wonderful day?
A new week starts and with the new week we will have a new set of top performers. Remember that a rising tide lifts all boats. It is not only one project but the majority of the altcoins that are set to grow. It is a long drawn out process, do not be distracted by the illusion of easy or fast gains. If you can hold and do so strong, patiently, you can end up with big gains. The big wins accumulate after months. Buy the bottom, 7-April, 22-June and hold. Comeback in 2-3 months and see how the market is doing. Sell those trading high, buy those trading low.
USUALUSDT is now trading above EMA55 and EMA34. A strong candle and high volume came up to break each of these resistance levels. The same levels that rejected growth many times in the past three months.
In April, USUALUSDT tried to turn bullish but was rejected by EMA55 and EMA34. This same dynamic repeated once more in late April and then twice in May. When the market fails to conquer a resistance zone it tens to move lower looking for strength. That did it. After a major low and rounded bottom, we are now on the bullish zone.
USUALUSDT can easily grow 500% to 800% in the coming months. Without hitting a new all-time high, we have 1,122% potential for growth. From a previous chart, the 1,122% target gives us 1,950%. This is huge growth and it is possible that a new all-time high will be hit later during the bull run phase.
This is a friendly reminder. Opportunities are endless in this market.
Thank you for reading.
Namaste.

USUALUSDT Forming Falling WedgeUSUALUSDT is starting to capture the attention of crypto traders as it forms a well-defined falling wedge pattern on the charts — a classic signal for a potential bullish reversal. This technical setup is often sought after because it combines a declining trend with contracting price action, suggesting that selling pressure is losing steam and that a significant breakout could be on the horizon. The volume profile for USUALUSDT is also showing healthy signs, with increasing accumulation, reinforcing the case for a strong move upwards once the wedge’s resistance is broken.
A falling wedge breakout is a powerful indicator that buyers are regaining control and that the market sentiment is shifting. For USUALUSDT, the projected gain of 220% to 230% makes this an incredibly attractive play for traders who look for high-risk, high-reward setups. This type of pattern, when combined with a supportive volume surge, can deliver rapid and sustained price action, especially in the volatile crypto markets where sentiment can flip quickly.
Beyond the technicals, investors are increasingly taking interest in the USUAL project’s fundamentals and future potential. The team’s consistent development progress and growing community support are creating a solid foundation for long-term growth. As the market eyes this pair, a confirmed breakout from the wedge could attract even more traders and institutional investors seeking to capitalize on its upside potential.
✅ Show your support by hitting the like button and
✅ Leaving a comment below! (What is You opinion about this Coin)
Your feedback and engagement keep me inspired to share more insightful market analysis with you!
USUAL/USDT +250%USUAL/USDT recently broke out on July 8 from a 55-day downtrend, signaling a potential trend reversal. After spending 15+ days consolidating and building strong support between the $0.06–$0.07 zone, bulls have regained control.
Trend reversal confirmed with breakout + base formation.

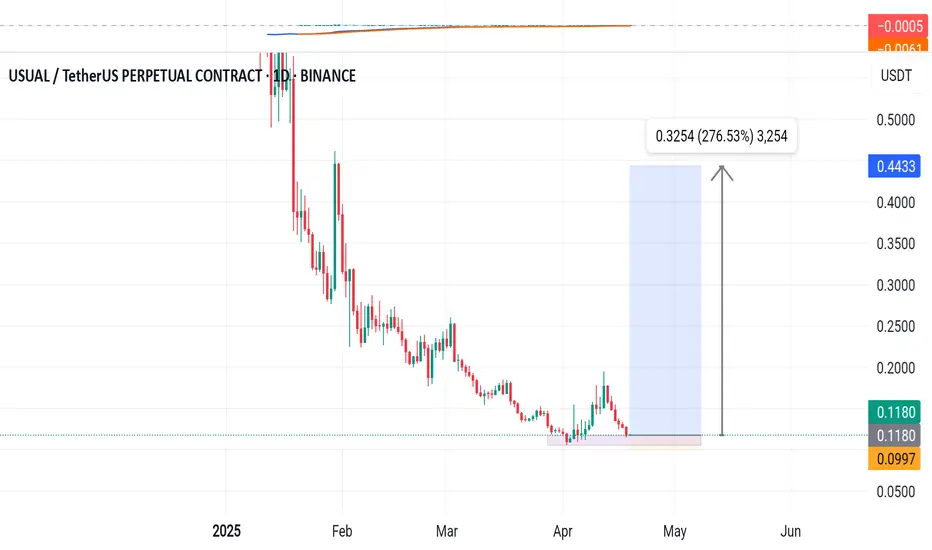
USUAL: Worst Case Scenario +950%; Strong Bull Market = 4,000%+First bull then bear then sideways with a slight downward bent. Notice how the candles are almost invisible now... This is the end of the current phase. When volume drops to a halt and the candles become almost invisible you can be certain that change is approaching this market. The pair in question is USUALUSDT—RWA.
The late 2024 bullish wave started from ~2000 sats and total growth reached ~700%.
Current price is ~650 sats and this opens the doors for 10, 20 or even 30X in the coming months. 20X is possible even without a new all-time high. I am adding this one to my list as it has huge growth potential and it is available on so many top exchanges.
The action went below 100%. This is good, we know there won't be any compulsion for prices to move lower. Once a bearish move goes beyond the low of the previous move, we are faced with a potential buy opportunity. That's what we have here.
There is basically no recovery in April, this is also good, it means the bulls have not used their ammunition while the bears must be running out. Many pairs produced a strong move in April and are recovering now in June.
The most interesting part is the easy target, it goes as high as 950%. Worst case scenario, we get 950% to 1,500% total growth within the next six months. If things go well, we will see a new all-time high with profits potential going off the chart. Beyond 4,000% is possible.
Thanks a lot for your support.
Namaste.

USUALUSDT.PLong setup for usual has been marked on the chart..
I will suggest the entry 2 for safer entry.
The entry 1 only if we see it makes a good support there.
DYOR

USUALUSDT Forming Falling WedgeUSUALUSDT is currently displaying a falling wedge pattern, a powerful bullish reversal signal in technical analysis. This formation typically precedes a breakout to the upside, particularly when accompanied by increasing volume, which is present here. The compression of price within the wedge signals diminishing selling pressure and a buildup of momentum, potentially setting the stage for a strong rally. The expected upside for this setup is projected between 90% to 100%+, making this an attractive opportunity for traders seeking mid to long-term gains.
Investor interest in the USUAL project is steadily growing, likely due to its unique positioning and use-case within the broader crypto and DeFi ecosystem. As awareness around smaller-cap tokens with strong fundamentals and appealing chart structures increases, USUAL is becoming a notable mention. This trend of renewed interest often acts as a catalyst, pushing price action significantly once technical confirmation is met.
The falling wedge is nearing its apex, indicating a possible breakout is imminent. Traders should closely monitor key resistance levels for a decisive breakout candle supported by high volume. Once this occurs, rapid movement toward key resistance zones and Fibonacci targets can be expected. Historically, similar setups on altcoins have yielded quick and sizable returns post-breakout.
With market sentiment improving and technical indicators aligning, USUALUSDT may be poised for a major bullish breakout. It’s a pair worth watching for traders who focus on breakout patterns, trend reversals, and volume-based confirmations.
✅ Show your support by hitting the like button and
✅ Leaving a comment below! (What is You opinion about this Coin)
Your feedback and engagement keep me inspired to share more insightful market analysis with you!


USUAL Looks Bullish (12H)A double bottom pattern has formed on the chart, leading to a breakout from the price channel.
A support zone has been established, and a bullish CH has appeared on the chart.
Considering the breakout and the bullish structure, we can set up a buy position on this coin.
Targets are marked on the chart, and reaching the third target is also possible.
The invalidation of this setup will occur if a daily candle closes below the invalidation level.
For risk management, please don't forget stop loss and capital management
When we reach the first target, save some profit and then change the stop to entry
Comment if you have any questions
Thank You

USUALUSDT 1D Analysis USUAL ~ 1D Analysis
#USUAL Buy gradually from here with a short term target of at least 15%+ from here. These are the early signs when whales start to accumulate.

$USUAL - Triple Bottom Scalp Long$USUAL | 4h
**Weekend scalp long setup**
We're seeing a potential **triple bottom** forming on the local timeframe, indicating strong demand around this support zone. Price has tested this level three times without a breakdown, suggesting seller exhaustion.
If we hold above the most recent low, we can look for a long entry, targeting a bounce toward the nearest resistance or VWAP.
We can start scaling into longs at the current market price .11s, with a stop just below 0.105 or if you can extend it to .10
Targets:
.124 to .13
.137 to .142
.146 to .15

USUAL Idea - USUAL/TheterHey traders!
Sorry, no chart Analysis!
My suggestion is to enter above the $0.1530 price range
With targets:
1- $0.1650
2- $0.1790
3- $0.1900
There is a possibility of a price correction to the $0.1400 range
Good luck

USUAL is waking up - the beginning of a new bullish wave?This analysis is an update of the analysis you see in the "Related publications" section
We previously had accurate analyses of USUAL, correctly identifying the highs and lows.
Based on the type of custom order flow visible on the chart and recent candlestick formations, it seems that the buy orders in the lower green zone have been sufficient to trigger a trend reversal.
We’ve now identified a new zone. the upper green zone. as a rebuy area, where we’ll be looking for buy/long positions.
Targets are marked on the chart.
A daily candle closing below the upper green zone would invalidate this outlook.
For risk management, please don't forget stop loss and capital management
When we reach the first target, save some profit and then change the stop to entry
Comment if you have any questions
Thank You

USUAL ANALYSIS (8H)After wave A was completed, from the point where we placed the red arrow on the chart, it seems the price has entered wave B.
Wave B is a bearish symmetrical wave, and it currently appears that we are in the early stages of wave I, which is a bearish wave.
From the supply zone, we expect a rejection towards the Fibonacci levels of wave a to i, which corresponds to the green zone.
A daily candle closing above the invalidation level will invalidate this analysis.
For risk management, please don't forget stop loss and capital management
Comment if you have any questions
Thank You

USUSAL/USDTLong
Trading Plan USUAL/USDT (4H):
1. Support & Entry:
Support: 0.139–0.14.
2. Target Profit:
TP1: 0.16–0.17.
TP2: 0.20–0.2053.
3. Stop Loss:
0.1289

USUual short to new lows $0.1787Am anticipating that Usual usd might start to dump back down from here all the way back down to $0.1882 area where I'll be looking to exit. I have my target lower at $0.1787 area as its day time now in New york session time.
So could get more volume than usual to dump down faster...hopefully for the sake of my short.
Only thing that concerns me a bit is that recently looking at the price action i can see that it likes to wick aggressively at certain areas...maybe limit orders or just manipulation. Will be monitoring or what I might do is move stop to BE once it reaches those areas incase it gets another flash wick up, that I might not be able to react to

USUAL/USDT Rising Wedge – Bulls in Control, But Can It Hold?🚀 Rising Wedge – Bulls in Control, But Can It Hold?
I'm currently long on USUAL/USDT as price moves within this rising wedge on the 1H chart. While this pattern often signals a potential breakdown, momentum is still strong for now.
📊 Key Observations:
🔹 Rising wedge pattern forming – typically bearish, but breakouts can happen.
🔹 MACD is bullish, showing momentum still favors the upside.
🔹 RSI is climbing, approaching overbought territory – watching for signs of weakness.
🔹 Volume increasing, signaling strong participation from buyers.
🎯 Trade Plan:
✅ Current long position targeting $0.2497 (potential breakout zone).
✅ If price breaks above resistance, we could see further upside towards $0.27+.
⚠️ However, if the wedge breaks down, key support sits at $0.22, with the measured move potentially dropping to $0.20 or lower.
🔥 Watching closely – will bulls hold, or is a reversal coming? Stop-loss in place to manage risk. Let’s see how this plays out!
Drop your thoughts below! 👇 Are you long or short on this move?
#Crypto #USUAL #Trading #PriceAction #TechnicalAnalysis #CryptoTrading #LongPosition

USUAL is bullish (2H)Given the formed trigger line and the fact that the price is making higher Lows below this trigger line, we can look for buy/long positions on the order blocks formed below the price.
The targets are marked on the chart.
A 4-hour candle closing below the invalidation level will invalidate this analysis.
Do not enter the position without capital management and stop setting
Comment if you have any questions
thank you

USUAL analysis (4H)It seems that the correction for this asset has started from the point where we placed the red arrow on the chart.
This correction appears to be a diamond-shaped diametric.
Currently, we seem to be in wave F of this diametric. The price may reject downward from the red zone.
A daily candle closing above the invalidation level will invalidate this analysis
For risk management, please don't forget stop loss and capital management
Comment if you have any questions
Thank You


SUSUAL - Long Trade IdeaUSUAL price is currently holding its key support, a bounce is due at this level, and could potentially retest the supply above
Buying zone: 0.34 to 0.32
Local resistance is around 0.50 (bearish orderblock + hvn)
Stop below .295
Potential targets:
0.50
0.67
0.86

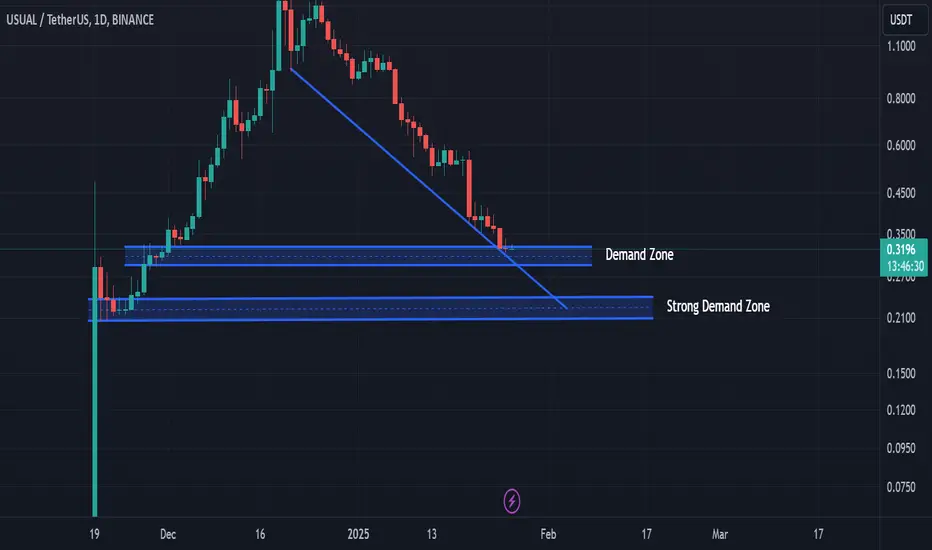
$USUALUSDT, USUAL, $USUAL(USD0++ coin)Possible two scenario
1- Demand Zone
demand zone depends upon the team of USUAL Lab. If usual lab redemption ratio continue with burning process then price is more down. otherwise buy order ($0.28 to 0$0.30)
2- Strong Demand Zone
Strong demand zone not follow the team announcement. its must be buy range (0.20 to 0.22).
otherwise project dead like VIE:LUNA