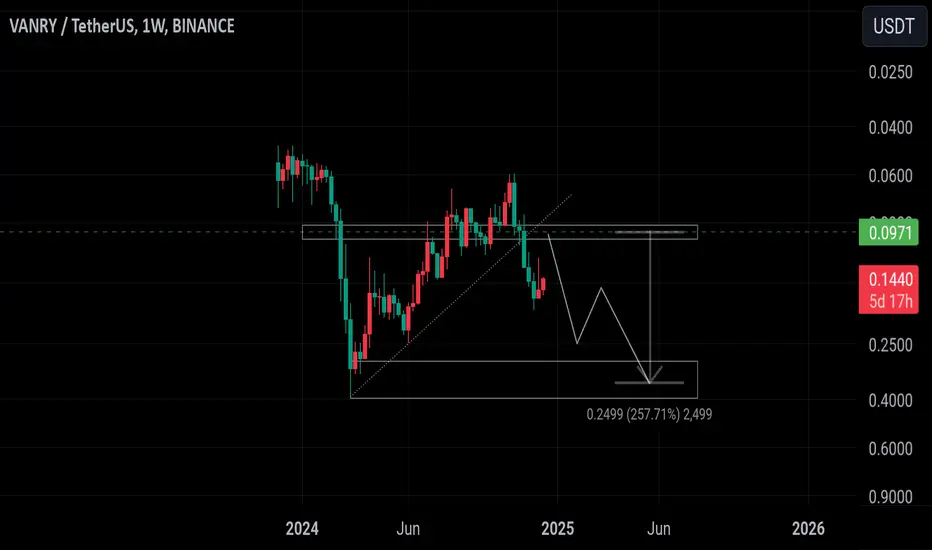
VANRYThe trend is currently going to retest the break out.
I would look to add longs in the green zone.
VANRYUSDT trade ideas

VANRYVanry/USDT - Technical Analysis
In this 3-day chart, a descending trendline breakout has been identified, signaling a potential shift to a bullish trend. Key highlights of the analysis are as follows:
Support Zone: Around $0.0613 and the highlighted red area serve as strong support, with the price consistently respecting this level in the past.
Resistance Zone: $0.13 has been broken and is expected to act as a new support level.
Projected Movement: As shown by the white lines, a gradual move toward higher levels above $0.20 is anticipated in the mid-term.
RSI Indicator: Currently at 53.96, indicating room for further upward movement without entering overbought territory.

VANRY/USDT Breakout Alert: Ready for a 100%+ Rally!!🚀 Hey Traders! 👋
If this setup excites you, hit that 👍 and smash Follow for trade ideas that deliver real results! 💹🔥
VANRY: Primed for Liftoff! 🚀
VANRY is breaking out from a symmetrical triangle on the 4-hour timeframe and has successfully retested it. The chart is screaming bullish potential, and this could be the start of an explosive move!
📍 Entry Range: Current Market Price (CMP) – Add more up to $0.115
🎯 Target: 100-120% upside potential
🔒 Stop-Loss: $0.108
⚖️ Leverage: Use low leverage (Max 5x) to manage risk
💬 What’s Your Take?
Do you see the same explosive potential in VANRY? Share your analysis, strategies, or predictions in the comments below. Let’s capitalize on this opportunity together and secure those massive gains! 💰🌊

VANRY planThis is my VANRY plan, I'm expecting a bounce around the 0.75 fib level. That is where I will enter

Vanry chart on dailyThis is my idea about vanry in my opinion it will do it soon best entry right now from this prices
As you can see its near the support line on daily fram

VANARY/USDT potential 70%++Accumulate under $0.15 - $0.05
Targets Points
TP 1 : $0.20
TP 2 : $0.22
TP 3 : $0.26

VANRY/USDTKey Level Zone : 0.11353-0.11527
HMT v2.0 detected. The setup looks promising, supported by a previous upward/downward trend with increasing volume and momentum, presenting an excellent reward-to-risk opportunity.
HMT (High Momentum Trending):
HMT is based on trend, momentum, volume, and market structure across multiple timeframes. It highlights setups with strong potential for upward movement and higher rewards.
Whenever I spot a signal for my own trading, I’ll share it. Please note that conducting a comprehensive analysis on a single timeframe chart can be quite challenging and sometimes confusing. I appreciate your understanding of the effort involved.
If you find this signal/analysis meaningful, kindly like and share it.
Thank you for your support~
Sharing this with love!
HMT v2.0:
- Major update to the Momentum indicator
- Reduced false signals from inaccurate momentum detection
- New screener with improved accuracy and fewer signals

VANRY - Potential reversal hereI'm expecting VANRY to higher from this here. After bouncing from the 0.75 fib level

Vanar Chain (VANRY)Vanar, previously known as Virtua, is an L1 blockchain designed for real-world adoption, based on our years of experience working with games, entertainment and brands. Vanar incorporates a series of products, including gaming, the metaverse, AI and brand solutions.
Anyway, VANRY chart is straightforward. A strong upward wave was followed by a long and deep correction wave. It seems VANRY's correction has been unfolded in a descending triangle pattern. When VANRY breaks this triangle, the next upward wave has already started. Let's see what happens.

VANRY/USDT: 50% PROFIT POTENTIAL SETUP!!🚀 Hey Traders! 👋
If this analysis hits the mark for you, don’t forget to smash that 👍 and hit Follow for premium trade setups that actually deliver results! 💹🔥
VANRY Looking Strong! 📈
VANRY is forming a symmetrical triangle on the 4-hour time frame and is holding the lower trendline like a champ. A solid bounce looks imminent from here. This could be your chance to catch a big move early! 🚀
📌 Trade Setup:
Entry Range: CMP and add more up to $0.138
Targets: $0.16 / $0.178 / $0.192 / $0.214 🎯
Stop Loss: $0.132 (Keep risk in check)
Leverage: Low leverage only (Max 5x)
💬 What’s Your Take?
Are you seeing the same breakout potential? Drop your thoughts, analysis, or predictions in the comments—let’s strategize and ride this wave together for massive profits! 🌊💰
👉 Stay tuned for more winning setups! 🚀💹

VANRY/USDT:Preparing for a Breakout After Reboundng from supportVANRY/USDT: Preparing for a Breakout After Rebounding from Trendline Support
VANRY/USDT is showing promising signs 📈 as it bounces off a strong trendline support and makes its way toward a critical resistance zone 📊. The pair is setting up a potential breakout scenario 💥, which could ignite a powerful bullish rally 🚀. Stay alert and wait for confirmation before taking action 👀.
Key Insights:
1. Trendline rebound: VANRY/USDT has successfully held its ground at a key trendline support, showing strong buyer interest at this level.
2. Approaching resistance: The price is now nearing a significant trendline resistance. A breakout above this zone could lead to substantial bullish momentum.
3. Bullish signals: Momentum indicators such as RSI and MACD are recovering and aligning with a bullish outlook ⚡.
Steps to Confirm the Breakout:
Monitor the resistance zone: Watch for a 4H or daily candle closing above the trendline resistance 📍.
Check trading volume: A noticeable surge in volume during the breakout is critical to confirm strong buyer activity 🔥.
Look for a retest: A successful retest of the broken resistance as new support can validate the breakout ✅.
Beware of fake-outs: Keep an eye on sharp reversals or wicks above the trendline that can indicate false breakouts ⚠️.
Risk Management Strategies:
Use stop-loss orders below the trendline support to limit potential losses 🔒.
Position sizing should be aligned with your overall trading plan to manage risk effectively 🎯.
Outlook:
If the breakout occurs, VANRY/USDT could kickstart a significant bullish rally, providing excellent trading opportunities for those who plan their entries wisely.
This analysis is for educational purposes only and not financial advice. Always conduct your own research (DYOR) 🔍 before making investment decisions.


VANRY Uptrend CountWe seem to have reached blue wave 3 in this uptrend movement.
Wave 4 correction is a buying opportunity.
The 50% pullback level (at 0.1362) is where I'll look for reversals in smaller timeframes for long trades.
The 0.22-0.23 zone (in gray), is the next major resistance, and would be a good target for wave 5.

VANRYUSDT Bullish Breakout or Bearish Collapse? Crucial LevelsYello, Paradisers! Is #VANRYUSDT primed for a bullish breakout or a looming downside? Here's the detailed analysis:
💎#VANRY could set up for a perfect bullish move if it successfully breaks the descending resistance trendline. Currently, the price is expected to test the support zone around $0.082 to $0.078. On the hourly chart, an *Inverse Head and Shoulders (IHNS)* pattern is forming, accompanied by a *three white soldiers* candlestick pattern—both strong bullish indicators. This suggests a high probability of a rebound from support, potentially pushing the price back up to challenge the descending resistance trendline. A successful breakout could lead to a significant move toward the key resistance at $0.113.
💎This $0.113 level is crucial; if VANRY breaks above it, we could see continued upward momentum toward the major resistance zone. However, if the price faces rejection at this key resistance, it could reverse and head downward.
💎The concerning scenario emerges if VANRY fails to rebound from the initial support zone and breaks down further. This could lead to a retest of the major support area. Historically, this zone has held strong, leading to significant rebounds.
💎For the bullish scenario to remain intact, a rebound from this level and a reclaim of the $0.062 support are necessary. If VANRY breaks below the major support with a daily close under it, it would confirm a bearish shift, potentially triggering deeper price declines.
🎖Stay disciplined and patient, Paradisers! Remember, long-term success relies on strategic trades and careful observation of key levels. Trade smart and be ready for the next big move!
MyCryptoParadise
iFeel the success🌴

VANRY looks bullish (1D)VANRY correction has started from the place where we have placed the red arrow on the chart.
This correction looks like a diametric as we are now at the end of the G wave.
We have identified two entry points for VANRY.
The targets are also marked on the chart.
Closing a daily candle below the invalidation level will violate this analysis.
For risk management, please don't forget stop loss and capital management
Comment if you have any questions
Thank You

VANRY Breakout Alert: Major Price Surge Ahead?VANRY is currently at a critical resistance zone Green at $0.1333 to $0.1398, which could determine its next directional move. A successful breakout above this level would signal a continuation of the bullish momentum, potentially pushing the price toward the next significant target resistance zone in Blue at $0.2399 to $0.2530. However, if the price fails to break through, a pullback is likely, with a potential retest of the trend line or $0.0993 support level. This area will be crucial in maintaining the bullish structure.
On the downside, if VANRY breaks below the support at $0.0993 and closes a daily candle under the support, the bullish scenario would be invalidated, shifting momentum to the bearish side. In this case, the price could decline further toward the support zone in Pink at $0.0769 to $0.0812, a level that has been respected in previous corrections. For now, the market’s next move depends on how it reacts to the current resistance level, making it a key areas to watch for traders.

VANRYUSDT It Will Break Out or Break Down? Key Level To Watch!Yello, Paradisers! Are you keeping an eye on #VANRYUSDT? This chart is reaching a critical level, and the next move could shape its mid-term direction. Let’s break it down.
💎#VANRY has the potential for a bullish continuation if it manages to break above the key resistance area at $0.15. If the price is rejected at this level, we could see it pulling back to retest the support zone around $0.118 to $0.11. A successful breakout above the key resistance would likely trigger a bullish movement, with a high chance of reaching the major resistance target.
💎On the flip side, if VANRY fails to rebound from the support zone and breaks below it, the price could form a false breakout. This would shift momentum downward, potentially heading to the demand area around $0.088 to $0.078.
💎Looking at past price behavior, the demand zone has been respected multiple times, providing strong support when tested. If VANRY revisits this zone, there’s a good chance we’ll see a similar reaction. However, if the price breaks below $0.078 and closes a daily candle under it, the bullish scenario would be invalidated, and we could see the price dipping further.
Remember, trading is about managing probabilities and protecting your capital for the long run. Stay sharp and trade smart!
MyCryptoParadise
iFeel the success🌴

Vanry weekly Time framei see bulish harmonics on weekly time frame which is completely done his D leg and going towards upside, all tps and Sl is mentioned on chart lets see whats happened next

VANRY/USDT Trade Ideas (Not a Financial Advice, Always DYOR!)VANRY possible to break trough $ 0.10, again. Will it break straight to $0.11?
VANRY/USDT currently traded around $ 0.0949, I think it's a good change to buy/long
TP 1 $0.10
TP 2 $0.11

VANRY/USDT: READY FOR AN ATH!Hey everyone!
If you’re finding value in this analysis, don’t forget to hit that 👍 and follow for more updates!
Technical Analysis:
VANRY is showing strong bullish momentum, breaking out from a falling wedge structure in the daily timeframe. With its current trajectory, VANRY looks poised to test its all-time high (ATH)—potentially offering gains of 150-200% from current levels. This could be the perfect opportunity to buy on spot and add more during dips.
Trade Details:
Entry Range: CMP and accumulate up to $0.093
Targets: 150-200% gain
Stop Loss (SL): $0.08
Leverage: Spot recommended for safety
About VANRY:
VANRY is an emerging blockchain project focused on decentralized applications (dApps) and DeFi solutions. It aims to simplify user experiences with a highly scalable and efficient platform, making it attractive to developers and investors alike. With consistent growth in its ecosystem, VANRY has become one of the most-watched projects in the altcoin market.
Conclusion: The bullish breakout combined with VANRY’s growing ecosystem makes this setup highly promising. Are you seeing the same potential? Drop your insights and analysis in the comments below, and let’s strategize for this exciting opportunity together!

VANRYUSDT - BUY IDEAVANRY is in strong bullish trend.
As the market is consistently printing new HHs and HLs on higher TF.
Currently the market is retracing a bit after last HH on daily , if this trendline will break then we will enter at breakout.
If the market successfully sustain this bullish confluence the next leg high could go for new HH.
we will enter at 0.10175

$vanry looking to continue downtrendas shown in the charts, lots of coins looking to go lower. stack your money to buy...
