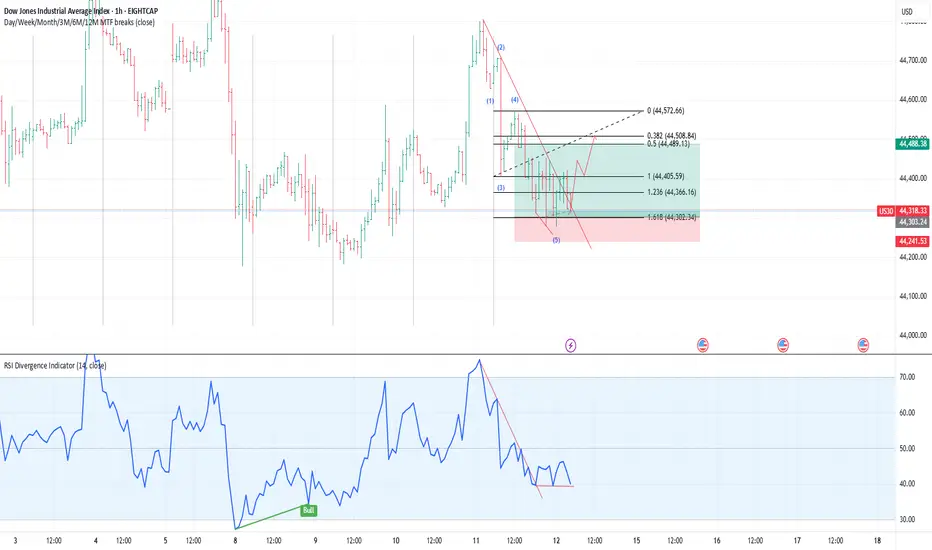
US30SIGNAL: BUY
A) SETUP: B (h1 wave5 to Correction)
B) CONFIRMATION:
1) SBT: done
2) RSI DIVERGENCE: done
3) MOMENTUM CANDLE: done
C) RR = 1:3
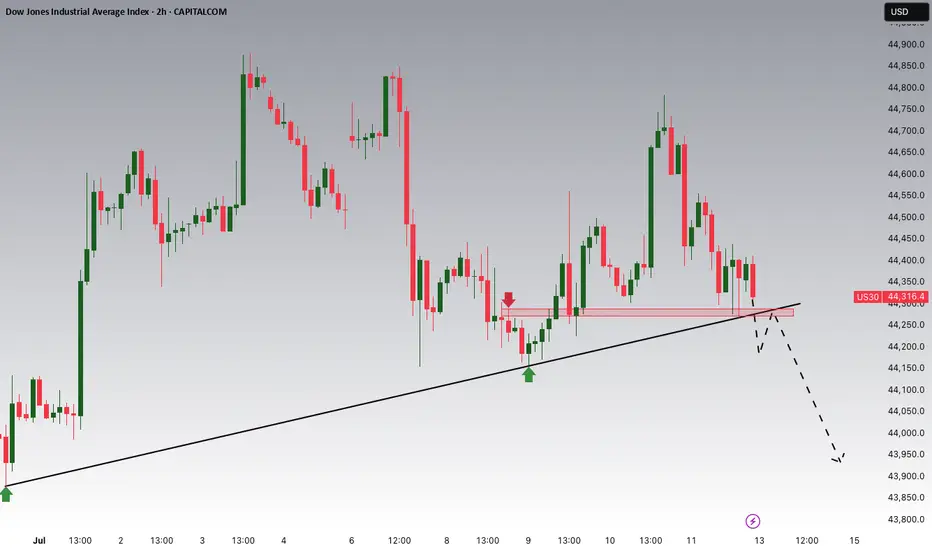
Us30 h4 next move Rejection near BoS
2. Break below support zone
3. Lower high formation
4. Bearish continuation towards 43,250

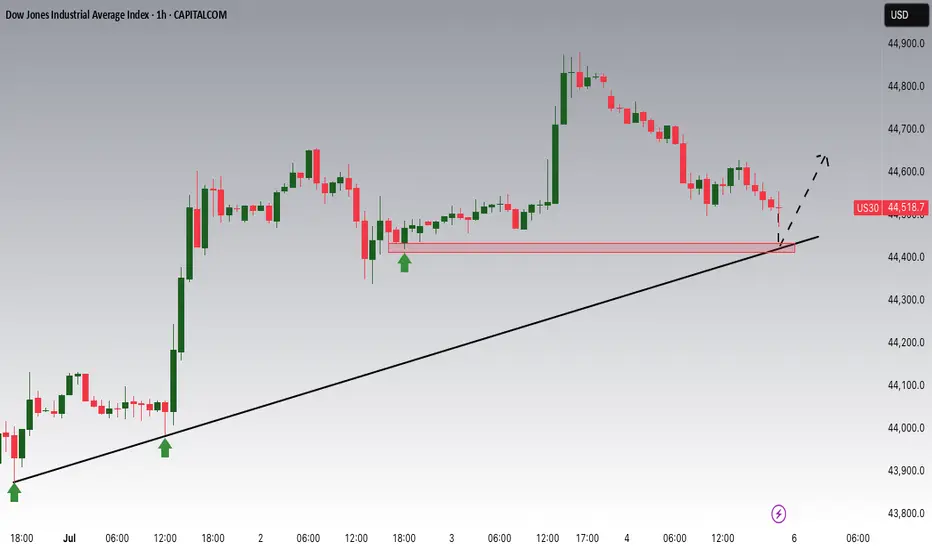
Dow Jones Potential UpsidesHey Traders, in tomorrow's trading session we are monitoring US30 for a buying opportunity around 44,400 zone, Dow Jones is trading in an uptrend and currently is in a correction phase in which it is approaching the trend 44,400 support and resistance area.
Trade safe, Joe.
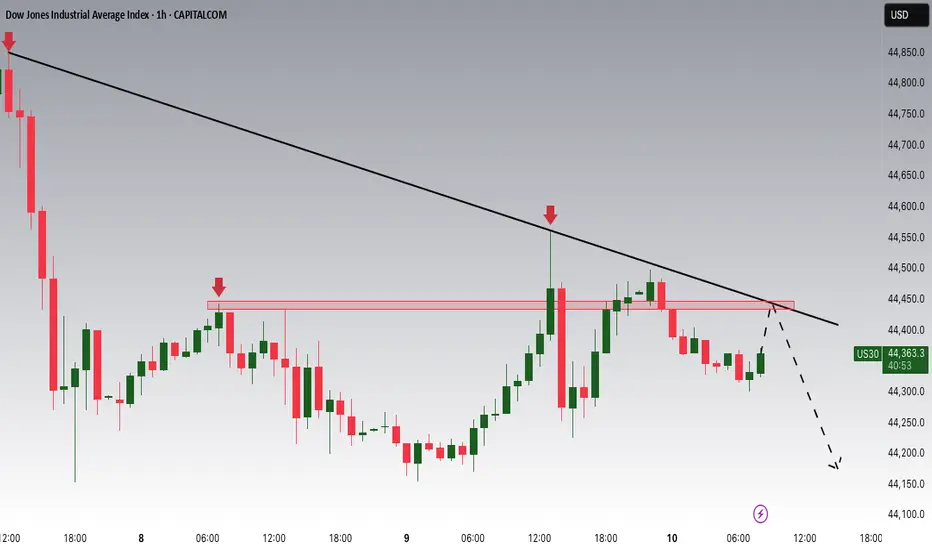
Dow Jones Potential DownsidesHey Traders, in today's trading session we are monitoring US30 for a selling opportunity around 44,450 zone. Dow Jones is trading in a downtrend and currently is in a correction phase in which it is approaching the trend at 44,450 support and resistance area.
Trade safe, Joe.
14.07.25 Morning ForecastPairs on Watch -
FX:NZDCAD
FX:USDJPY
FX:EURUSD
OANDA:US30USD
A short overview of the instruments I am looking at for today, multi-timeframe analysis down to what I will be looking at for an entry. Enjoy!

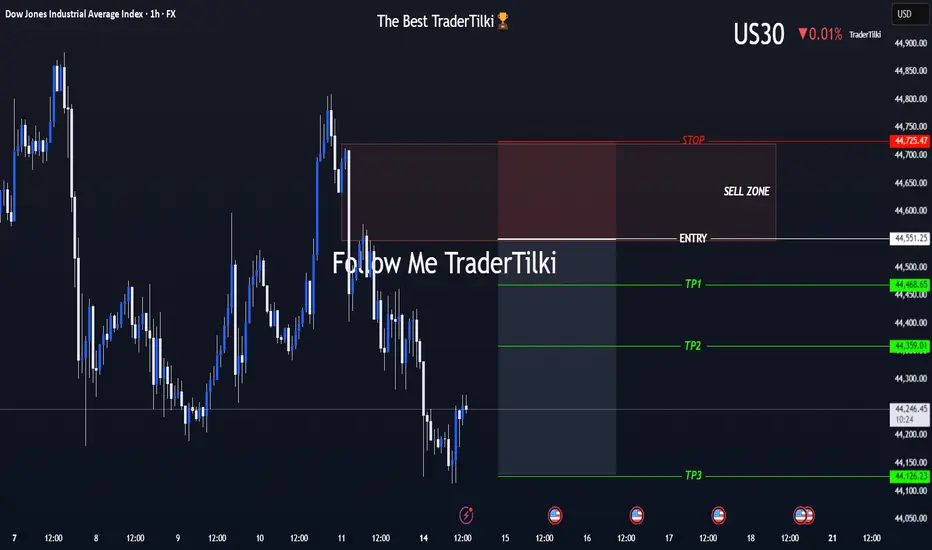
US30 (Dow Jones) Is On My Radar — The Moment’s Getting Close!Hey Guys,
I've marked my sell zone on the Dow Jones (US30) chart.
Once price reaches my entry range, I’ll be jumping into this high-probability trade setup.
🚪 Entry Levels: 44,551 – 44,632 – 44,677
🛑 Stop Loss: 44,725
🎯 Targets:
• TP1: 44,468
• TP2: 44,359
• TP3: 44,126
📐 Risk-to-Reward Ratio:
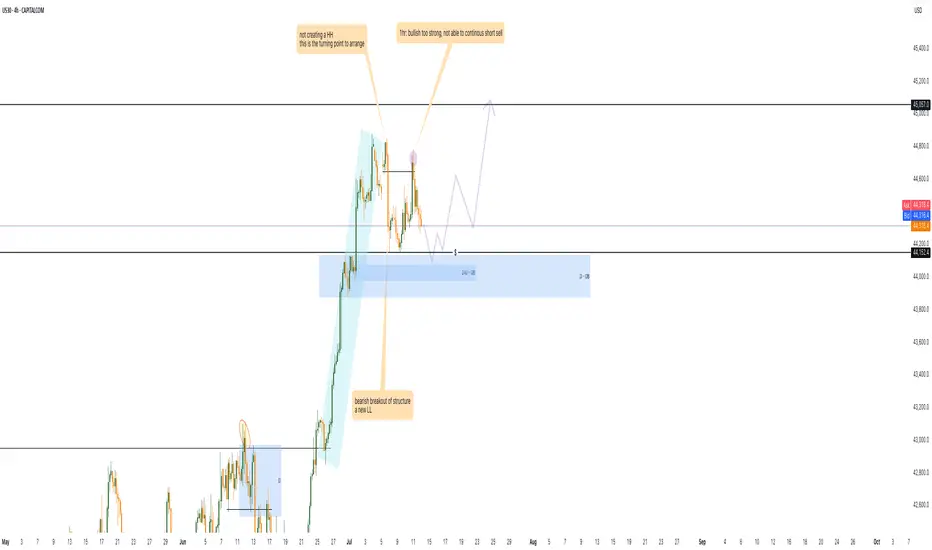
US30 Is Bearish! Sell!
Please, check our technical outlook for US30.
Time Frame: 12h
Current Trend: Bearish
Sentiment: Overbought (based on 7-period RSI)
Forecast: Bearish
The price is testing a key resistance 44,371.8.
Taking into consideration the current market trend & overbought RSI, chances will be high to see a

Dow Jones Potential DownsidesHey Traders, in the coming week we are monitoring US30 for a selling opportunity around 44,270 zone, US30 is trading in an uptrend and currently seems to be attempting to break it down, if we get dips below the trend we will be looking for a potential retrace towards further downsides.
Trade safe, J
US30 prepare for the bullish 1. there is double bottom at 44152 level, i will tend to wait for the sweep meaning the price go down and hit the 4hr order block.
2. wait for 15m/ 30m TF a strong bullish momentum.
3. retest the 44152 around level or 0.618 to enter the market to long
KOG - US30US30
Looking at this we have a clean reversal in play suggesting we’re going to get lower order regions before a potential RIP. The red boxes have been added and may give us opportunities to capture the tap and bounces on the smaller TFs.
If we can support lower, we could very well see this pus

See all ideas
Displays a symbol's price movements over previous years to identify recurring trends.
Frequently Asked Questions
DJ30 Future reached its highest quote on Jan 31, 2025 — 45,223.40 USD. See more data on the DJ30 Future chart.
The lowest ever quote of DJ30 Future is 17,177.00 USD. It was reached on Oct 31, 2014. See more data on the DJ30 Future chart.
DJ30 Future is just a number that lets you track performance of the instruments comprising the index, so you can't invest in it directly. But you can buy DJ30 Future futures or funds or invest in its components.