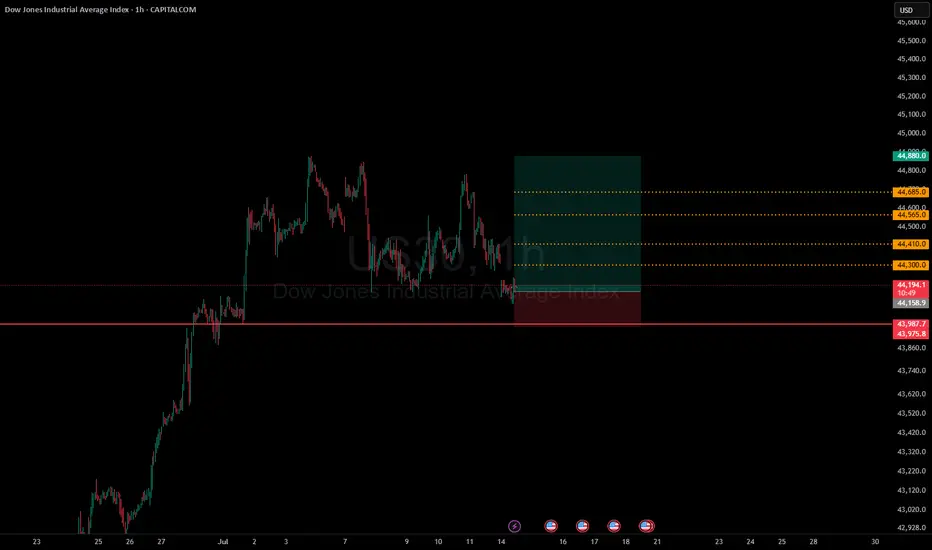
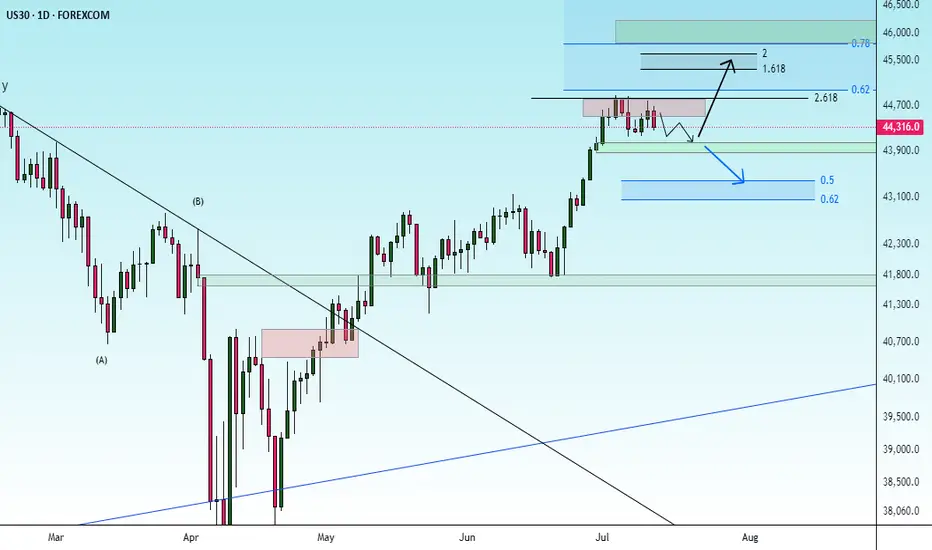
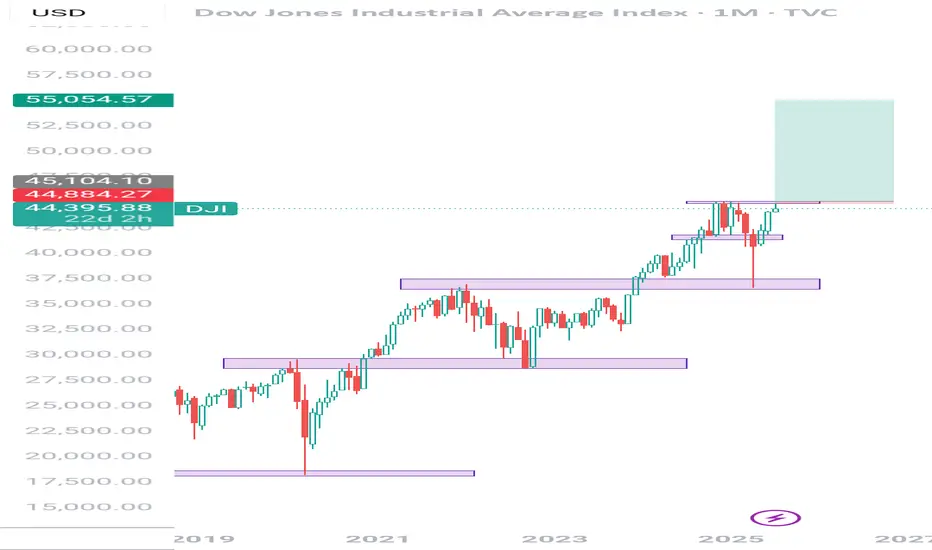
Dow Reverses for Pullback, Bullish Case Valid Above 44,400US30 OVERVIEW
Dow Jones Maintains Uptrend, Poised for Retest and Potential Extension
Dow Jones futures edged up by 69 points early Wednesday, signaling cautious optimism as investors shifted focus away from technology stocks to kick off the second half of the year.
The price continued its bullish trend until it reached the resistance zone, then reversed for a correction, falling below 44,630. Remaining below this level could extend the correction toward 44,400, which now serves as key support and pivot line for confirming a bearish trend.
As long as the index trades above 44400, the bullish trend remains intact, targeting 44,630, and potentially crossing the resistance zone within 44760 and 44920.
Resistance Levels: 44,630 → 44760 → 44920.
Support Levels: 44400 → 44120 → 43960.
DJ30FT trade ideas
SELL SIGNAL IS HEREUS30 initiates a trend line from 22nd June, 2025, on its 4hr chart, and current price action faces resistance, as such, leading to a temporary sell in a bullish trend. The most possible TP's for the sell signals are on the support lines that the trend line passes through.
tp 1- 43926.9
tp 2 - 43838.5
tp 3 - 43,561.7
Sl - 44200.
Risk wisely.......

US30Market Drivers
Rotation: Investors are shifting from tech to industrials and other Dow components to start the second half of 2025.
Trade Policy: Optimism over potential US trade agreements and a 90-day delay in new tariffs has supported the rally.
Technical Outlook: The overall momentum is bullish and first resistance at 45.043

BUYTrend Line Break
Previous Day Volume
Rejection Point
Untapped Order Point
London Session
High Structure Swing

DOW JONES INDEX (US30): Classic Gap Trade
I see a gap down opening on US30 index.
As always, there is a high chance that this gap is going to be filled.
A bullish imbalance candle and a local change of character CHoCH
indicate a highly probable rise to a gap opening level.
Target - 44300
❤️Please, support my work with like, thank you!❤️
I am part of Trade Nation's Influencer program and receive a monthly fee for using their TradingView charts in my analysis.

US30 Market Recap – 07/14/2025📍 US30 Market Recap – 07/14/2025
We’ve officially broken down out of the consolidation range between 44,220–44,867 📉
The structure is now shifting bearish, with price printing a series of lower highs and lower lows, and EMAs flipping to the downside. Sellers are in control heading into the week.
📊 Current Structure:
Bearish market shift confirmed below 44,220
EMAs (20 & 50) now angled downward and acting as dynamic resistance
Trendline support from June rally is broken
Last bounce attempt from 44,260 was weak and quickly faded
🔑 Key Levels:
🔽 Support: 43,800 → 43,600 → 43,300
🔼 Resistance: 44,220 → 44,400 zone
🧭 Pivot zone: Watch 44,000 psychological level for reactions
💡 Trade Setup Ideas:
🔻 Short Setup (Trend Continuation):
Entry: Retest + rejection near 44,220 or descending EMAs
TP1: 43,800
TP2: 43,600
SL: Above 44,300
⚠️ Avoid longing unless we reclaim and hold above 44,400 with strong momentum.
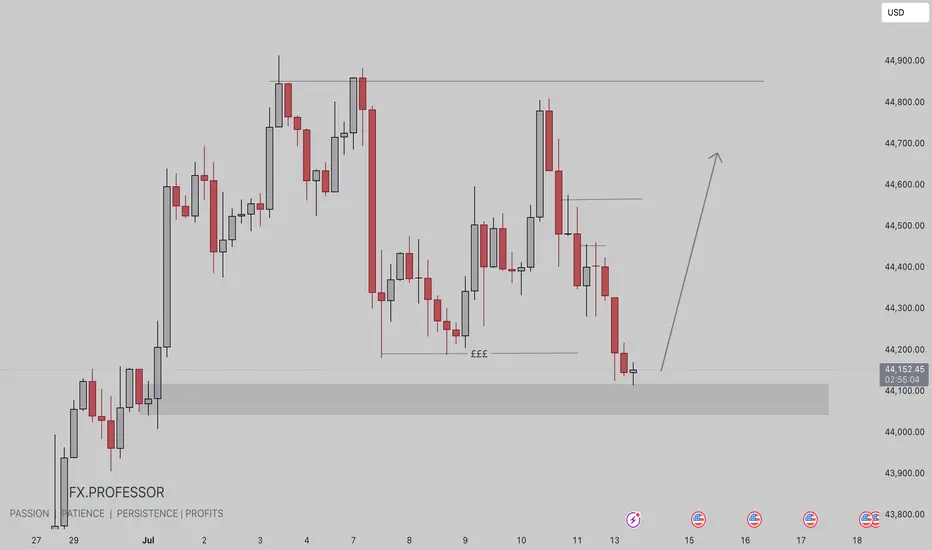
US30 BUY IDEA • Extreme Demand Zone Entry:
Price has cleanly tapped into a refined demand zone between ~44,050 to 43,994, a prime area for institutional entries. This aligns with a previous accumulation zone from late June.
• Triple Equal Lows (₤₤₤) Swept:
Clear liquidity grab beneath the equal lows, suggesting SMC-style inducement to fuel bullish orders.
• High R:R Setup in Play:
The long setup offers an expansive upside toward the 44,851 level — representing a premium retracement zone, inefficiency fill, and possible internal BOS confirmation.
14.07.25 Morning ForecastPairs on Watch -
FX:NZDCAD
FX:USDJPY
FX:EURUSD
OANDA:US30USD
A short overview of the instruments I am looking at for today, multi-timeframe analysis down to what I will be looking at for an entry. Enjoy!

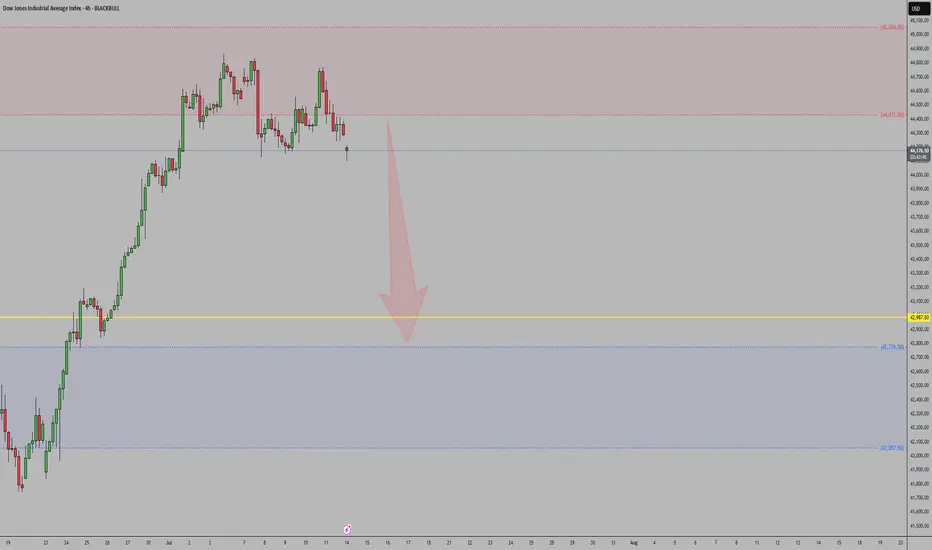
US30Net long positions are decreasing, signaling that institutional speculators are reducing exposure.
Commercials are increasing short positions, suggesting smart money expects downside in US equities.
Price rejected strongly from a weekly supply zone, failing to break previous highs.
A bearish break of structure (BOS) has occurred, with price forming a lower high and lower low pattern.
This aligns with broader macro conditions (stronger USD, rising yields).
Bias remains bearish — looking to sell pullbacks into premium zones or supply areas.
correctionIt is expected to fluctuate within the current support level and then continue the upward trend.
If the index breaks through the green support level, the correction to the next support level is possible.
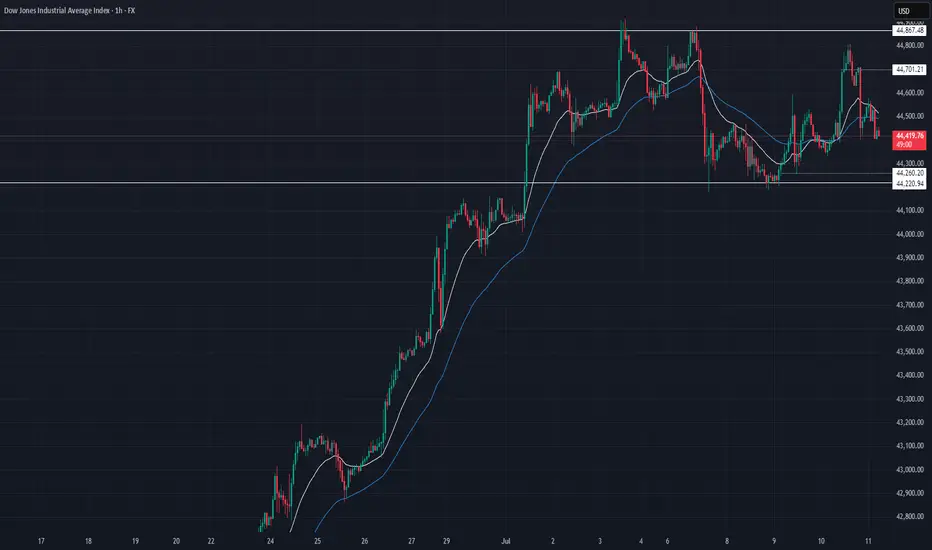
US30 Market Recap – 07/11/2025📍 US30 Market Recap – 07/11/2025
Another range-bound day on US30 as price continues to chop between key zones. Bulls pushed into 44,700, but failed to hold gains. We’re now sitting near the mid-range, and market indecision is growing 🤔
📊 Current Structure:
Range: 44,220 (support) ↔️ 44,867 (resistance)
Mid-range: 44,500 zone acting as key pivot
EMA structure still mixed: 20 EMA trying to cross back above 50 EMA
Lower highs building since last test of 44,867 = signs of seller presence
🔑 Key Levels:
🔼 Resistance: 44,701 → 44,867
🔽 Support: 44,260 → 44,220
⚠️ Mid-zone chop: 44,400–44,500 (avoid fomo entries here)
💡 Trade Setup Ideas:
🔻 Short Setup (If rejection holds below 44,500):
Entry: Rejection candle or break/retest under 44,400
TP1: 44,260
TP2: 44,100
SL: Above 44,600
🔼 Long Setup (Only above 44,700 reclaim):
Entry: Strong close + retest above 44,700
TP: 44,867 highs
SL: Below 44,500
🚫 NO-TRADE ZONE: 44,350–44,500 chop range = indecision zone ⚠️
US30 - medium to long term opportunity setting upHello,
The US30 futures are forming a bullish pattern, signaling potential upside. The MACD and moving averages align, presenting a compelling opportunity for buyers.
Investors should note President Trump's aggressive push for Federal Reserve Chair Powell to cut interest rates, including threats to dismiss him if he resists. While this rhetoric could unsettle markets, we believe Trump is unlikely to follow through, as markets have likely found a bottom and he would avoid actions that could trigger a downturn.
Technical analysis supports early entry for bold investors, with a stop-loss placed below the recent low. Proceed with caution and good luck.
Disclosure: I am part of Trade Nation's Influencer program and receive a monthly fee for using their TradingView charts in my analysis.

DowJones bullish continuation supported at 44000Key Support and Resistance Levels
Resistance Level 1: 45000
Resistance Level 2: 45445
Resistance Level 3: 46000
Support Level 1: 44000
Support Level 2: 43700
Support Level 3: 43430
This communication is for informational purposes only and should not be viewed as any form of recommendation as to a particular course of action or as investment advice. It is not intended as an offer or solicitation for the purchase or sale of any financial instrument or as an official confirmation of any transaction. Opinions, estimates and assumptions expressed herein are made as of the date of this communication and are subject to change without notice. This communication has been prepared based upon information, including market prices, data and other information, believed to be reliable; however, Trade Nation does not warrant its completeness or accuracy. All market prices and market data contained in or attached to this communication are indicative and subject to change without notice.

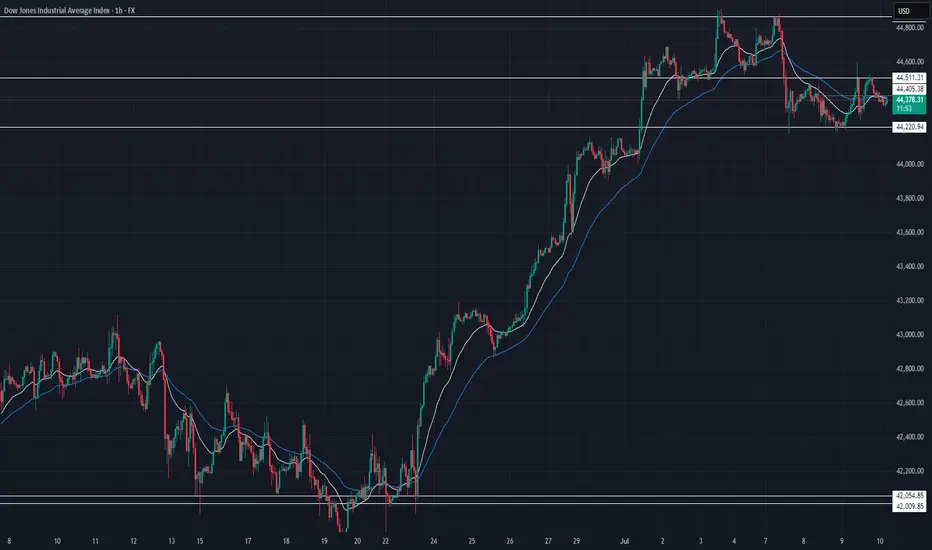
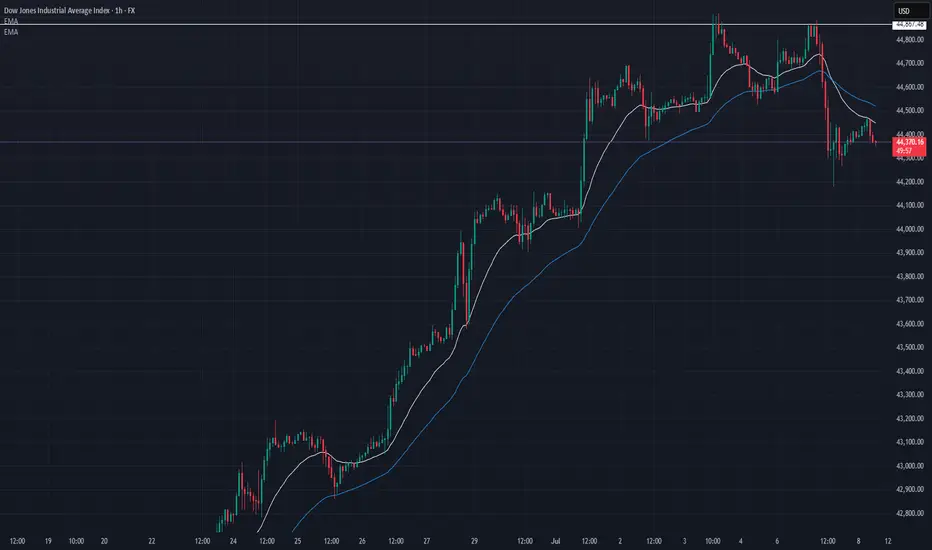
US30 Market Update – 07/10/2025
📍 US30 Market Update – 07/10/2025
The bounce attempt failed and sellers are still in control 🐻
Price attempted a reclaim above 44,511 but got rejected again and is now consolidating beneath the EMAs 🚨
📊 What We’re Seeing:
Lower highs forming below 44,600
Rejection wicks near EMA levels (bearish pressure)
EMA ribbon is now resistance zone (20 EMA < 50 EMA)
Key intraday support held at 44,220, but barely
🔑 Key Levels to Watch:
🔼 Resistance: 44,511 → critical for bulls to flip
🔽 Support: 44,220, if broken → next is 44,000
💡 Trade Setup Ideas:
🔻 Short Setup (Main Bias):
Wait for rejection near 44,450–44,500
Entry trigger: Bearish engulfing or shooting star
Targets: 44,250 → 44,000
SL: Above 44,600
🔹 Long Setup (If Bulls Step In):
Must reclaim and close above 44,600 on 1H
Look for strong bullish candle with follow-through
Targets: 44,800 retest
SL: Below 44,400
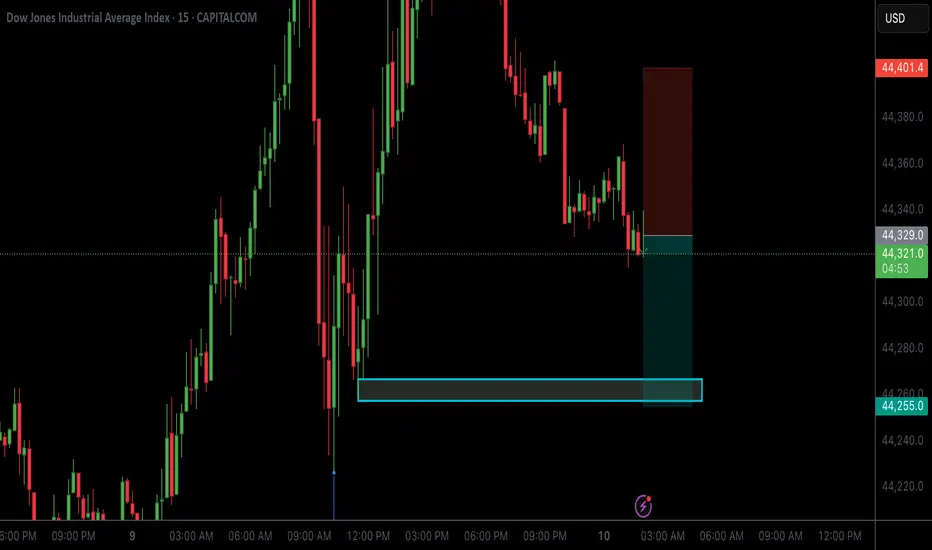
US30 SELLTake trade on your own risk!
still moving on the downward trend to the next supply & demand zone, no sign of reversal.
Set TP: 44,255
sell then buyWe are witnessing a change in the trend from upward to downward. It is time for him to go down and see the bottom of his first weekly pivot and then go back up to reach the new weekly ceiling

US30 – Pullback Holding Above 44300After rallying into the 45,011.92 resistance, US30 is pulling back modestly but still trading above the prior breakout zone at 44,313.00. This could act as short-term support if bulls maintain momentum.
Support at: 44,313.0 🔽 | 43,800.0 🔽
Resistance at: 45,011.9 🔼 | 45,500.0 (psych level) 🔼
🔎 Bias:
🔼 Bullish: Price holding above 44,313.0 keeps bullish structure intact with eyes on new highs.
🔽 Bearish: A breakdown below 43,800.0 may shift momentum and trigger a deeper retracement toward 42,800.0.
📛 Disclaimer: This is not financial advice. Trade at your own risk.

Long position on DJIA Price action analysis on Dow Jones. Dow Jones has a repetitive pattern of retesting the previous Higher High after a market crash so in this analysis I'm anticipating a breakout on the 45.000 price mark then go long till 55.000 which is 10000 pips before a market crash occurs to retest the 45.000 price. Dow Jones moves +- 18000 pips on a long position before a market crash occurs which provides a beautiful opportunity to go long.
uptrendIt is expected that the corrective pattern will end in the current support area and then the beginning of the upward trend will be formed.
If the index crosses the support area, the continuation of the corrective trend will be likely.

Dow Jons artistic outlook - a proposition for you to take or disWhen I'm looking at my chart, i like to know what this story is about.
This is what
the whole world is looking at,
some say between 1-5 years from, now we are all going to see what it is about.
Most of us want to prosper but there is a certain minority group who doesn't want that. Why? IDK tell me that.
--------------------------------------------------
The chart do not represent a prediction of any kind its more an invitation how to start thinking -about build.
---------------------------------------------------
Time is short although my chart is on 12 month time line
=================================================
they say 1-5 years but very unlikely now. I don't know if you can see that
there is a time in next 3 years when the trend goes up.
Its my 10 years of experience i and some hard challenging times. i tracked dow nearly 24/7 for 3 years now so i know what it is about. to explain it to you in full could take some time and here is not a place to do just that.
You can see some general shapes and possible traversals, it happens i track them quite correctly due to my different mind.
"I have good intuition when I'm true to myself
this is my point of view I hope to share with you."
SimonTheBeekeeper
PS:
when things starts to move fast
i have my map to find out
where and how.
--------------
thanks for watching I

US30 Market Recap – 07/08/2025📍 US30 Market Recap – 07/08/2025
The bulls lost steam, and momentum shifted 📉
After tapping a local high near 44,867, price got rejected hard and broke below both EMAs for the first time in over a week 🚨
🧠 What’s Changed:
Clean lower high formed around 44,800s
EMA structure broken → 20 EMA crossed below the 50 EMA
Price now consolidating under 44,450 zone
📊 Key Levels:
🔼 Resistance: 44,521 → previous EMA zone
🔽 Support: 44,250 → then 44,000
📈 Trade Setup Ideas:
🔻 Short Setup (Primary Bias):
Look for rejection around 44,450–44,500 zone
Entry: Bearish engulfing or break/retest from 15min or 1H
Targets: 44,250 → 44,000
SL: Above 44,600
🔹 Long Setup (Only if Reclaimed):
Bulls must reclaim 44,600 and flip it to support
Watch for strong breakout candle + volume
Target: 44,800 → 44,867
SL: Below 44,450
Weekly Forex Outlook Sun.July.6.2025 - Fri.July.11.2025Like and Comments would be appreciated :D Not Financial Advice, Just my outlook/opinion
