DOW JONES about to skyrocket based on the Gold/Silver ratio!Dow Jones (DJI) has been basically consolidating for the past month or so, following the massive April 7th bottom rebound but there is a very distinct indicator that shows it is about to skyrocket.
That is the Gold/ Silver ratio (blue trend-line). Gold (XAUUSD) as a safe haven, attracts capital in times of market uncertainty. Silver (XAGUSD), as a metal of industrial use, attracts capital in times of economic boom and prosperity.
In the past 6 years more particularly, every time the Gold/ Silver ratio declined, Dow started rising aggressively (exception July-Aug 2019, when the market rose straight after), as investors clearly showed their risk-on appetite by buying Silver (optimism) at the expense of Gold (fear).
Dow's current consolidation indicates that there may be high accumulation in the past month and the ratios extended decline suggests a skyrocket move is up next.
-------------------------------------------------------------------------------
** Please LIKE 👍, FOLLOW ✅, SHARE 🙌 and COMMENT ✍ if you enjoy this idea! Also share your ideas and charts in the comments section below! This is best way to keep it relevant, support us, keep the content here free and allow the idea to reach as many people as possible. **
-------------------------------------------------------------------------------
💸💸💸💸💸💸
👇 👇 👇 👇 👇 👇
DJ30FT trade ideas

dji looking to rebound after 2 days on the rough marketThe fib circle looks to be showing an upward trend. Notice how the blue circle is completely overtaken and the drop yesterday. Showing that a potential reversal is within both levels. Seeing how this formation is. Looking to be on a continuous volatility for the djia.
If someone could look at this and if you would, I ask for an opinion?

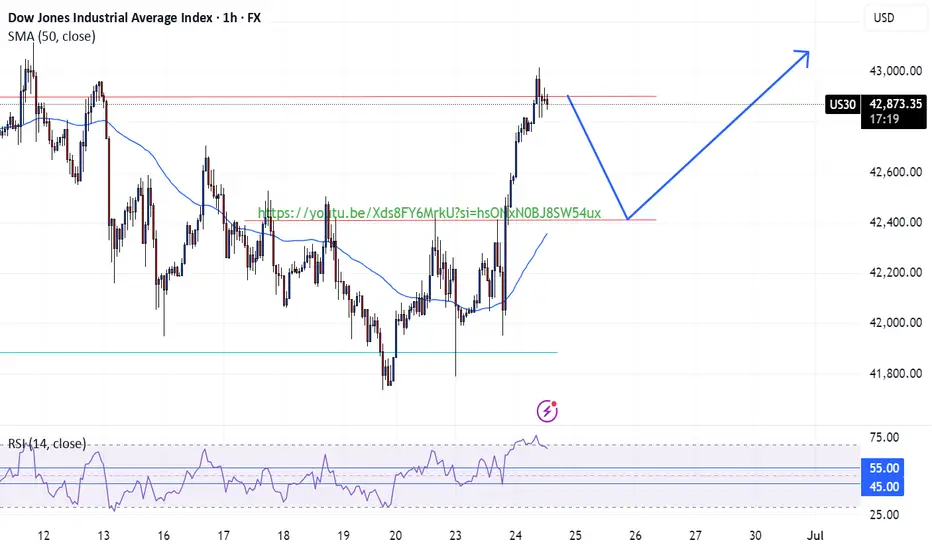
US30 Long Opportunity US30 shows strong bullish confluences at the opening of the week, currently testing the resistance level at 42,900. Price is above above the 50 SMA and favors bullish momentum per the RSI above 55.
Potentially retracement towards the break and retest level at 42,400 where we could see a potential continuation of the bullish trend after the market collects enough liquidity.
This is support by fundamentals of the day being the cease fire between Iran-Israel. investor more comfortable taking risks and stepping back into the indices.
The Dow Jones Index reboundsUS indices rebounded following the US president’s announcing a ceasefire deal in the Middle East, which brought some optimism to the markets and among investors, positively impacting US markets in particular.
The Dow Jones Index rose at the start of this week by approximately 2.62%, reaching a new high above the 42,711 level, which represents the last lower high recorded by the market. A breakout above this level could indicate a shift in trend from bearish to bullish.
If the price pulls back to the 42,025.62 level, it would be considered a corrective move, with a possible upward rebound from that level aiming to target 42,719.99 and potentially continue the bullish trend in the long term.
However, if the price falls below the 41,755.45 level and a four-hour candle closes below it, the positive scenario mentioned above would be invalidated.

Dow Jones eyeing a breakout as war fears de-escalate!Dow Jones Industrial Average (DJIA) stands at 42,581.78 points, reflecting a 0.9% increase from the previous day. This uptick is attributed to investor optimism following a restrained retaliatory missile strike by Iran on a U.S. base in Qatar, which was perceived as non escalatory. Additionally, comments from Federal Reserve Governor Michelle Bowman suggested support for a potential interest rate cut in July, contingent on sustained low inflation .
The DJIA's performance this year shows a modest gain of 0.1%, underperforming compared to the S&P 500's 2.4% increase and the Nasdaq's 1.7% rise. Notably, the index is approximately 6.4% below its all-time high of 45,073.63 reached in December 2024 .
From a technical perspective, the DJIA is trading just above the 42,000 level, with key support around 41,500 and resistance near 43,000. The index has recently faced challenges breaking through the 42,600 mark, indicating potential short-term volatility. Market participants are closely monitoring upcoming economic data and Federal Reserve decisions, which could influence the index's trajectory in the near term.
For investors, the current environment presents opportunities to assess the DJIA's performance relative to other indices, considering factors such as geopolitical developments and monetary policy expectations.
"The forecasts provided herein are intended for informational purposes only and should not be construed as guarantees of future performance. This is an example only to enhance a consumer's understanding of the strategy being described above and is not to be taken as Blueberry Markets providing personal advice."

Dow Jones Gains on Rate Cut Hopes and Ceasefire Relief US30 OVERVIEW
Wall Street Rises on Fed Rate Cut Hopes and Geopolitical De-escalation
The Dow Jones (US30) remains under bullish pressure, supported by rising expectations of a Federal Reserve rate cut later this year and a ceasefire agreement between Iran and Israel, which has eased market tensions.
TECHNICAL OUTLOOK – US30
The price maintains a bullish bias as long as it trades above the pivot level at 42,810, with upside potential toward the key resistance at 43,210.
A short-term bearish correction is possible toward 42,810 or even 42,670, but the broader structure remains bullish above these levels.
Resistance Levels: 43,060 → 43,210 → 43,350
Support Levels: 42,670 → 42,420 → 42,160
A sustained break below 42,670 could signal deeper correction, while a clear move above 43,210 would confirm continued bullish momentum.

US30 - Intraday long scalp then short Looking for that intraday scalp on the long around 120 points can hold potentially further up to our higher supply level. If bearish PA is confirmed around the 43,000 level can look to take this short. All dependent on PA.

US30 Will Grow!
HI,Traders !
#US30 is trading in an
Uptrend and the Indice
Made a bullish breakout
And a pullback so affter
The retest of the broken
Falling resistance which
Is now a support we will
Be expecting a further
Bullish move up !
Comment and subscribe to help us grow !

US 30 the 5th wave US 30 the 5th wave this is not an impulse wave totally.
just the conflict of is going to be peace so if we look at OIL we can see everything is good.

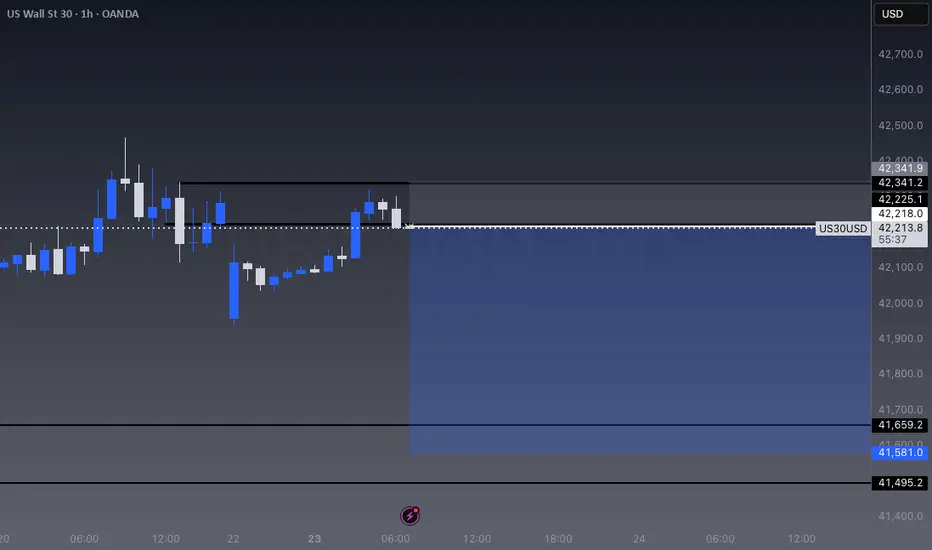
US30 H4 I Bullish Bounce Based on the H4 chart analysis, the price is falling toward our buy entry level at 42,333.01, a pullback support.
Our take profit is set at 42,981.24, a swing high resistance.
The stop loss is placed at 41,803.95, below the 38.2% Fib retracement.
High Risk Investment Warning
Trading Forex/CFDs on margin carries a high level of risk and may not be suitable for all investors. Leverage can work against you.
Stratos Markets Limited (tradu.com ):
CFDs are complex instruments and come with a high risk of losing money rapidly due to leverage. 63% of retail investor accounts lose money when trading CFDs with this provider. You should consider whether you understand how CFDs work and whether you can afford to take the high risk of losing your money.
Stratos Europe Ltd (tradu.com ):
CFDs are complex instruments and come with a high risk of losing money rapidly due to leverage. 63% of retail investor accounts lose money when trading CFDs with this provider. You should consider whether you understand how CFDs work and whether you can afford to take the high risk of losing your money.
Stratos Global LLC (tradu.com ):
Losses can exceed deposits.
Please be advised that the information presented on TradingView is provided to Tradu (‘Company’, ‘we’) by a third-party provider (‘TFA Global Pte Ltd’). Please be reminded that you are solely responsible for the trading decisions on your account. There is a very high degree of risk involved in trading. Any information and/or content is intended entirely for research, educational and informational purposes only and does not constitute investment or consultation advice or investment strategy. The information is not tailored to the investment needs of any specific person and therefore does not involve a consideration of any of the investment objectives, financial situation or needs of any viewer that may receive it. Kindly also note that past performance is not a reliable indicator of future results. Actual results may differ materially from those anticipated in forward-looking or past performance statements. We assume no liability as to the accuracy or completeness of any of the information and/or content provided herein and the Company cannot be held responsible for any omission, mistake nor for any loss or damage including without limitation to any loss of profit which may arise from reliance on any information supplied by TFA Global Pte Ltd.
The speaker(s) is neither an employee, agent nor representative of Tradu and is therefore acting independently. The opinions given are their own, constitute general market commentary, and do not constitute the opinion or advice of Tradu or any form of personal or investment advice. Tradu neither endorses nor guarantees offerings of third-party speakers, nor is Tradu responsible for the content, veracity or opinions of third-party speakers, presenters or participants.

US30 TodayUS30 Today is still bearish
My SSM structure is still down
I'm waiting to open US and looking good entry

Lets See How It Plays out. TP1 Secured.Break of trenline and rejection from GAP+FVG.
Sweep of $$$ Liquidity from and Equal Lows.

US30 Bullish ConfirmationsBullish confirmations to look out for:
1. Break of the double bottom rejection pattern neckline to validate the pattern
2. Breakout and retest of the resistance trendline
3. Creation of new higher lows on H4 and H1 Timeframes following the above confirmations

US30 | FLUSHPOINTto keep it simple we missed our first trade on US30 due to the open gap
therefore we are attempting to re-enter trade as we a back at our POI

US30 Sell IdeaWe see price beginning to downtrend forming LL & LH. We also see price beginning to get closer to our daily low. Now we enter off of the 2nd mitigation of the bearish engulfing located at our point of interest on the 1hr. Really nice signature setup here. Overall I feel good I really took my time finding this setup!
US30 next target releasedNo comment needed. All information is in the chart analysis.
Steps to follow:
Analyze yourself.
Take the position with SL and Take Profits.
Wait, it may take a couple of days, so take a break and step away from the screen from time to time, just like I do :)
Get the result.
I will update the trade every day.
Like, comment with your good mood or viewpoint, share with your circle. It’s together that we get stronger!
Good trades, Traders!
The golden bear

Falling towards major support?Dow Jones (US30) is falling towards the pivot and could bounce to the 1st resistance that aligns with the 78.6% Fibonacci retracement.
Pivot: 41,520.25
1st Support: 40,653.80
1st Resistance: 43,238.47
Risk Warning:
Trading Forex and CFDs carries a high level of risk to your capital and you should only trade with money you can afford to lose. Trading Forex and CFDs may not be suitable for all investors, so please ensure that you fully understand the risks involved and seek independent advice if necessary.
Disclaimer:
The above opinions given constitute general market commentary, and do not constitute the opinion or advice of IC Markets or any form of personal or investment advice.
Any opinions, news, research, analyses, prices, other information, or links to third-party sites contained on this website are provided on an "as-is" basis, are intended only to be informative, is not an advice nor a recommendation, nor research, or a record of our trading prices, or an offer of, or solicitation for a transaction in any financial instrument and thus should not be treated as such. The information provided does not involve any specific investment objectives, financial situation and needs of any specific person who may receive it. Please be aware, that past performance is not a reliable indicator of future performance and/or results. Past Performance or Forward-looking scenarios based upon the reasonable beliefs of the third-party provider are not a guarantee of future performance. Actual results may differ materially from those anticipated in forward-looking or past performance statements. IC Markets makes no representation or warranty and assumes no liability as to the accuracy or completeness of the information provided, nor any loss arising from any investment based on a recommendation, forecast or any information supplied by any third-party.

US30 H4 AnalysisUS30 Showing a bullish Flag to 42,762. If it breaks this zone, Most probably can fly upto 44,000 and higher. Trading Analysis from 23-06-25 to 27-06-25. Take your risk under control and wait for market to break support or resistance on smaller time frame. Best of luck everyone and happy trading.🤗

Weekly Forex Outlook Sun.June.15.2025 - Fri.June.20.2025Like and Comments would be appreciated :D Not Financial Advice, Just my outlook/opinion

Dow Jones potential down side moveDow Jones is showing some sign of wanting to go short with also the potential dollar strength coming into the markets and the bond yield markets having a bullish trend for the last couple of months. Dow has reach a full fib extension and we could see some form of retracement continuation.

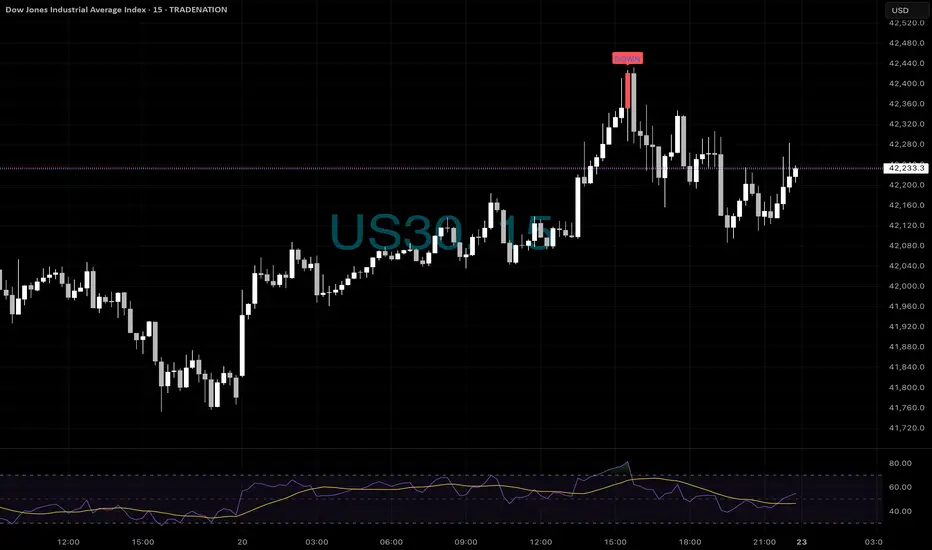
DOW - Shorts as well📉 US30 Top Called to the Point – Friday 15min Reversal
It doesn’t get much cleaner than this.
Our ELFIEDT – X-REVERSION system printed a precise “DOWN” signal right as price exhausted into its session high.
That wasn’t guesswork — it was quantified mean reversion + RSI divergence, confirming loss of momentum at a stretched level.
💡 Look below: RSI divergence already warned us…
💣 Add our signal = high-confidence short with a defined stop just above the bar.
🧠 This is what happens when price structure, statistics, and momentum all agree — you get in where it matters.
📲 Want to trade smarter and get setups like this in real time?
Message us now to start using our indicator suite — it’s already helping traders catch tops, bottoms, and reversals with confidence.
⸻
#US30 #DowJones #TopReversal #ELFIEDT #TradeSmarter #TechnicalAnalysis #PriceActionSignals #ReversionTrading #ShortSetup #MomentumTrading #RSIDivergence #TradingViewIndicators #ProfitFromPrecision #XReversionTool
DJI SELLING BIAShello guys,
this is how i gonna act. upcoming months we can see downside in dow jones.
please keep in mind that trading is a risky so act wisely!

