FRA40 trade ideas

Swing Trade With The CAC 40 TrendThe CAC 40 broke out of its November pivot high. This market action builds not only the stage for a French but also probably for a European rally during the next weeks!
As of now, the only terminal elliott wave structure that meets the rules & guidelines is an irregular flat into primary wave 2(circle). We do not embark onto this scenario unless last weeks pivot low 5474 gets broken and leaves us with 3 waves to the upside instead of 5 waves into minor wave 3.
Hence, we expect the CAC 40 to extend higher.
S/L 5474
T 5950

CAC40 Daily chartThursday's candle was undecided, but friday was completely something else. Buyers jumped in and the price closed above my S/R zone which became a support level and a reason for me to add to my long positions.

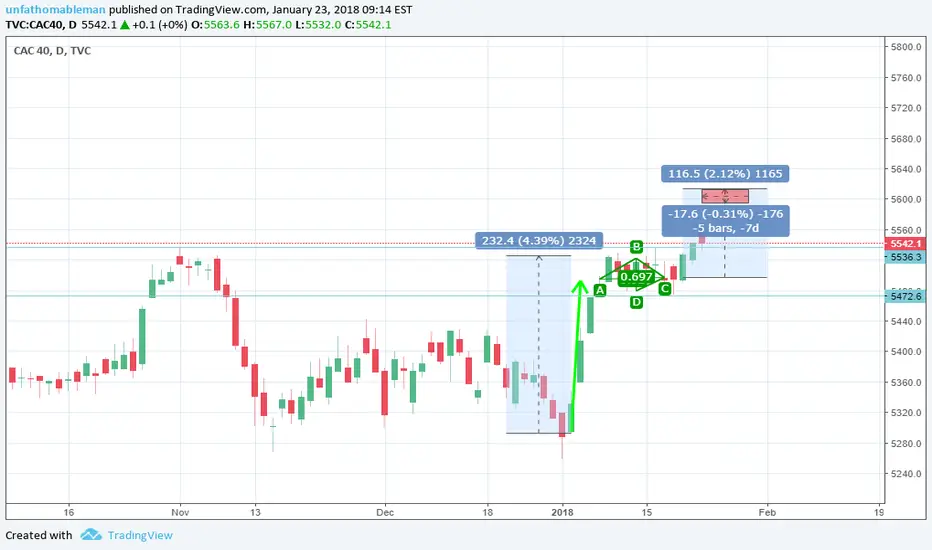
CAC 40 Daily chartCAC 40 had a 2 days though break. It is still within support/resistance zone, but just like DAX there was some profit taking and if the price goes below the zone we might see some more selling in coming days.

High & tight flag prediction for CAC 40We should be hitting red area as TP.
This is just an idea, not an investment recommendation.
FRA40 Daily chartFrench index is stuck for a few days at the 01/11/17 high and fails to break out. We might see some selling and targeting previous support level. If it breaks through the highs we might see some strong buying reaching new highs.


CAC40, back to 5300 for end januaryCAC40 cannot break the strong 5500 resistance, buyers failed multiple time to take the price over this limit. The price has drawn a double top in the resistance horizontal canal. Since yesterday, sellers takes advantage and have created a new bear canal. In case tomorrow the support of the 5480 is significantly broken, the price will decrease to 5300.


Bearish Short Term #Elliottwave Triangle In CAC 40It is likely that the contracting triangle played out in the CAC 40. The triangle counts as complete at this point. We expect swift price action to the downside into the 5,150-5,235 area. We'll focus on a buy the dip opportunity accross Europe rather than shorting at this stage.

CAC40 4h LongGood buying opportunity RSI oversold level of support looking for targets higher 3:1 RRR


A positive end to the year for the CAC40??After yesterdays negative day for the #CAC40, a bullish triangle pattern, also coinciding with Fibonacci support & resistance zones building out??


CAC40 Bull PowerTrading method: RS ADVANTAGE Stage 5 system setup 95% accurate system manually forward tested over 3 years. In this situation we are now waiting for Awesome Osci to go into positive territory for trade entry confirmation to resume this bullish bias. Market execution for entry, confirmation will be required for entry.
Risk Description: low risk trend continuation setup to continue this bullish movement.
Profit expectations: 18 day trade length expected before hitting profit target I will post exit strategy when signal receives a exit signal.

Cac 40: Long-Pull long tradeCac 40 Long-Pull Long
This index continues to make positive technical moves: the
little continuation pattern that brings the index perfectly
back to the long term dynamic that had acted as resistance
for 10 long years since 2007 highs - it comes back for one last
kiss - right on a line 10 years old - it turns it into support and
fires northwards - classic stuff, even in a big index. And then
for its next bull move it rallies from the long term dynamic to
make a new post crash high and then comes back down to use
the previous major high in 2015 as support - again resistance
has been turned into support. Every big move it makes is
positve. Now it should move up to 5850, consolidate a little
and then rally to 6152. Support is firm at 5261. This index has
890 points upside and 120 maximum downside. If you leave
the stop under 5255 on this trade there is a very low
likelihood of it being hit.

CAC40 - Bullish trend can restartThe configuration of the CAC40 index is very interesting, buyers and sellers are fighting around the temporary support of the 5350 points (red dotted line). The very strong support of the 5300 has been tested 1 time last week. In the coming days the 5300 support line will rejoin major ascending support @5300 points, if the CAC40 price haven't break the 5300 support before the 2 line rejoin, a super support will be created and it will become very difficult to break it. This can initiate a new strong bullish trend for end 2017 / beginning 2018.

CAC 40 DOWN (1 HOUR)Hi all,
Look at my CAC 40 chart on 1 hour, it will down strongly in the next hours.
Have a good day all ;)

CAC retracement may come soonIDEA - A retracement is due on CAD. For a safe long entry a wait for a retracement would be recommended.

