NAS100 BUY Trade ideiaNAS100 Long move trade ideia. Expecting to see trade reach this target.
Please move SL to BE once it hits 1-1RR.
NAS100 trade ideas

NAS100 - Stock Market, Waiting for FOMC?!The index is above the EMA200 and EMA50 on the 4-hour timeframe and is trading in its ascending channel. I expect corrective moves from the specified range, but if the index continues to move upwards towards 21,000 points, we can look for the next Nasdaq short positions with a risk-reward ratio.
Last week, U.S. equity markets experienced $8.9 billion in capital outflows, while equity markets in Japan and the European Union saw net inflows. Additionally, U.S. Treasury bonds recorded an outflow of $4.5 billion—the largest since December 2023. Meanwhile, the gold market witnessed its first weekly investment decline since January.
Looking ahead, financial markets are focused on the upcoming earnings reports from major companies across sectors such as technology, healthcare, automotive, energy, and financial services. These reports are expected to significantly influence equity trends, investment strategies, and corporate outlooks. Below is a daily breakdown of key companies set to release earnings this week:
Monday, May 5, 2025
The week starts with a focus on the healthcare and biotech sectors:
• Before market open: Companies such as Palantir, Ford, Onsemi, and Tyson Foods will report earnings. Palantir and Ford are particularly noteworthy for investors in the tech and auto sectors.
• After market close: Healthcare firms like Hims & Hers Health, Axsome Therapeutics, and financial company CNA Financial will report.
Tuesday, May 6, 2025
Tuesday highlights several key tech earnings:
• Before market open: Celsius, Datadog, Rivian, and Tempus will publish their results. Rivian’s report is especially anticipated due to the intense competition in the electric vehicle space.
• After market close: Tech giants like AMD and Arista Networks will release earnings, along with Marriott from the hospitality sector.
Wednesday, May 7, 2025
A packed day for earnings reports:
• Before market open: Reports from Uber and Teva are expected, along with ARM Holdings, a key player in semiconductors.
• After market close: AppLovin, Unity, and Robinhood will release their reports—representing digital gaming, software, and fintech respectively.
Thursday, May 8, 2025
This day centers on digital health, cryptocurrency, and e-commerce:
• Before market open: Peloton and Shopify will report. Shopify’s performance is particularly critical in the online retail sector.
• After market close: Crypto firm Coinbase and online sports betting platform DraftKings are in focus.
Friday, May 9, 2025
Fewer companies will report, but some are of strategic interest:
• Firms like 1stdibs, Ani Pharmaceuticals, and Embecta are scheduled, as well as Telos and Algonquin—key names in energy and cybersecurity investing.
This week, markets are closely monitoring Wednesday’s FOMC meeting. At the March session, the Fed left rates unchanged and signaled only two potential cuts totaling 50 basis points for the year, based on its dot plot—suggesting a cautious approach to monetary easing.
Simultaneously, April’s U.S. Services PMI is set to be released today, providing clearer insights into post-tariff business activity.
Amazon’s CEO stated that, so far, there is no indication of reduced demand due to tariff concerns. Some inventory spikes were noted in specific categories, likely driven by stockpiling ahead of tariff implementation. Retail prices, on average, have not significantly increased, and most sellers have yet to raise prices—though that could change depending on how tariff policies evolve. Notably, essential goods have grown at twice the rate of other categories and now account for a third of all unit sales in the U.S.
Following April’s jobs report, the likelihood of a Fed rate cut in June dropped from 75% to 42%. With only one more employment report due before the June 18 meeting, hopes for an early policy shift have faded. Some analysts argue that without the tariff conflict, the Fed might already be cutting rates, given the downward trend in inflation, steady growth, and Congressional focus on fiscal measures.
The April jobs data showed that the U.S. labor market remains resilient—neither too strong to spark inflation fears nor too weak to trigger panic. After the release, with market confidence rebounding, Goldman Sachs forecasted the Fed’s first rate cut to come at the July 30 meeting.
The consensus expectation is for the Fed funds rate to remain in the current 4.25%-4.5% range, unchanged since January. The CME FedWatch tool currently assigns just a 1.8% chance of a rate cut at the upcoming meeting.
Economists warn that Trump’s newly imposed tariffs—active since April—could drive up prices and hurt employment, challenging the Fed’s dual mandate of controlling both inflation and joblessness. However, recent data shows inflation remained mild in March and the labor market held steady in April.
Nancy Vanden Houten, Chief U.S. Economist at Oxford Economics, wrote: “The data is strong enough for the Fed to stay on the sidelines and monitor how tariffs influence inflation and expectations.” While hard data remains stable, forecasts and sentiment surveys signal looming challenges. Business leaders and individuals express concern that rising costs may burden consumers and businesses in the coming months or years, possibly even tipping the economy into recession.

Nasdaq The current structure has an imbalance so a collapse is expected from my side plus we have a bearish flag formed waiting breakout towards the lowest low of the structure

NAS100USD: Bearish Setup Builds as Price Retests Key Supply ZoneGreetings Traders,
In today’s analysis on NAS100USD, we continue to observe bearish institutional order flow, and as such, our objective is to align our trading opportunities with this directional bias.
Key Observations:
1. Bearish Break of Structure and Retracement:
Following a clear bearish break of structure, price has retraced into a mitigation block. This zone represents an area where institutional buying previously occurred. As price trades back into it, institutions often mitigate those earlier positions and reintroduce sell-side interest—offering us an opportunity to follow their lead.
2. Confluence at the Mitigation Block:
The mitigation block is further reinforced by the presence of a bearish order block, adding strength to the resistance zone. This alignment suggests the area may serve as a high-probability reversal point for bearish continuation.
Liquidity Sweep Scenario:
There remains a possibility that price may take out nearby buy-side liquidity (buy stops) before continuing downward. If this occurs, we will wait for confirmation before entering short positions, maintaining alignment with the overall bearish narrative.
Trading Plan:
Upon confirmation of rejection at the mitigation zone, we will seek to engage in short setups targeting liquidity pools in discount pricing zones.
Remain patient, disciplined, and ensure each trade aligns with your strategy.
Kind Regards,
The Architect

Nasdaq100 M30Last week NFP failed to push investors price high , while this our chance to hit the lows

NAS100 and the analysis that has reached a conclusion and has noToday I was reviewing my previous analyses when I came across this chart on NAS100 and after months of waiting, it had come to fruition.
It's a bit late to publish now, but I will gradually increase the number of symbols and arrange the time so that the results are available to everyone on time!!
Good luck!
MJ.REZAEI

Nasdaq-100 H4 | Falling toward a pullback supportThe Nasdaq-100 (NAS100) is falling towards a pullback support and could potentially bounce off this level to climb higher.
Buy entry is at 19,595.55 which is a pullback support.
Stop loss is at 18,900.00 which is a level that lies underneath an overlap support.
Take profit is at 20,343.35 which is a swing-high resistance.
High Risk Investment Warning
Trading Forex/CFDs on margin carries a high level of risk and may not be suitable for all investors. Leverage can work against you.
Stratos Markets Limited (tradu.com):
CFDs are complex instruments and come with a high risk of losing money rapidly due to leverage. 63% of retail investor accounts lose money when trading CFDs with this provider. You should consider whether you understand how CFDs work and whether you can afford to take the high risk of losing your money.
Stratos Europe Ltd (tradu.com):
CFDs are complex instruments and come with a high risk of losing money rapidly due to leverage. 63% of retail investor accounts lose money when trading CFDs with this provider. You should consider whether you understand how CFDs work and whether you can afford to take the high risk of losing your money.
Stratos Global LLC (tradu.com):
Losses can exceed deposits.
Please be advised that the information presented on TradingView is provided to Tradu (‘Company’, ‘we’) by a third-party provider (‘TFA Global Pte Ltd’). Please be reminded that you are solely responsible for the trading decisions on your account. There is a very high degree of risk involved in trading. Any information and/or content is intended entirely for research, educational and informational purposes only and does not constitute investment or consultation advice or investment strategy. The information is not tailored to the investment needs of any specific person and therefore does not involve a consideration of any of the investment objectives, financial situation or needs of any viewer that may receive it. Kindly also note that past performance is not a reliable indicator of future results. Actual results may differ materially from those anticipated in forward-looking or past performance statements. We assume no liability as to the accuracy or completeness of any of the information and/or content provided herein and the Company cannot be held responsible for any omission, mistake nor for any loss or damage including without limitation to any loss of profit which may arise from reliance on any information supplied by TFA Global Pte Ltd.
The speaker(s) is neither an employee, agent nor representative of Tradu and is therefore acting independently. The opinions given are their own, constitute general market commentary, and do not constitute the opinion or advice of Tradu or any form of personal or investment advice. Tradu neither endorses nor guarantees offerings of third-party speakers, nor is Tradu responsible for the content, veracity or opinions of third-party speakers, presenters or participants.

NAS100 Rejected at Key Supply Zone | Pullback in Play?The NASDAQ 100 (NAS100) just tapped into a strong supply zone around 20,000 – 20,100 and is showing signs of rejection. Price is currently at 20,007, down -0.45%, and struggling to hold above the demand turned resistance.
Chart Highlights:
Supply Zone: 20,000 – 20,100 (visible rejection area).
Key Support Levels:
19,852 – immediate structure level.
18,846 – breakout origin, potential demand zone.
17,673 – major volume and demand cluster (orange zone).
Bearish Bias:
If price loses 19,852, we could see a drop toward 18,846.
Failure there opens the path for a deeper correction to 17,673, where buyers are likely to step in.
Bullish Trigger:
A clean break and close above 20,100 would flip the script and suggest continuation of the bullish rally.
Volatility Warning:
Upcoming U.S. economic data could cause sharp moves (see calendar icon on chart). Be cautious and reactive.
Trade Setup: Watch for short opportunities below 19,852 with stops above supply and targets near the marked supports.
---
Is NAS100 gearing up for a dip or breaking out soon? Drop your forecast in the comments!
#NAS100 #NASDAQ #TechnicalAnalysis #SupplyAndDemand #VolumeProfile #LuxAlgo #PriceAction #IndicesTrading #USMarket #ForexSignals #SmartMoney

Technical Breakdown on US 100 | 1H TimeframeTechnical Breakdown on US100 1H Chart using Volume Profile, Gann, and CVD + ADX
1. Key Observations (Volume, Gann & CVD + ADX Focused)
a) Volume Profile Insights:
Value Area High (VAH): 20,035 (approx. from most recent high-volume node)
Value Area Low (VAL): 19,710
Point of Control (POC):
High-Volume Nodes: Clustered between 19,850 – 20,050 (heavy volume activity)
Low-Volume Gaps: Between 19,700 – 19,800 (could act as fast move zones)
b) Liquidity Zones:
Liquidity Pools:
Order Absorption: Observed near 19,850 (buy side absorption with wicks and CVD reaction)
c) Volume-Based Swing Highs/Lows:
Swing High: 20,035 with volume tapering and price exhaustion
Swing Low: 19,710 showing high delta rebound and large wick
d) CVD + ADX Indicator Analysis:
Trend Direction: Uptrend (price making HH/HL, supported by rising channel)
ADX Strength: ADX > 20, DI+ > DI- → Confirmed bullish trend
CVD Confirmation:
2. Support & Resistance Levels
a) Volume-Based Levels:
Support:
Resistance:
b) Gann-Based Levels:
Recent Swing Low: 19,710 (1/3 retracement zone)
Key Retracement Levels:
3. Chart Patterns & Market Structure
a) Trend: Bullish (confirmed by ADX > 20 and CVD rising)
b) Notable Patterns:
Bullish Ascending Channel clearly forming with higher lows
Price pulled back to mid-channel + POC confluence, showing signs of retest and continuation
No major bearish reversal patterns yet; healthy pullback structure
4. Trade Setup & Risk Management
a) Bullish Entry (CVD + ADX confirm uptrend):
Entry Zone: 19,850–19,875 (POC retest + trendline support)
Targets:
Stop-Loss (SL): 19,700 (below VAL and swing low)
RR: ~1:2.5
b) Bearish Entry (Only on breakdown):
Entry Zone: Below 19,700 (VAL loss + CVD breakdown)
Target: T1: 19,422.18 (previous POC support)
Stop-Loss (SL): 19,860 (back above trendline/POC)
RR: ~1:2
c) Position Sizing:
Risk only 1-2% of capital per trade for controlled exposure

Nas100 Buy Looking at the w1 chart we can spot out a strong pullback momentum which gave D1 TF a bullish bias and now on h4 price look to pullback towards an AOI for a bullish continuation. Fingers crossed

Nasdaq Pending Short: previous wave 4 as resistance This idea is complementary to the S&P500 pending short idea. I've labelled the waves slightly differently but it doesn't impact the forecast for it's still the same expectation of a last wave. I purposely left it as a different count as comparison.
I would start building a short position around 20300. Stop above purple Fibonacci extension level.

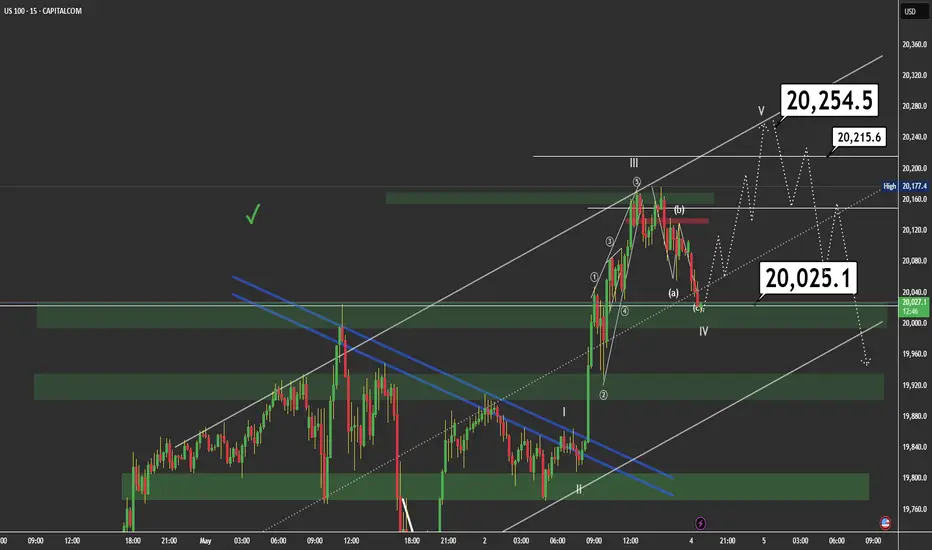
Wave V in PlayThe market appears to have completed a corrective wave IV, forming an ABC structure that tapped into the key demand zone around 20,025.1. This zone aligns with previous structure support, the lower boundary of the ascending channel, and a critical trendline.
🔍 Likely scenario:
If price holds above this level, we could be witnessing the beginning of wave V, with potential targets near 20,254.5.
Wave V is expected to unfold in 5 smaller internal waves and may extend further if price breaks through the mid-channel resistance.
🚨 🔺 CRUCIAL LEVEL TO WATCH: The 20,215 area is extremely important. Price reaction here will be decisive:
A strong rejection could signal a truncated wave V or the start of a deeper correction.
A clean breakout would confirm bullish continuation toward 20,254.5 and beyond.
🟢 Key Zones:
📌 Demand: 20,025 – 20,000
📌 Critical Resistance: 20,215
📌 Wave V Target: 20,254.5
📌 Invalidation level: A drop below 19,975 would invalidate the current bullish count.
📌 Trade Plan:
Look for bullish confirmation at 20,025 to consider long setups.
Watch 20,215 closely for signs of strength or rejection. If price breaks above it with momentum, continuation is likely.
NASDAQ SELL?This is just a rough idea, I still need to wait and see where the market moves to and rejects from in order for TP and SL placement.
But, there is a Asian high, a London high and a NY high sitting closely together, causing what I call a liquidity pool, and we all know that liquidity moves the market. its like a magnet for the market.
so I'll be waiting and watching to see which session is swept and how the market reacts. But all in all, this is what i personally think Nasdaq will do
what are your thoughts? I would love to hear them.
I hope you all have a fantastic week and you rake in those profits.
God bless
J.D.L

NQ: Upcoming Weekly Analysis!FA Analysis:
1- Macro economic Indicators: Most data came red and few were inline confirming the slowing down of the economy.
2- Inflation data came better than expected.
3- Trump Tariffs: Strong rumors about deals underway from this week. The 90-day pause will become an indeterminate pause.
4- We have the FED this week. Nothing in terms of immediate rate cut, but the conference is very important for the looking forward.
5-ISM Services data is important.
From FA perspective, market is focusing on Tariffs deals. If it materializes, the ST outlook will change from Sell to Buy. MT and LT Outlook will stay Sell.
TA Analysis:
Weekly TF:
The weekly close was bullish and price retraced more than 61.8. This could be the end of this wave.
The FED and/or the tariff deals will give the signal for either the start of wave 3 or a continuation up. Until then, a consolidation is expected.
Daily TF:
Same as weekly... a bullish daily close. A consolidation is expected until the FED.
Happy and green week to Everyone!

Bearish reversal off overlap resistance?USTEC is rising towards the pivot and could reverse to the 1st support.
Pivot: 20,418.65
1st Support: 19,265.30
1st Resistance: 21,137.24
Risk Warning:
Trading Forex and CFDs carries a high level of risk to your capital and you should only trade with money you can afford to lose. Trading Forex and CFDs may not be suitable for all investors, so please ensure that you fully understand the risks involved and seek independent advice if necessary.
Disclaimer:
The above opinions given constitute general market commentary, and do not constitute the opinion or advice of IC Markets or any form of personal or investment advice.
Any opinions, news, research, analyses, prices, other information, or links to third-party sites contained on this website are provided on an "as-is" basis, are intended only to be informative, is not an advice nor a recommendation, nor research, or a record of our trading prices, or an offer of, or solicitation for a transaction in any financial instrument and thus should not be treated as such. The information provided does not involve any specific investment objectives, financial situation and needs of any specific person who may receive it. Please be aware, that past performance is not a reliable indicator of future performance and/or results. Past Performance or Forward-looking scenarios based upon the reasonable beliefs of the third-party provider are not a guarantee of future performance. Actual results may differ materially from those anticipated in forward-looking or past performance statements. IC Markets makes no representation or warranty and assumes no liability as to the accuracy or completeness of the information provided, nor any loss arising from any investment based on a recommendation, forecast or any information supplied by any third-party.

NAS100: Back in Beast Mode? Channel Top in SightThe NAS100 has stormed back into bullish territory, carving out a clean upward channel. If momentum holds, we could see price test the top again—setting up a textbook double or triple top. Here's what to watch and where this might stall.

NASDAQ YEARLY CHART Chart done on 03.05.2025
Nasdaq market conditions are very similar to the 2020 market conditions
as we can see for both years we had a drop in market price for the first few month, then the recovery happened as markets started to stabilize.
this looks to be the same with 2025 as trumps appointment into the white house has caused a similar effect
for the next year nasdaq looks to be bullish so that the US economy can adapt to the new changes.
this is a very basic analysis. if a more in depth analysis is needed. Please feel free to comment

US100 Locking as Bullish directionUS00 Structure Looking as strong Bullish Pattern,
Forecast from Mr Martin Date 02 May 2025,
US100 Price will looking as buy side recently price will break and catch the support after push to buy side the bullish structure continue to play out the next project would be a clean rally toward the top of the channel US100 is holding its bullish structure well,
Key Level to watch
Resistance level 20,500 / 21,000
Support Levels 19,500
you can find more details in the chart of you find this idea help or learned something new then leave comments Thanks for Regarding.

A daily bias for 2025 Find the range of the day which has the protected high's and protected low's looks for contuniation or liquidity grab and small time trame determine if a CSID or continuation form Is taking place

US100 / NASDAQ#US100 BEST PLACE TO SELL FROM|SHORT🔴
📉US100 SIGNAL
✔️Trade Direction: short
✔️Entry Level: 20,101.6
✔️Target Level: 18,779.9
✔️Stop Loss: 20,975.6
📊RISK PROFILE
⭐️Risk level: medium
⭐️Suggested risk: 1%
⭐️Timeframe: 1D
——————

Approaching 200SMA and long-term uptrend line, pullback expected(The following is a personal opinion and not investment advice. Please exercise independent judgment before making any decisions.)
Last week, the market remained in a consolidation phase near recent highs. The current price has broken through and is approaching the 200-day moving average, while also nearing a retest of the uptrend line that began in 2023. Considering the price has been on a 9-day upward streak, there is a high probability of a significant pullback upon reaching these key resistance levels.
At present, it is difficult to categorize the overall market trend as either bullish or bearish. With ongoing uncertainty around tariff-related policies, the market appears to be in a consolidation phase rather than a sustained uptrend, lacking fundamental support for further rallies. As such, there is a higher probability that the price will fill the lower gap at 18,264.
Next week, special attention should be given to the FOMC rate decision and the press conference on Wednesday. Recent employment data has been strong, and inflation has shown signs of rising. The Fed is expected to maintain its current stance, which could trigger a market sell off. It's also possible the pullback may begin as early as Monday or Tuesday, offering opportunities for early positioning.
From a technical perspective, if the price continues to rise, it may test the area around the 200-day moving average and previous trend resistance, roughly between 20,226 and 20,400. Should this area be tested early in the week (Monday or Tuesday), I would consider initiating short positions. Light positions can be considered above the 20,000 level, as the current price range offers a relatively favorable risk-to-reward.
To the downside, a break below the 19,000 level is required first, after which there's a higher probability of filling the price gap between 18,264 and 18,583. If supported by macro news, the market may further test lower levels in the coming weeks, including 17,589, 17,278–16,946, and potentially 16,108–16,589. These levels will require further observation as developments unfold.

US100 BEST PLACE TO SELL FROM|SHORT
US100 SIGNAL
Trade Direction: short
Entry Level: 20,101.6
Target Level: 18,779.9
Stop Loss: 20,975.6
RISK PROFILE
Risk level: medium
Suggested risk: 1%
Timeframe: 12h
Disclosure: I am part of Trade Nation's Influencer program and receive a monthly fee for using their TradingView charts in my analysis.
✅LIKE AND COMMENT MY IDEAS✅

NAS100 1WTake a look at this chart! After a solid uptrend, the price broke an important ascending trendline and corrected down to the 0.5 Fibonacci level — right where a key structural support zone is (that blue area near the bottom).
From there, we’ve seen a strong bounce back upward, and now the price has reached a critical zone:
Previous resistance
The 0.618 to 0.786 Fibonacci retracement area
And most importantly, a retest (pullback) to the broken trendline
There are two possible scenarios ahead:
1. If the price breaks and holds above this resistance zone, we might see the continuation of the bullish move.
2. But if it fails to break through, the market could enter another corrective phase.
Also, keep in mind that we have the interest rate decision this week. With Trump applying repeated pressure, there’s a chance rates might be cut — which could fuel a green, bullish market.
