US100 - Perfect Long Opportunities Unfolding?This chart illustrates a high-probability bullish setup based on a combination of market structure shifts, fair value gaps (FVGs), Fibonacci retracement confluence, and order block interaction. We are analyzing the US Tech 100 on the 1-hour timeframe, focusing on recent price action development and a potential reversal scenario forming after a corrective move.
Context and Market Structure:
Price action has been in a corrective downtrend after printing a local high near the 19,950–20,000 range. This move led to a break in short-term bullish structure as sell-side liquidity was swept. A series of bearish candles followed, confirming a shift in momentum to the downside.
However, the retracement stalled upon entering a prior area of imbalance—highlighted here as a larger fair value gap (FVG) zone. This FVG zone acted as a significant demand area, with price reacting strongly upon entry. The zone is marked with a light blue shaded rectangle and aligns with a 1-hour bullish order block.
Price created a swing low in this FVG area before forming higher lows, suggesting the possibility of a short-term reversal.
Golden Pocket & Liquidity Sweep:
A key zone of interest is the "Golden Pocket downtrend" area, which is derived from the 0.618–0.65 Fibonacci retracement levels of the last impulse down. Price previously respected this zone, leading to a rejection and continuation lower. This makes it a notable supply area. Price may revisit this zone as a target or potential reaction point on the next bullish leg.
Note how the initial reaction from the FVG brought the market back into a smaller 1H FVG, situated just beneath the 0.5 retracement level. The internal structure within this zone supports a bullish outlook due to the formation of a higher low followed by a bullish engulfing candle.
Fibonacci Confluence & Execution Levels:
The 0.618 Fibonacci retracement level of the recent move aligns closely with the midpoint of the bullish FVG, providing confluence for a potential re-entry or continuation point. This level is annotated on the chart and highlighted with a horizontal line labeled "0.618 - Entry." This suggests it may act as a magnet for price before further continuation to the upside.
The 0.786 retracement level, also plotted on the chart, indicates the deeper end of the retracement spectrum and lies just above a major structural low. This region, though aggressive, would represent a final line of defense for bullish continuation.
Projection and Price Path:
Based on the current structure and bullish reaction from the FVG zone, a potential price path is drawn on the chart. It suggests one more liquidity grab into the FVG area followed by an impulsive move to the upside.
The blue projection line outlines a potential retracement to fill the nearby FVG (which remains partially unmitigated), followed by a resumption of bullish momentum that targets a revisit to the previous high area around 19,875.
Additional Notes:
* Multiple FVGs are actively interacting in this region, giving layered confluence for demand zones.
* The reaction from the FVG zone is coupled with a bullish engulfing pattern on the 1-hour timeframe, signaling aggressive buying.
* Price remains above the internal bullish structure despite the earlier rejection from the Golden Pocket area.
Conclusion:
The chart setup represents a textbook example of FVG demand zone reaction, supported by Fibonacci confluence and market structure shifts. As price consolidates above this key FVG, a continuation to the upside becomes a strong probability if the internal structure remains intact. Traders should monitor price behavior on lower timeframes as it interacts with the 0.618 and FVG zones for confirmation of bullish continuation.
NAS100 trade ideas

US100 – Bullish Continuation Setting Up Inside the ChannelUS100 remains firmly bullish, showing consistent strength after breaking out from the prior consolidation range in mid-April. Price action has been moving cleanly within a well-defined ascending channel, supported by strong impulsive moves followed by shallow retracements. Each pullback so far has been relatively controlled, and buyers have been stepping in aggressively from clearly defined zones, which aligns with the current risk-on sentiment across tech-heavy indices.
Consolidation Structure
We’ve now had two solid retests of prior fair value gaps (FVGs), both of which acted as demand zones and helped fuel continuation. The first pullback dropped into a previously formed imbalance, consolidated briefly, and then launched a strong bullish leg. The second did the same, creating a layered structure of bullish continuation through efficient retracements. Each of these reactions confirms that price is respecting areas where institutional orders may have been left behind, which adds confluence to the trend’s strength.
Currently, price is working on forming a third FVG within the upper half of the channel. This is developing just below recent highs and has not yet been retested, which makes it a key area of interest. If the market pulls back into that imbalance with proper structure, it could offer the next high-probability opportunity to join the trend.
Bullish Scenario
If price retraces into this newly forming FVG and holds, especially with a wick or lower timeframe rejection candle inside the zone, it could mark the start of the next impulse. The overall trend remains intact as long as we stay within the channel and each FVG continues to serve as valid support. Given the strength of the previous bounces and the orderly nature of this structure, any retest into this new FVG would likely lead to another push into fresh highs and a move toward the upper boundary of the channel.
Bearish Scenario
On the flip side, if price fails to respect this new FVG and breaks below with momentum, especially if the channel support fails at the same time, it would be a sign that buyers are losing control. In that case, we’d want to see how price interacts with the last confirmed FVG below before making any bearish assumptions. A deeper pullback into that area could still provide another long opportunity if structure holds, but any sharp momentum break through both imbalances would put the bullish trend on pause and shift focus to downside levels.
Price Target and Expectations
Assuming the bullish structure continues to play out, the next projected move would be a clean rally toward the top of the channel. There’s enough space left between current levels and the upper trendline to justify an entry on the next pullback, provided it lands inside the newly created FVG. The setup is fairly straightforward, let price come back into the imbalance, confirm with lower timeframe strength, and ride the continuation leg.
Current Stance
There’s no need to chase price here. The best scenario is waiting for a patient retest of the fresh FVG forming now. If it pulls back cleanly, holds the zone, and gives confirmation, that would be the entry. Momentum, structure, and market context are all aligned for continuation, but the trade needs to be built off a level that shows actual commitment from buyers.
Conclusion
US100 is holding its bullish structure well, forming clean legs within an ascending channel, and repeatedly respecting fair value gaps as demand zones. With a new imbalance forming beneath the most recent high, the setup is shaping up for another continuation play if price rotates back and holds. It’s a wait-and-see moment for now, but if the FVG gets tagged and buyers show up, this could be the next leg higher in an already strong trend.
___________________________________
Thanks for your support!
If you found this idea helpful or learned something new, drop a like 👍 and leave a comment, I’d love to hear your thoughts! 🚀
Make sure to follow me for more price action insights, free indicators, and trading strategies. Let’s grow and trade smarter together! 📈

Long-term bearish to 14kJust adding to the idea previously posted:
A black upward trendline shows a strong bullish trend from mid-2022 through early 2025. Recently, there’s been a significant breakdown below this trendline, which signals a substantial change in trend from bullish to bearish. On Friday, we tested and rejected this trendline, which at the same time tested a 65% (golden pocket) retracement of the recent move, indicating a possible resistance area after a strong rebound.
I expect the price not to break this level any further.
The target remains 14k and below.

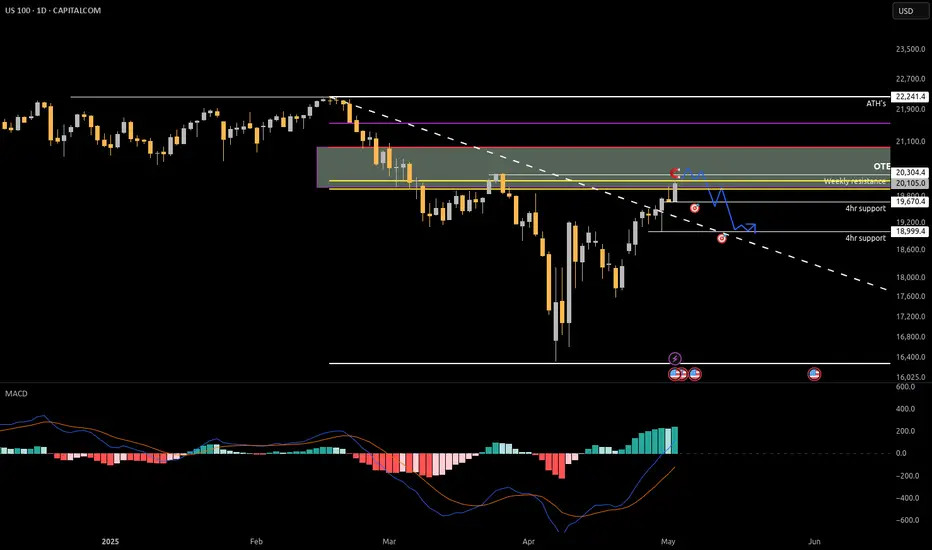
Short idea Us100, sweep of weekly resistancePrice is nearing the weekly resistance after extremely bullish price, expecting price to start stalling next week as it pushes in to the golden pocket zone where we'll see a move down and some higher lows lock in.
Ill be looking for a short entry on a low volume move up on the 5 minute time frame after we've taken the external liquidity above the weekly resistance level
Don't let the Recession paralysed you !!!!Read these few articles here , here and here
If you buy into any of the above articles as the gospel truth, you may freak out and starts to sell your holdings in US as some gurus advised you to do so. Take a step back and asked - WHY ?
Is the content creator saying this out of your interests or his ? Remember, positive news seldom receive likes and sharing but negative on the other hand will receive more. That is why it is easier to spell doom, gloom and boom and have lots of people liking it !
Of the 3 main indices, the Tech stocks have already gotten out of the woods as it has been up more than 20% from the bottom. SPX and DJA are still playing catch up. Due to the tariffs, many goods produced in US and are sold in China are now seeing dwindling sales. Patriotism or "guo chao" in Chinese is the anti-US sentiments that is now hot in China. That means the locals will rather buy Anta or Li Ning sports shoes over Nike or Adidas. Same for cosmetics!
There are some technical chartists or analysts saying this is a dead cat bounce and once the price hit the support line (in purple), it will continue to sell down. Yes, it is possible though I think it is less probable.
6 months down the road when we look back and IF I am lucky and predicted correctly, there will be many people who will kick themselves for missing a nice bottom buy on 9th April (thanks to Donald Trump who tweeted it).
Timing the market is TOUGH as I had learnt my lessons . WB , the legendary guru is right - be in the market meaning invest in the market for the long haul in fundamentally strong companies with economic moat and strong cash flows, etc will reap better returns.
As usual, please DYODD

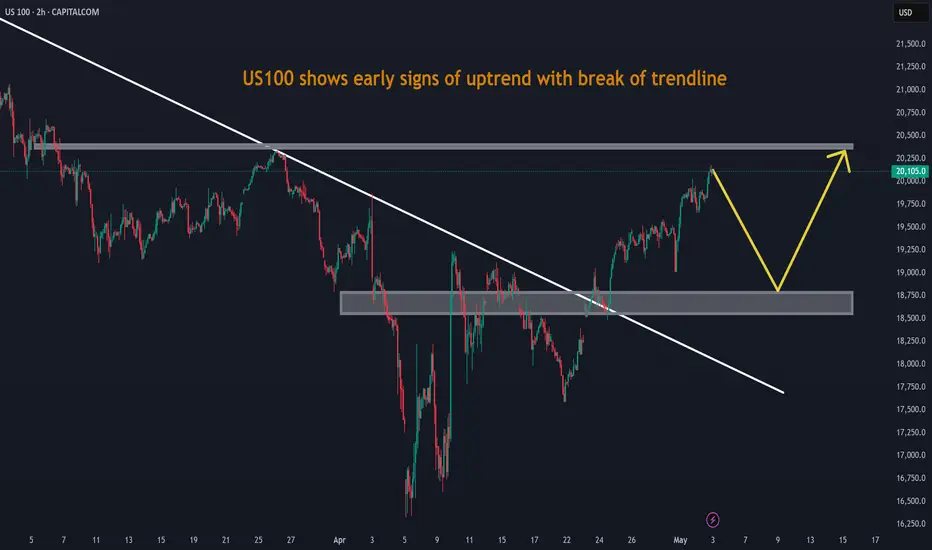
US100 shows early signs of uptrend with break of trendlineUS100 shows early signs of uptrend with break of trendline. It may retrace before upward momentum.
Technical and digital analysisWe notice that we are in an upward correction and there is an increase in momentum. We are waiting for sellers to weaken in order to buy

Next up Nasdaq = US100 buy continues.if the correction wave ended at 0.5 fibo level which is current dip next target is new high. in shorter time timezones first targets are 19900 - 20250 - 22300

Nasdaq 100 - Bull trap print begins circa April 30thThe Nasdaq 100 index is seriously oversold as market participants are gripped by fear. Understandable… however, markets do not crash in fear. Instead the opposite happens, counterintuitive as that sounds.
The Index shall continue display volatility until sellers are exhausted, which is around April 30th when the bottom shall print. So yeah, this week is probably going to suck what life remains of your account. However selling now is not in your best interest, I would argue the opposite. Let me explain why.
On the above daily chart the Nasdaq 100 death cross approaches, forecast to print on April 30th (the dotted lines). The death cross (On the Nasdaq 100 only) is defined as the 65 day Simple Moving average (blue line) crossing down the 240-day SMA with price action under the 240-day SMA.
Now the date has been changing a lot with recent volatility, to counter that behaviour the forecast for the cross uses the "Box Jenkins" forecast method (Ww is a data scientist and engineer specialising in probability theory and stochastic processes, will be adding the tool to my collection of scripts shortly!). Read more about Box Jenkins method here:
www.investopedia.com
Now I’m not normally a fan of moving averages, but on "looking left"… you’ll find me on the front row seat. I tell you all that to tell you this, look left. Look left at past death crosses using this method:
17% rally from death cross on March 15th, 2022
22% rally from death cross on December 18th, 2018
17% rally from death cross on February 16th, 2016
You get the picture. This behaviour continues to repeat with the previous ten death crosses until the print on October 12th, 2000, where the bull trap was followed by a market crash of 80%.
In terms of probability there is a 90% chance the death cross shall result in a positive rally. However, it is my guess many readers will place more weight on the 10% chance of a crash. That’s emotion, not reason! In fact if you scan over many of the published ideas on tradingview you'll notice the bearish slant is strong.
Is this time is different?
=====================
There are no certainties, only probabilities. Price action could continue selling off following the cross to reach new lows. That said, this idea is to forecast a bull trap, not a continuation in the market uptrend. The probability favouring a rally is incredibly high. After that, not so good. Not good at all.
Price action forecast on rally
=======================
Approximately 19.2 to 19.5k
Conclusions
=====================
The market is oversold as emotions run high. History tells us It is unlikely the correction ramps up in momentum after the cross prints. However the cross can indicate the index may be about to enter a bear market should price action reject the 50-day SMA, which it is very likely. That’s for the next post!
Ww

next week or two weeks NQ vision as u see in the chart nothing special we need to reach the first high Buyside LQ
then pull back to the last low as second target sellside LQ
note that
any question feel free

NASDAQ: 50% probability that this Golden Cross is bearish.Nasdaq is bullish on its 1D technical outlook (RSI = 60.920, MACD = 61.810, ADX = 33.031) as it continues its recovery from the Low of the previous month. In the meantime, it formed a 4H Golden Cross, the first since January 23rd. Even though this is a bullish pattern theoretically, it often doesn't deliver an immediate rise. More specifically, since the October 2022 market bottom, Nasdaq has had another 10 Golden Crosses on the 4H timeframe. The interesting statistic is that 5 have extended their rallies but the other 5 cuased a pullback (short or medium term). Consequently we call for caution in the next 2 weeks, as the market may correct towards the 4H MA200 before it resumes the long term uptrend.
## If you like our free content follow our profile to get more daily ideas. ##
## Comments and likes are greatly appreciated. ##

X2: NQ/US100/NAS100 Long - Day Trades 1:2X2:
Risking 1% to make 2%
NAS100, US100, NQ, NASDAQ Long for day trade, with my back testing of this strategy, it hits multiple possible take profits, manage your position accordingly.
Risking 1% to make 2%
Use proper risk management
Looks like good trade.
Lets monitor.
Use proper risk management.
Disclaimer: only idea, not advice
Nasdaq LongsThe setup is self explanatory. If price is to retrace to the marked levels I will take longs, The details are in the charts...If price does not retrace, I will improvise

Nasdaq LongsShould price retrace to that IFVG level, I will look for a sell side liquidity sweep and go long.

Descending Triangle Formation with Bullish Breakout Potential The NASDAQ (US100) is currently forming a descending triangle pattern with a clear A-B-C-D-E wave structure, signaling price compression and consolidation.
🔍 Key Insights:
The previous move was strongly bullish, increasing the probability of a continuation after consolidation.
A potential breakout above the descending trendline (blue resistance) could trigger a sharp upward move.
Target zones:
✅ First target: 20,060.6
✅ Second target: 20,573.9
Key support zone: 19,524.7 – this area acted as a launchpad for the previous bullish impulse and confirms the base of the triangle.
🧠 Suggested Strategy:
Wait for a confirmed breakout with volume. Look for entries on a pullback toward the 19,811.1 zone – ideally with a bullish continuation candle.
📊 Additional Context:
These types of consolidation patterns often lead to explosive moves. Patience and risk management will be crucial here.

NQ: NFP day!Good day!
Yesterday candle was bearish, Is it the end of the upper move?
All will depend on today's data and rumors from WH.
1- Undershoot data: Very bad for equities and NQ starts its Wave 3. But keep in mind, an undershoot also means FED will cut and free money will be on the table which is positive equities.
2- Inline: Bad for equities as FED rate cut and free money chances will decrease. In this case, price might continue its consolidation.
3- Overshoot: Good for equities and NQ might reach 21000. In this scenario, Fed rate cut will be out from June meeting.
Regarding WH rumors, it seems tariffs deals are imminent or underway. I already mentioned here few times that the 90-day pause will become an eternity pause. This seems a major change. But in my view it won't be a sustainable or durable change as all countries lost confidence in US.
Until the rumor becomes a fact, I maintain the same plan for ST/MT/LT: Sell.
GL!
