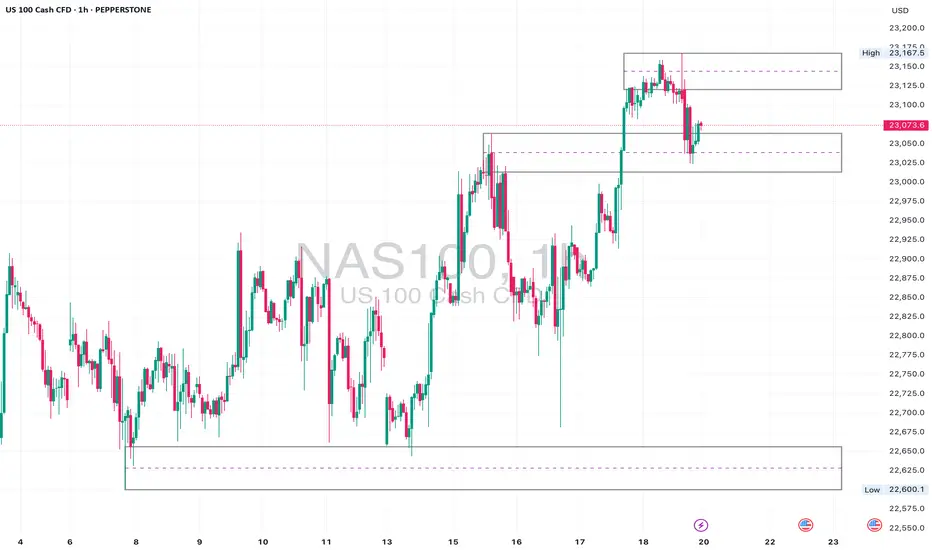
A very ambitious LONG I have entered LONG on nas100 once it retested the break of the double top.
No BS, just a simple trade... no spider webs on the screen, no crazy, imaginary strategy..
NAS100 trade ideas
Nas100• Daily: Price is nearing the upper boundary of a rising wedge pattern — showing signs of overextension.
• 4H: Strong bullish structure with clean breaks and retests of minor consolidation ranges.
• 1H: Small range developing after recent high. A deeper pullback to 22,960–22,880 would offer a cleaner entry for continuation.
⚠️ Watch For:
• Wedge resistance on the daily chart.
• Bullish continuation only valid above 23,040.
• If we break below the 4H support zone (around 22,880), short-term pullbacks are likely.
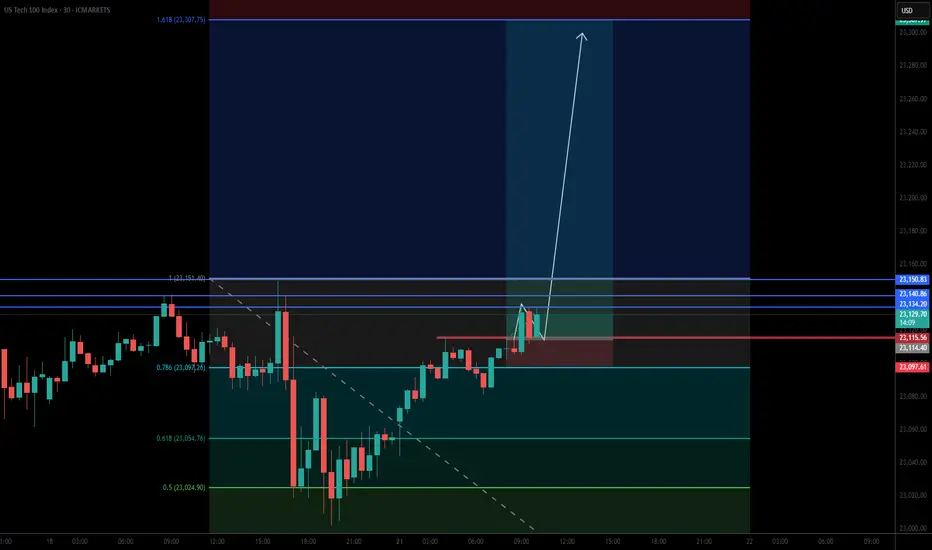
7/21/25 ((NAS100)) analysisPrice is definitely going up
may come down to quickly tap the daily FVG first
perhaps in the beginning of the week
---Monday/Tuesday style but not married to that Idea
could also come back to hit that volume weekly line thing
I just decided to implement lol who knows
anyways I plan to be in BUYS all week long BABYYY

Nasdaq Long 7.17.25At 9 AM, price bounced off of the PD high which signified that price wanted to distribute above the current week high, old day high. I entered at 10 AM off the 9 AM candle. Awesome trade and execution.

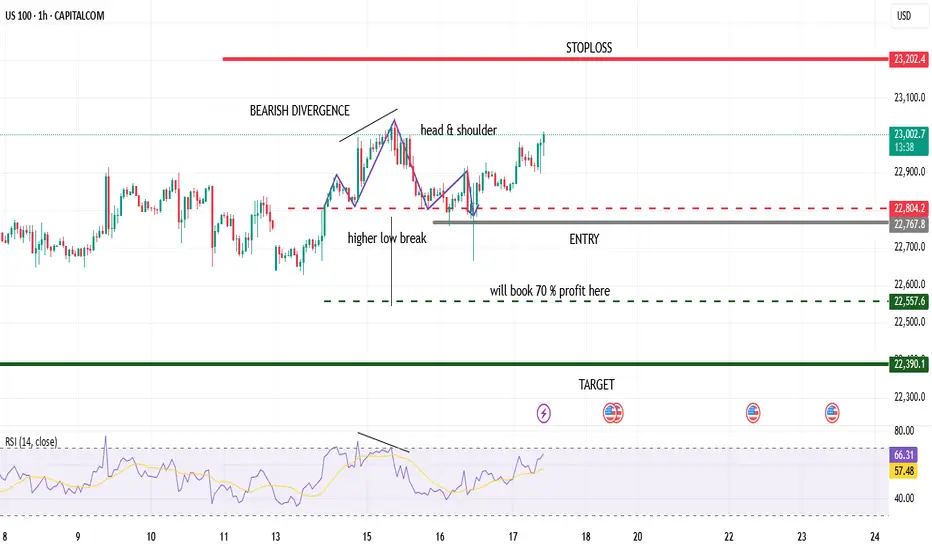
US 100 ShortUS 100 short
1st us100 formed bearish divergence
then break last higher low
also formed bearish head & shoulder
DXY index is bullish it also indicates for bearish stock
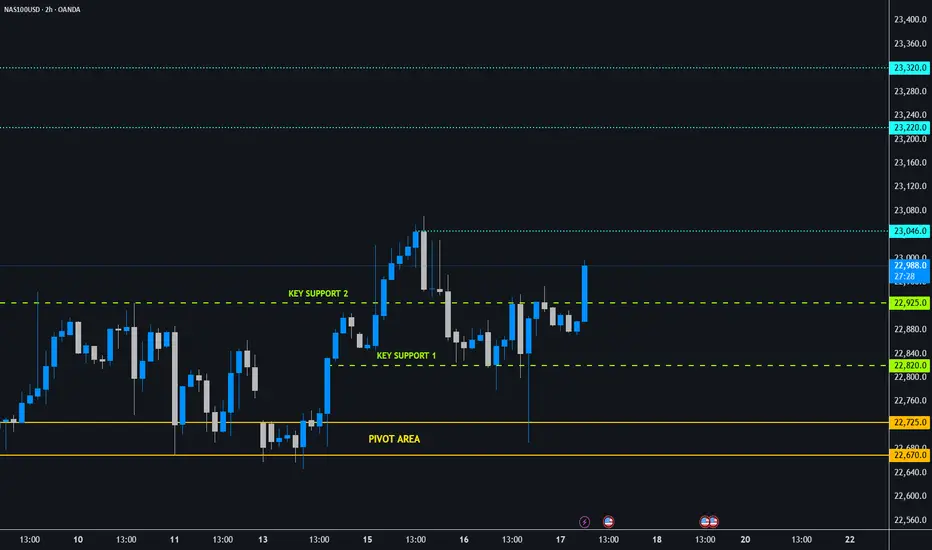
NAS100 - Follow Progress 3Dear Friends in Trading,
How I see it,
Remember:
"NASDAQ IS IN EXTREME GREED/OVERBOUGHT TERRITORY"
1) NASDAQ formed new key support/demand levels post CPI + PPI
2) Price needs to stabilize above 23046 next.
3) As long as both key support levels hold, the potential for more
bull runs remains high.
I sincerely hope my point of view offers a valued insight.
Thank you for taking the time to study my analysis.

BuyRejection Level
Daily Volume
Market Structure Shift
London Session
Trend Line Break
Untapped Order Point
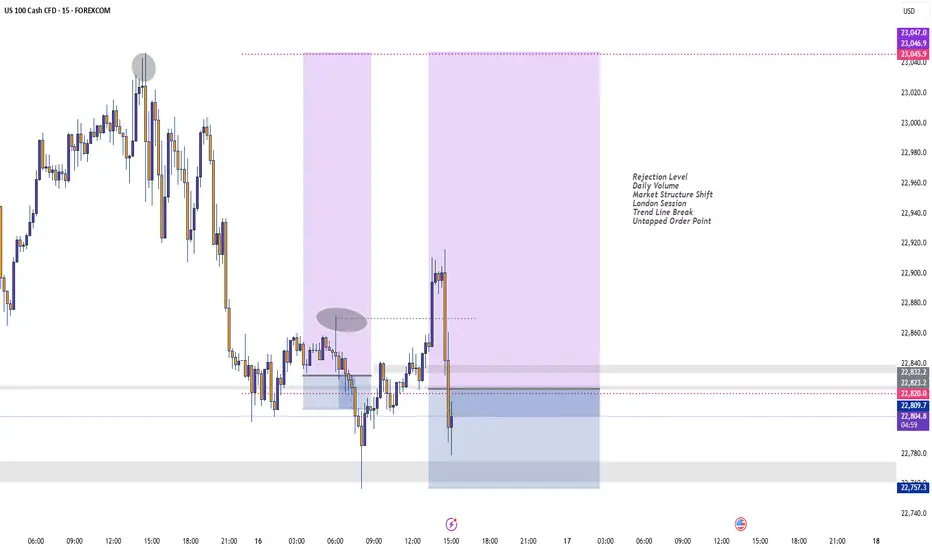
BuyRejection Level
Daily Volume
Market Structure Shift
US Session
Trend Line Break
Untapped Order Point

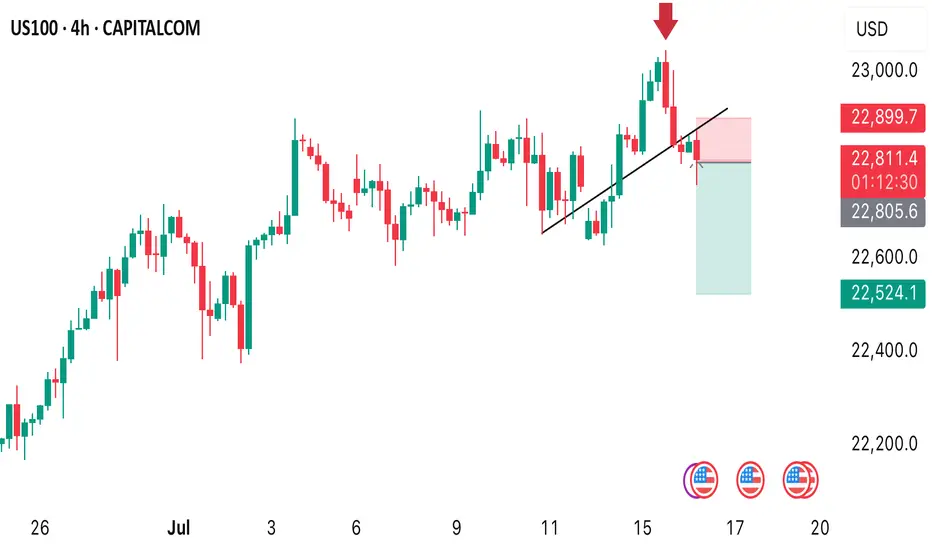
US100 SELL OPPORTUNITY A sell opportunity is envisaged as price dropped from the ALL TIME HIGH of 23000. I am shorting it with my target placed at 22524
Take advantage of this opportunity
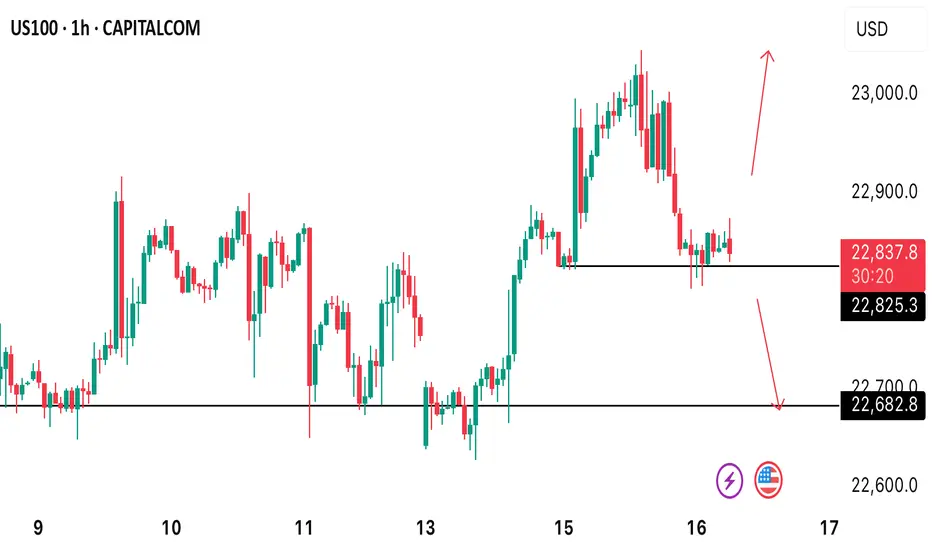
US100 H1 TECHNICAL ANALYSIS.US100 currently trades at 22830 what’s the next potential move on this asset? A reversal to 23024 high or a further decline to 22680. Let’s watch out and see how price reacts at that level.
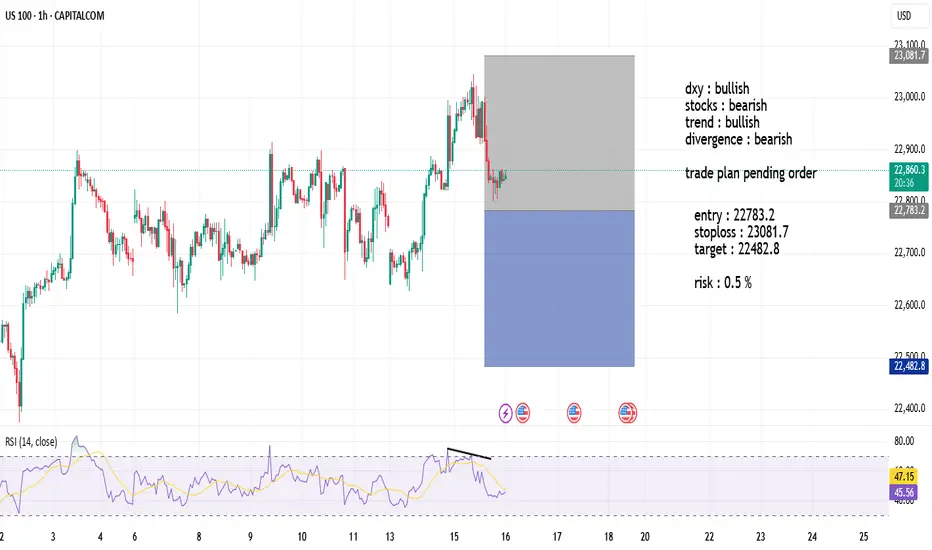
US100 SHORT dxy : bullish
stocks : bearish
trend : bullish
divergence : bearish
trade plan pending order
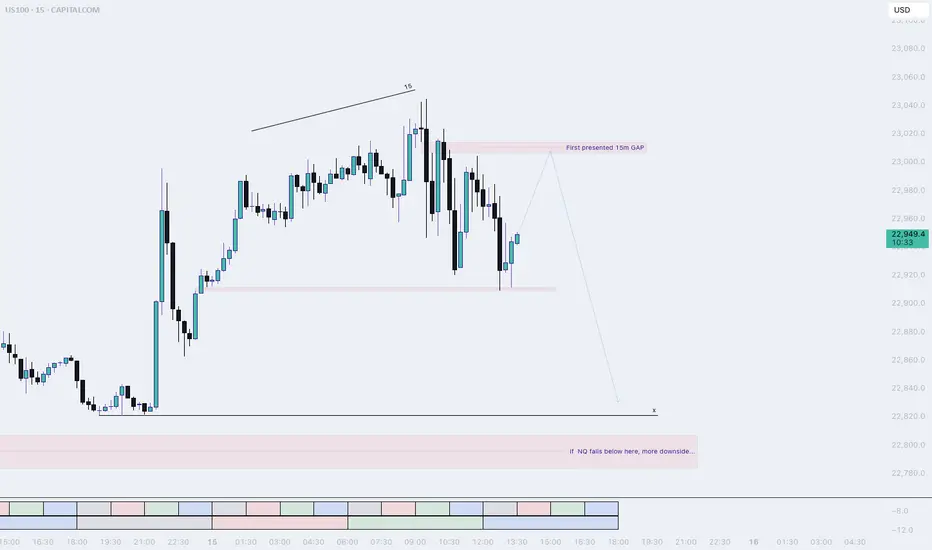
NQ, PM session (Tuesday) (long into short idea)Most likely price will make one more pullback before dropping into sell-side liquidity.
The laggish price action tells us that NQ is not really done IMO. I think a retracement into the 15m Gap is doable for NQ.
Keep watching NQ afterwards, We want to see a sudden drop to confirm our down movement.
Nasdaq Looking StrongHT in alignment.
Wouldn't be surprised to see this move higher.
Would like to wait for US open but big case for a long in my opinion at these levels.
Nice 2:1 example.
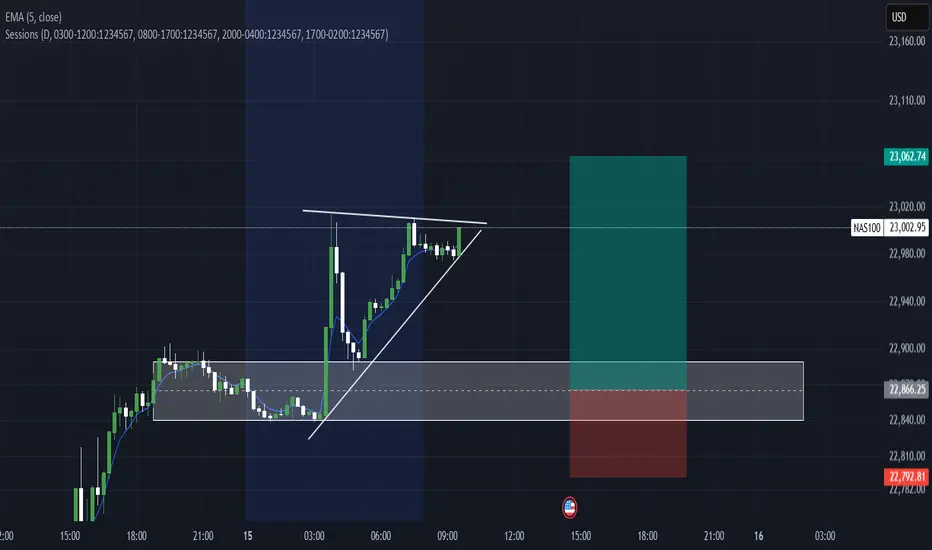
Nas100 Long We Currently Have an Ascending triangle (bullish continuation pattern) Forming After Asian Session & Price is consolidating just below the resistance level, forming higher lows.
We Have a Clearly defined demand zone below current price (gray box), Which also marks out our Bullish Order Block Formed Yesterday Which Price Should Come Retest Before Continuing Upwards.
Pro Tip for CPI Events
Expect increased volatility and fakeouts within the first few minutes.
Wait for a 5–15 min candle close for confirmation before entry.
Use lower timeframes (1m–5m) for entries, but keep higher timeframe structure in mind.
Remember To Like & Subscribe For More A+ Setups✅
NAS100 Forecast 24HAs of Tuesday, July 15, 2025, 2:03:11 AM UTC+4 the forecast for US100 (Nasdaq 100) in the next 24 hours presents a mixed outlook, with underlying bullish sentiment but caution due to ongoing market dynamics and potential for short-term pullbacks.
Factors Contributing to a Bullish Bias:
Underlying Strength and Breakout Behavior: Despite some short-term bearish technical signals, the Nasdaq is described as being in "breakout mode," decisively overriding key levels. This suggests underlying bullish momentum.
AI as a Growth Driver: Artificial intelligence (AI) remains a primary growth driver for the US economy and the technology sector, which heavily influences the Nasdaq 100. Confidence in secular tailwinds like cloud computing and semiconductor demand also persists .
Temporary US Dollar Weakness: The US Dollar Index (DXY) is currently in a retracement phase, pulling back after strength. A weaker dollar can provide a relief rally for risk assets like the Nasdaq, making US tech stocks more attractive to international investors.
Potential for Federal Reserve Rate Cuts: While no rate cuts are expected over the summer, a rate cut is considered likely in September. Historically, phases of moderate interest rate cuts in the absence of a recession have been positive for the US stock market.
"Buy on Dip" Mentality: Some analyses suggest that any short-term declines could be viewed as buying opportunities, indicating an underlying positive sentiment among investors.
Strong Earnings Expectations (for some tech): Despite general market concerns, some technology companies associated with AI innovation are expected to perform well, contributing positively to the index.
Factors Suggesting Caution and Potential for Bearish Movement/Volatility:
Escalating Trade Tensions (Trump's Tariffs): President Trump's continued aggressive protectionist stance and new tariff threats (e.g., against Canada) are a significant risk. These can create uncertainty, weigh on corporate profits, and lead to market volatility. This is frequently cited as the main risk for US indices.
Short-Term Technical Bearishness: Some technical analyses indicate a high chance of bearish candle closures across various timeframes (1H, 4H, Daily, Weekly, Monthly) , and some traders are eyeing selling opportunities from specific resistance zones (e.g., around 22,800-22,869).
Overvalued Growth Stocks: Following a recent rally, US stocks, particularly growth stocks, are trading at a premium to fair value. This can limit upside potential and make the market more susceptible to corrections if tariff negotiations falter or earnings guidance disappoints.
Market Seasonality: As we move into the latter half of July, market seasonality can shift from bullish to a more bearish stance.
Earnings Season and "Sell on the News" : While major financial institutions are kicking off Q2 earnings season, there's a potential for a "sell on the news" response, even if earnings aren't particularly bad, given the strong rally stocks have already staged.
Mixed Global Signals: European markets showing mixed performance and pressure from US futures suggest cautious global risk sentiment, which could cap upside for the Nasdaq.
Unfilled Stock Imbalances: Some technical analysis points to an unfilled stock imbalance around 22,300, which could act as a reaction point if the price pulls back.
Key Levels to Watch (Approximate):
Support: 22,600, 22,300 (unfilled imbalance), 21,611 (resistance-turned-support), 20,673 (Fibonacci extension and prior high).
Resistance: 22,800, 22,869, 23,000-23,100 (potential re-entry targets for rally continuation), 25,000-25,100 (approximate imbalance level to be filled).
In conclusion, for the next 24 hours, the US100 is likely to face a battle between underlying bullish momentum driven by AI and potential Fed policy, and the immediate headwinds of escalating trade tensions and some short-term technical bearishness. Traders should be prepared for volatility and quick shifts in sentiment based on news flow, particularly regarding trade and upcoming earnings reports.
For those interested in further developing their trading skills based on these types of analyses, consider exploring the mentoring program offered by Shunya Trade.
I welcome your feedback on this analysis, as it will inform and enhance my future work.
Regards,
Shunya Trade
⚠️ Disclaimer: This post is educational content and does not constitute investment advice, financial advice, or trading recommendations. The views expressed here are based on technical analysis and are shared solely for informational purposes. The stock market is subject to risks, including capital loss, and readers should exercise due diligence before investing. We do not take responsibility for decisions made based on this content. Consult a certified financial advisor for personalized guidance.


Possible Sell Entry1. CHoC
2. Order Block to be balanced
3. Sell momentum continues
4. H & S pattern also indicating sell

NAS100 - Stock market awaits inflation!The index is located between EMA200 and EMA50 on the one-hour timeframe and is trading in its ascending channel. Maintaining the ascending channel and confirming it after breaking the downtrend line will lead to the continuation of the Nasdaq's upward path to higher targets (23000), but in case of no increase and channel failure, one can look for selling positions up to the target of 22500.
Last week, the U.S.dollar demonstrated strong performance against major global currencies, despite having experienced some weakness since April 2, when President Donald Trump announced retaliatory tariffs against key U.S. trading partners. However, these tariffs were ultimately postponed, and only a baseline 10% tariff was maintained.
The 90-day deadline for implementing these tariffs, originally set to expire on Wednesday, has now been extended to August 1. Nevertheless, Trump surprised the markets this week by announcing a 25% tariff on imports from Japan and South Korea, threatening a 50% tariff on Brazilian goods, and implementing lower tariffs for other partners. These developments triggered a shift of capital toward the U.S. dollar as a safe-haven asset, boosting its strength.
This marks a notable shift in how the dollar is reacting to tariff tensions. In April, fears of an economic slowdown weighed on the greenback, but now it is gaining traction as a refuge in times of uncertainty, particularly as inflation risks mount—contributing to choppy moves in U.S. equity markets.
As is customary, the earnings season will kick off with reports from major banks and financial institutions. On Tuesday, JPMorgan is set to release its financial results, opening the floodgates for a wave of earnings reports. The image referenced lists several other companies, many of which are market heavyweights.
Following a relatively quiet week due to Independence Day holidays and a lack of major economic data, markets are now gearing up for a steady stream of reports in the coming days. Tuesday will bring the Consumer Price Index (CPI) for June along with the Empire State manufacturing survey. On Wednesday, the spotlight will shift to the Producer Price Index (PPI) for the same month. Then, on Thursday, traders will focus on June’s retail sales report, the Philadelphia Fed’s manufacturing survey, and the weekly jobless claims figures.
The week will conclude with two additional reports on Friday: the June housing starts data and the preliminary reading of the University of Michigan’s Consumer Sentiment Index.
June’s CPI report is expected to reflect an uptick in inflation, potentially driven by Trump’s tariff policies. Some analysts believe the tariffs will have an “undeniable” impact on prices, though others remain uncertain.
Despite concerns from both experts and consumers that businesses might pass tariff costs on to buyers, inflation has so far remained relatively moderate this year. The effects of Trump’s aggressive tariff campaign on hard economic data have not yet been clearly reflected—but that may be about to change.
According to Bloomberg’s consensus forecasts, as cited by Wells Fargo Securities, the CPI is expected to show a 2.7% year-over-year increase in June—up from 2.4% the previous month. Meanwhile, core CPI, which excludes volatile food and energy prices, is projected to have risen 3% over the same period, compared to a prior gain of 2.8%.
If these numbers come in as expected, it could support the forecasts of analysts who have warned that the costs of Trump’s heavy import tariffs would eventually show up on price tags, as manufacturers, importers, and retailers pass along the burden through the supply chain. Since taking office, Trump has imposed a wide array of tariffs, including a 10% levy on most imports, a 25% duty on foreign automobiles, and tariffs exceeding 50% on Chinese products.

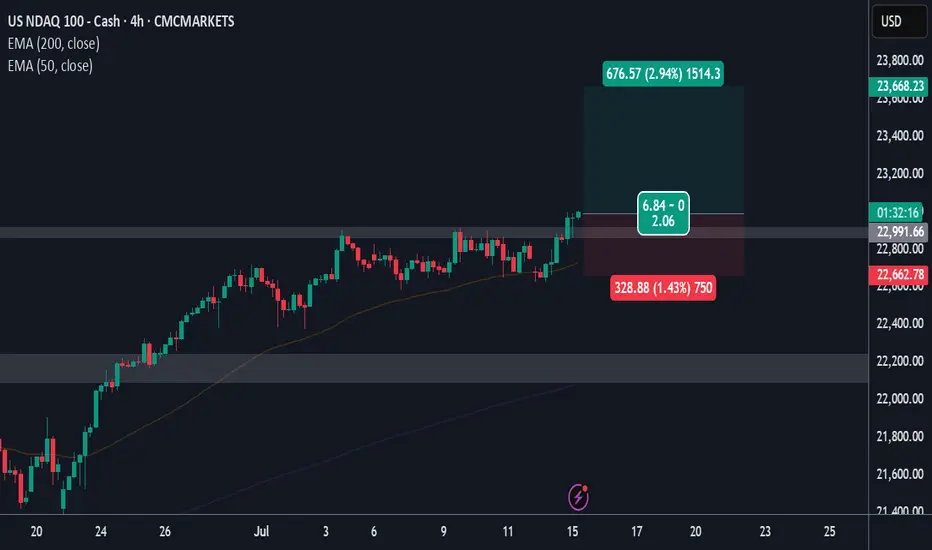
NASDAQ - Long Bias explanation and Entry/SL/TP ideasTrend : NASDAQ is in a strong uptrend at the moment
Retail : Majority have a BEARISH sentiment on this pair
Institutions : Increase in week over week holdings
Structures : No structures as we are at highs so targeting recent formed high + round number above makes sense
Price action : Sitting on a support shelf at the moment
Targets : Recent high + level at round number (23000)
Stops : Many options to place stops below
Entries : Positive bounce at current level, decent entry zone but further possible entry levels sit below too
If trading on a shorter timeframe, perhaps the gap fill is a good point to take the trade off the table.
Targeting higher than 23 might be dangerous as we are playing around at ATHs

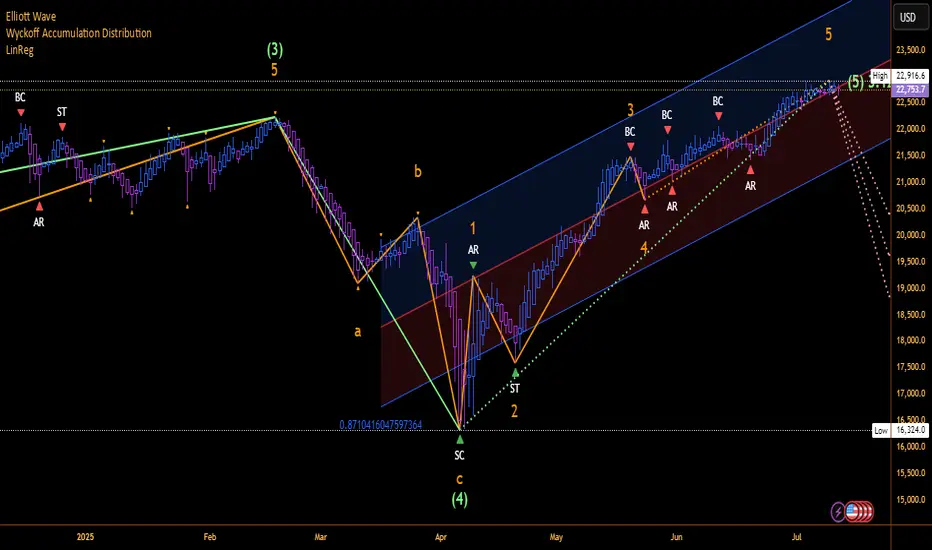
NASDAQ 100 MAJOR REVERSAL SETUP/VOLUME WANINGElliott Wave Theory is a wonderful forecasting tool that provides confluence in conjunction with many technical such as the MFI, Awesome Oscillator, and Bull Bear Power.
Indicators such as Moving averages and ALL Chart Patterns just to name a few, beautifully align painting an amazing roadmap of reversals.
Motive wave in Green, Corrective wave in Pink
Orange Waves are sub waves.
Solid lines are completed, whereas the dotted lines are in progress. The likelihood of a wave count becoming invalidated has a lower probability on higher timeframes for example Day/Week/Month, whereas on lower timeframes such as 1 minute to 5 minute. I've observed wave count invalidation/recalculation of the wave counts more frequently.
With all the news of Tariffs and such the Elliott Wave follows the data, buy/sell side, liquidity, and volume.
Speaking of volume:
April Vol was 15.39M
May Vol was 10.74M
June Vol was 9.04M
As of July 11th it is at 3.37M with 17 trading days to go.
Don't get BULL trapped!!
HAPPY TRADING
Wedge Cracks + Tariff Heat = Bearish Setup On US100The US100 is showing signs of potential reversal after completing a harmonic ABCD pattern near the wedge resistance. The price has broken below the rising wedge support, indicating bearish momentum.
Bearish Confluences:
1) Completed the ABCD pattern
2) Rsisng Wedge Breakdown
3) Clear Bearish RSI Divergence, showing weakening momentum at highs.
Targets:
TP1: 22180
TP2: 22050
TP3: If the price breaks below 22050, then TP3 will be 21650

NASDAQ - BUYS📉➡️📈 USTEC 15min – Precision Long After Panic Drop
🎯 Reversal Detected | No Hesitation | Immediate Follow-Through
Markets don’t always give second chances. But when they do — you want to be ready.
This sharp drop on USTEC (NASDAQ 100) looked brutal to most...
But the ELFIEDT RSI + Reversion indicator calmly printed a double UP signal at the exact low.
🟢 The Signal: Two “UP” Prints at the Bottom
After a fast and aggressive drop, the system triggered two stacked UP signals right into the final selloff candle — giving clear guidance for a high-probability reversal.
🔹 Hypothetical Trade Setup:
Entry: On confirmation of the second UP signal
Stop-loss: Below the signal wick (minimal drawdown)
Reward: Price surged immediately, offering a strong rally of over 100 points in minutes
⏱️ No delay. No doubt.
✅ Traders were positioned before the herd caught on.
🧠 What Makes ELFIEDT Different?
This isn’t about standard indicators.
This is exhaustion logic fused with a proprietary RSI-based reversion model that works across indices, FX, metals, and more.
📌 Non-repainting
📌 Context-aware
📌 Built for real entries, not just “nice charts”
🔐 This is the public build.
The private builds include even more firepower:
Multi-timeframe confluence
Smart volatility filters
Divergence overlays
Breakout-retest logic
Institutional grade scalping layers
📩 DM to request access — limited spots, serious traders only.
#NASDAQ #USTEC #ReversalTrading #SmartSignals #ELFIEDT #RSIBounce #15MinStrategy #TradingView #Indices #Tech100
