short on nas100I'm looking to short US 100 around the 22,840–22,850 supply zone, where price has previously shown strong rejection. I’m expecting a reversal from this resistance area, targeting the 22,660 level as my take profit. My entry is around the current price, and I’ve placed my stop loss just above the zone at 22,875 to manage risk. This setup gives me a clean structure and a solid risk-reward ratio for the move down.
NAS100 trade ideas

SellTrend Line Break
Previous Day Volume
Weekly Rejection Point
Untapped Order Point
London - US Session
Three Tap High Structure/ Double Top

NasdaqNon-commercials (hedge funds, asset managers, etc.) are adding significant long exposure.
This usually reflects confidence in continued upside, often in line with strong tech earnings, soft landing narratives, or a dovish Fed.
Bias: Bullish
Large speculators significantly increased long exposure on Nasdaq futures, showing strong confidence in continued upside momentum. This aligns with recent tech-led rallies and soft-landing expectations.

NSDQ100 Bullish breakout retest?Donald Trump escalated trade tensions again, threatening a 35% tariff on Canadian goods shortly after reopening trade talks, and floated doubling global tariffs to 20%. This reinforces his aggressive protectionist stance and puts renewed pressure on allies like Canada and Vietnam, the latter blindsided by a 20% levy. Meanwhile, US-China relations may be entering a critical phase, with a possible Trump-Xi summit hinted at by Marco Rubio during talks in Malaysia.
On the geopolitical front, Trump is signaling a harder line on Russia, previewing a “major statement” and backing expanded sanctions as the US sends more weapons to Ukraine. This raises global uncertainty, especially for energy and defense sectors.
Conclusion for NSDQ100 trading:
Rising trade tensions and geopolitical risks may dampen market sentiment and lead to volatility in tech-heavy Nasdaq stocks, particularly those reliant on global supply chains. While traders have grown numb to tariff talk, the cumulative pressure suggests a downside risk is building. In the short term, maintain a cautious stance—watch for potential pullbacks and heightened intraday volatility as policy clarity remains elusive.
Key Support and Resistance Levels
Resistance Level 1: 22940
Resistance Level 2: 23060
Resistance Level 3: 23180
Support Level 1: 22410
Support Level 2: 22300
Support Level 3: 22130
This communication is for informational purposes only and should not be viewed as any form of recommendation as to a particular course of action or as investment advice. It is not intended as an offer or solicitation for the purchase or sale of any financial instrument or as an official confirmation of any transaction. Opinions, estimates and assumptions expressed herein are made as of the date of this communication and are subject to change without notice. This communication has been prepared based upon information, including market prices, data and other information, believed to be reliable; however, Trade Nation does not warrant its completeness or accuracy. All market prices and market data contained in or attached to this communication are indicative and subject to change without notice.

are we going ath? let us now~~indices looks green, so we rally?
no trump tariffs?
🐉We value full transparency. All wins and fails fully publicized, zero edit, zero delete, zero fakes.🐉
🐉Check out our socials for some nice insights.🐉
information created and published doesn't constitute investment advice!
NOT financial advice

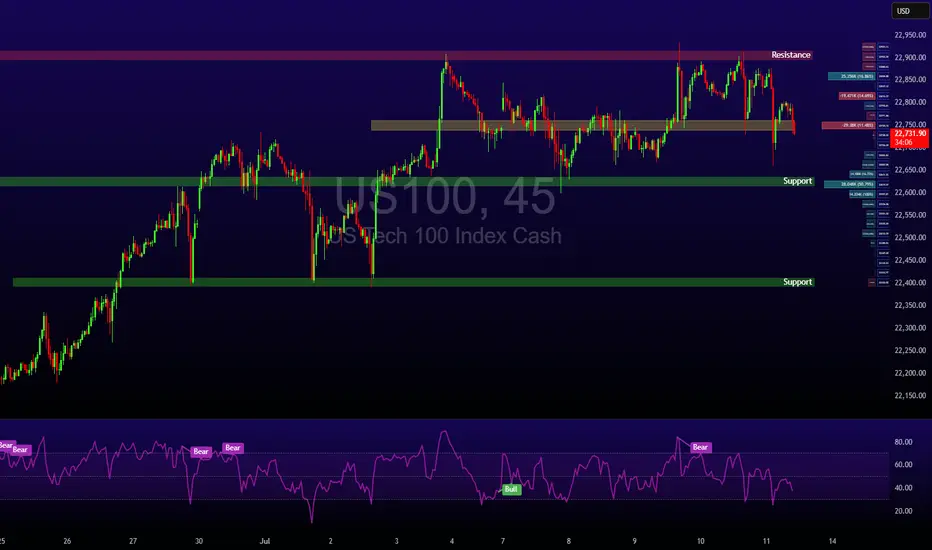
Bearish Momentum Builds Below pivot zone USNAS100 Analysis
Price has reversed from its ATH and now shows bearish momentum.
Below 22705, downside targets are 22615 and 22420.
Bullish scenario only valid if price breaks and holds above 22815.
Pivot: 22710
Support: 22615, 22420
Resistance: 22815, 22910


One last squeeze and NAS100 could explode into the next rallyThe NAS100 is currently coiling within a tight consolidation range, showing signs of tension building up. After a strong push upward, price has been moving sideways in a narrowing structure. This build-up around the high, a compression of buyers and sellers in a low-volatility squeeze could be an indication that we could use. This kind of price action typically signals that buyers are gaining control, squeezing out sellers with each dip.
The lack of deep pullbacks combined with increasingly shallow sell-offs shows fading bearish momentum. Which is often typical during a buildup phase before a breakout. If buyers can push price above with a strong close, it could trigger breakout momentum and lead to a continuation of the larger bullish trend.
Ideally, if price reacts positively and forms bullish confirmation, it would set up a solid continuation entry, with upside potential toward the next target of 23.400.
Until then, bulls are watching closely for signs of commitment. The breakout is yet to be confirmed, but the squeeze is on, and the pressure is building.
What will happen next?
Just sharing my thoughts for the charts, this isn’t financial advice. Always confirm your setups and manage your risk properly.
Disclosure: I am part of Trade Nation's Influencer program and receive a monthly fee for using their TradingView charts in my analysis.

Nasdaq-100 H4 | Swing-low support at 23.6% Fibonacci retracementThe Nasdaq-100 (NAS100) is falling towards a swing-low support and could potentially bounce off this level to climb higher.
Buy entry is at 22,509.40 which is a swing-low support that aligns closely with the 23.6% Fibonacci retracement.
Stop loss is at 22,250.00 which is a level that lies underneath a pullback support and the 38.2% Fibonacci retracement.
Take profit is at 22,921.84 which is a multi-swing-high resistance.
High Risk Investment Warning
Trading Forex/CFDs on margin carries a high level of risk and may not be suitable for all investors. Leverage can work against you.
Stratos Markets Limited (tradu.com ):
CFDs are complex instruments and come with a high risk of losing money rapidly due to leverage. 63% of retail investor accounts lose money when trading CFDs with this provider. You should consider whether you understand how CFDs work and whether you can afford to take the high risk of losing your money.
Stratos Europe Ltd (tradu.com ):
CFDs are complex instruments and come with a high risk of losing money rapidly due to leverage. 63% of retail investor accounts lose money when trading CFDs with this provider. You should consider whether you understand how CFDs work and whether you can afford to take the high risk of losing your money.
Stratos Global LLC (tradu.com ):
Losses can exceed deposits.
Please be advised that the information presented on TradingView is provided to Tradu (‘Company’, ‘we’) by a third-party provider (‘TFA Global Pte Ltd’). Please be reminded that you are solely responsible for the trading decisions on your account. There is a very high degree of risk involved in trading. Any information and/or content is intended entirely for research, educational and informational purposes only and does not constitute investment or consultation advice or investment strategy. The information is not tailored to the investment needs of any specific person and therefore does not involve a consideration of any of the investment objectives, financial situation or needs of any viewer that may receive it. Kindly also note that past performance is not a reliable indicator of future results. Actual results may differ materially from those anticipated in forward-looking or past performance statements. We assume no liability as to the accuracy or completeness of any of the information and/or content provided herein and the Company cannot be held responsible for any omission, mistake nor for any loss or damage including without limitation to any loss of profit which may arise from reliance on any information supplied by TFA Global Pte Ltd.
The speaker(s) is neither an employee, agent nor representative of Tradu and is therefore acting independently. The opinions given are their own, constitute general market commentary, and do not constitute the opinion or advice of Tradu or any form of personal or investment advice. Tradu neither endorses nor guarantees offerings of third-party speakers, nor is Tradu responsible for the content, veracity or opinions of third-party speakers, presenters or participants.

Nasdaq 100 Dips as Tariffs Spark CautionWhile crypto markets rally, U.S. equities have cooled. The Nasdaq 100 dropped by 0.6% following the announcement of new tariffs, particularly those aimed at Canadian goods. Tech stocks are reacting cautiously to these developments, although Nvidia’s record-breaking $4 trillion market cap continues to provide some support for the index.
With major financials such as JPMorgan and Wells Fargo reporting Q2 earnings next week, investors will soon get clarity on how corporate America is coping with higher input costs and global trade tensions.
Technical View (Nasdaq 100):
The index is consolidating between resistance at 22,900 and support at 22,600. A break above 22,900 could reignite the tech rally, while a drop below support may see price test 22,400 and potentially 22,000 in coming sessions.
NAS100 - Follow Progress 2Dear Friends in Trading,
How I see it,
I have summarized the progress and indicated all key levels
Keynotes:
1) I am starting to see strong quality red candles.
2) 22867 is a VERY strong Internal resistance level at this time.
3) 22725 is a VERY strong Internal support level at this time.
I'll keep you posted...please ask if anything is unclear.
I sincerely hope my point of view offers a valued insight.
Thank you for taking the time to study my analysis.

NAS100 (Cash100) Double Top H8Potential short on NAS100.
Risk/reward = 5.4.
Entry = 22 956
Stop loss = 23 059
TP level 1 = 22 473 (50% of position)
T level 2 = 22 303 (50% of position)
RSI divergence.
Waiting for closure of current H8 candle to close in range.
Looking for lower volume on H8 closure, however, will make exception id higher since top 1 was on Thursday the 3rd and markets closed early.

Nasdaq 100 Index 2-Hour Chart Analysis2-hour candlestick chart for the Nasdaq 100 Index (NDX) on the NASDAQ exchange. The chart spans from May to August, showcasing a significant upward trend with notable fluctuations. Key indicators include a recent price of 22,861.53, representing a 0.72% increase. The chart features technical analysis elements such as support and resistance levels, highlighted by green and red boxes, and a downward arrow suggesting a potential price movement.

Nasdaq leads the rally and can move for 3-5 days moreWhile crude oil is declining, tech stocks are gaining momentum: Nasdaq had reached another all-time-high recently and that might not be over: according to statistical studies, it rarely reverses quickly above the upper Bollinger Bands line and the average swing duration is between 17 and 20 days (which gives us several days of potential continuation).
The earnings season fuels growth for many technological stocks, and the “sell America” narrative steps back, so we may see Nasdaq growing as shown in the chart below.
Don't forget - this is just the idea, always do your own reserch and never forget to manage your risk!

The W FormationThe question now is, with the W pattern forming with bold bullish price, that has broken a high we had as a target yesterday, tapped on the FVG already and now showing some positive candle stick communication, will we buy to continue breaking the highs, or relax and wait for more confirmation within the fvg range or even lower before going in?

Nasdaq Surges to New Highs – 23,200 and 24,000 in Sight? (READ)By analyzing the Nasdaq chart on the weekly timeframe, we can see that the index is currently trading around the 22,700 zone and has followed the main analysis perfectly so far — continuing to print new all-time highs.
According to the original outlook, as long as the index holds above 22,150, we can expect further bullish continuation toward the next targets at 23,200 and 24,000.
Please support me with your likes and comments to motivate me to share more analysis with you and share your opinion about the possible trend of this chart with me !
Best Regards , Arman Shaban

USNAS100 Bullish Ahead of NVIDIA Milestone – 23010 in SightUSNAS100 – Outlook
The index continues its bullish momentum, supported by strong tech performance — notably NVIDIA surpassing a $4 trillion market cap.
As long as the price holds above 22880, the trend remains bullish toward:
23010 Then extended targets near 23170
However, a 1H close below 22815 would signal weakness, potentially opening the way for a retracement toward: 22705 And 22615, especially if tariff tensions escalate.
Resistance: 23010, 23170
Support: 22815, 22705, 22615

Double TopSet up forming on the hourly chart on the Dow. When or if we close bellow the 15:00 bar and if we don't trade above the recent highs in the meantime, it will be our trigger for selling short. Because its a big bar I believe there will be a price engineering from the big boys, therefore I will place a sell limit order a 50% retracement in relation to the 15:00 bar from yesterday in order to get in a optimum level.

NAS100 SELLTake trade on your own risk!
still moving on the downtrend to the next supply & demand zone, no sign of reversal.
Set TP: 22,755

BUYAsian Session
Trend Line Break
Order Point
Previous Week Bullish
Divergence
New day..., Action backed decision

NASDAQ 100: Breakout Confirmed — Targeting 23,023Market Overview:
The NASDAQ 100 is showing strong bullish momentum within its ascending channel. After forming an ABCD pattern and breaking above the buy level at 22,745, the price accelerated upward and is approaching the target resistance zone at 23,023.
Technical Signals & Formations:
— ABCD pattern in play
— EMA supports bullish momentum
— Breakout above buy zone at 22,745
— Target is the upper channel boundary and resistance at 23,023
Key Levels:
Support: 22,681, 22,620
Resistance/Target: 23,023
Scenario:
Primary: If the price holds above 22,745, the bullish continuation toward 23,023 remains the main scenario.
Alternative: A drop below 22,681 may lead to a correction toward 22,620 and increase bearish pressure.

NAS100 LONG TRADE PLANThe instrument has broken above the descending trend line. This is an indication of the bullish rally.
Please do your own analysis before placing any trades.
Cheers and Happy Trading !!!

NSDQ100 Bullish Flag continuation pattern developing Metals Market Volatility
Trump’s proposed 50% tariff on copper imports triggered a sharp drop in London copper prices (~2%), with risks of falling below $9,000/ton. While U.S. prices spiked on supply concerns, the global move reflects industrial demand fears—potentially weighing on manufacturing and cyclical stocks.
Trade Negotiations Intensify
Asian trade delegates have logged over 350,000 air miles traveling to Washington as tariff timelines remain unclear. Ongoing uncertainty is capping broader risk appetite, though delayed duties and active talks are offering short-term relief to markets.
Fed Under Pressure
Trump ramped up criticism of Fed Chair Jerome Powell, calling him “terrible,” and may consider replacing him with top adviser Kevin Hassett. This raises questions about central bank independence and future rate policy, a potential headwind for investor confidence.
Market Snapshot
U.S. stock futures: Slightly higher
Oil: Up, on Red Sea conflict
Gold: Down, as risk appetite stabilizes
Conclusion – Nasdaq 100 Trading Outlook
Near-term view: Mildly bullish, supported by easing trade tension and tech sector strength.
Caution warranted: Watch for headline risks from new tariff announcements or Fed-related developments.
Key Support and Resistance Levels
Resistance Level 1: 22940
Resistance Level 2: 23060
Resistance Level 3: 23180
Support Level 1: 22410
Support Level 2: 22300
Support Level 3: 22130
This communication is for informational purposes only and should not be viewed as any form of recommendation as to a particular course of action or as investment advice. It is not intended as an offer or solicitation for the purchase or sale of any financial instrument or as an official confirmation of any transaction. Opinions, estimates and assumptions expressed herein are made as of the date of this communication and are subject to change without notice. This communication has been prepared based upon information, including market prices, data and other information, believed to be reliable; however, Trade Nation does not warrant its completeness or accuracy. All market prices and market data contained in or attached to this communication are indicative and subject to change without notice.
