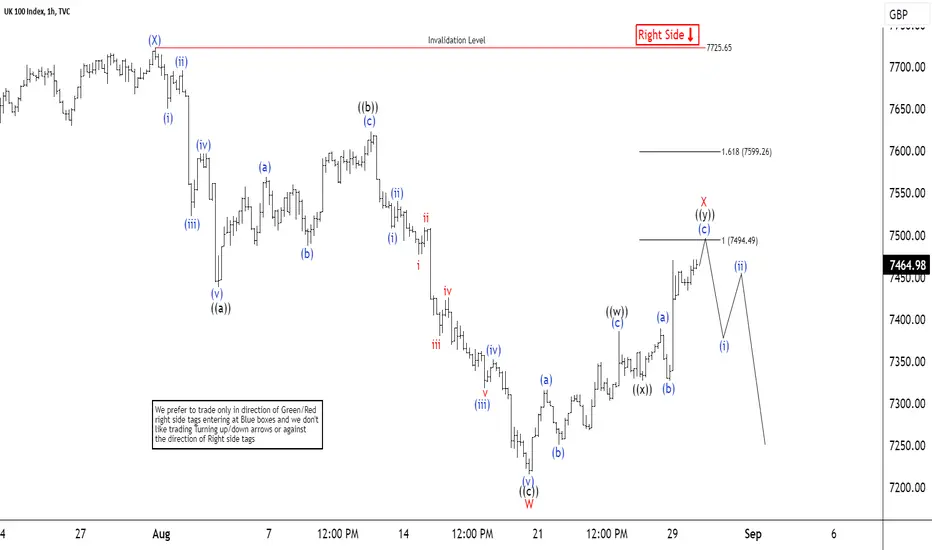
FTSE Elliott Wave Analysis for Monday 04/09/2023The primary scenario is playing out and we reached the wave X area. There are several indications that a reversal to the downside is near.
UK100 trade ideas


Strong Bull After RetracementThe UK100 Had been trying to pass this resistance for the couple of days and it keeps hitting this point multiple times but no if we saw a retracement above the resistance, I thing it will be a beautiful bull trade.

FTSE Elliott Wave Analysis Higher Timeframe (02/09/2023)In the higher timeframe, investors should wait for the next pullback to buy again. We are approaching the first relevant areas.

Bullish Daily Index Trading Analysis: FTSE vs. US Tech100To enhance the FTSE forecast and vary the wording, you could say:
"In the longer-term perspective, it's advisable for investors to exercise patience and wait for the upcoming retracement before considering new buying opportunities. We are approaching key support/resistance levels, which will play a pivotal role in our trading decisions."

Decoding FTSE 100: Key Levels RevealedFTSE 100 Technical Outlook
This week's FTSE price action illustrates traders' sensitivity to interest rate expectations on both sides of the Atlantic.
On Tuesday, the FTSE experienced a post-bank holiday rebound, driven by weaker U.S. job numbers that were perceived to alleviate pressure on the Fed to raise interest rates further. Notably, Tuesday's rally resulted in the FTSE breaking and closing above the descending trendline formed by the lower swing highs from earlier this month.
However, the rally lost momentum when it encountered a short-term resistance zone around 7,500, mainly due to stronger-than-expected European inflation data that raised the likelihood of the ECB maintaining higher interest rates for a longer period.
Wednesday's reversal now presents a short-term resistance area that traders can monitor as we approach this afternoon's U.S. non-farm payrolls data.
A second failure at Wednesday's high would be bearish, potentially setting the stage for a decline toward the 7,200 support level (see chart below). Conversely, a decisive breakthrough above Wednesday's high might pave the way for an extended rally towards 7,625.
FTSE 100 Daily Candle Chart:
Support
S1 = 7,227
S2 = 7,204
S3 = 6,825
Resistance
R1 = 7,509
R2 = 7,625
R3 = 7,724
Risk management:
US non-farm payrolls is an event which has the potential to cause outsized market volatility.
Support and resistance levels should be used as a guide and are not guaranteed to hold.
Disclaimer: This is for information and learning purposes only. The information provided does not constitute investment advice nor take into account the individual financial circumstances or objectives of any investor. Any information that may be provided relating to past performance is not a reliable indicator of future results or performance.

FTSE Elliott Wave Analysis for Friday 01/09/2023The primary scenario is playing out and we reached the wave X area. There are several indications that a downward reversal is near.

FTSE Elliott Wave Analysis for Thursday 31/08/2023The primary scenario is playing out and we reached the wave X area. There are several indications that a downward reversal is near.

SHORT TERM BULLISH ON UK100xwe are looking at a possible short-term bullish trend on the UK 100 index because it found its retest at the FVG level of the year at 7251.22 and successfully broke through and retested at a key demand level and has formed a double bottom pattern on said key demand level at 7461.48

Green for July Red For AgustHello traders. i was focusing UKX for these days. i blieve distribution finished in this area. so i blieve UKX will want to test up side for all of this month. and also it can drop back on agust.
lets hee how it will play.

Strong Bearish DivergenceThe UK100 formed a strong bearish divergence and the price is expected to fall since the Trend line liquidity has already been grabbed from a strong resistance zone.
Manage risk accordingly

FTSE Elliott Wave Analysis for Wednesday 30/08/2023The primary scenario is playing out and we reached the wave X area. There are several indications that a downward reversal is near.

Elliott Wave View: FTSE Rally Expected to Turn LowerFTSE Index shows a bearish sequence from 4.21.2023 high favoring further downside. The decline from 4.21.2023 high is currently unfolding as a double three Elliott Wave structure. Down from 4.21.2023 high, wave (W) ended at 7229.57 and rally in wave (X) ended at 7725.65. The Index has resumed lower in wave (Y). The internal subdivision of wave (Y) is unfolding as another double three in lesser degree. Down from wave (X), wave ((a)) ended at 7437.88 and rally in wave ((b)) ended at 7622.92. The third leg lower wave ((c)) ended at 7215.76 which completed wave W in higher degree.
Wave X rally is now in progress as a double three. Up from wave W, wave ((w)) ended at 7386.08 and pullback in wave ((x)) ended at 7326.48. Expect wave ((y)) to extend higher towards 7493.79 – 7598.57 area and this should complete wave X in higher degree. Afterwards, Index should turn lower in wave Y. Potential target lower is 100% – 161.8% Fibonacci extension from 2.16.2023 high towards 6560 – 7086.2. Near term, as far as pivot at 7725.65 high stays intact, expect rally to fail in 3, 7, or 11 swing for further downside.
FTSE Elliott Wave Analysis for Monday 28/08/2023The primary scenario (in green) assumes more upside in a corrective pattern to finish wave X. The secondary scenario (in red) assumes that we will get an ABC correction and therefore we need another leg down (wave ((v))) to finish wave A.

FTSE Elliott Wave Analysis Higher Timeframe (26/08/2023)In the higher timeframe, investors should wait for the next pullback to buy again. We are approaching the first relevant areas.

#FTSE #UK100 Two Way Trading Opportunities In this update we review the recent price action in the FTSE and identify the next high probability trading opportunities and price objectives to target
•Past performance not indicative of future results

uk100 daily overview of key s/r levels buy/hold trade🔸Hello traders, today let's update the 2daily chart for UK100. We are currently testing
weak s/r level near 7300, however I expect the level to break soon and more downside.
🔸Price was rejected off the highs recently and correction in progress now expecting
more losses until we bottom out near 6900, which is a great level to buy/hold for the bulls.
expecting a re-test of mirror s/r level at 7650 points, so this makes this a decent setup
on buy side (10% upside)
🔸recommended strategy bulls: wait for correction to complete near 6900, do not buy/hold
right now, since current s/r level won't hold (weak s/r level) and more losses incoming.
get ready to buy/hold low near 6900 points targeting mirror s/r level at 7650. 10% upside,
low risk entry on buy side. good luck traders!
🎁Please hit the like button and
🎁Leave a comment to support our team!
RISK DISCLAIMER:
Trading Futures , Forex, CFDs and Stocks involves a risk of loss.
Please consider carefully if such trading is appropriate for you.
Past performance is not indicative of future results.
Always limit your leverage and use tight stop loss.

FTSE100 Short Term Rebound #WaveAnalysis #UK100
#FTSE100 index reversed from support level 7200
Likely to rise to resistance level 7400
FTSE100 index recently reversed up from the powerful support level 7200 (former multi-month low from March), coinciding with the lower daily Bollinger Band.
The support level 7200 was further strengthened by the nearby support trendline of the wide daily down channel from April.
Given the strength of the support level 7200 and the oversold daily Stochastic, FTSE100 index can be expected to rise further toward the next resistance level 7400.

FTSE Elliott Wave Analysis for Monday 21/08/2023It looks like we will get more downside in the FTSE. We are looking to a short a wave B. If we do not get the wave B, we can go long again after the correction is finished (wave (Y)).

FTSE Elliott Wave Analysis Higher Timeframe (20/08/2023)In the higher timeframe, investors should wait for the next pullback to buy again. We are approaching the first relevant areas.


FTSE, Deviation then a drop?! UK100 / 4H
Hello traders, welcome back to another market breakdown.
FTSE is rallying back again above an old high which can be a run for stops.
I'll be looking for more confirmation with a clean invalidation if it comes back bellow the Mid.
Checkout the chart for the levels and my trigger plan for a swing trade.
Trade safely,
Trader Leo.

FTSE Elliott Wave Analysis for Friday 18/08/2023The wave ((b)) of the abc correction might be finished. We are in the areas where wave c, wave (y), and wave ((b)) should end. From here we can expect a reversal.
