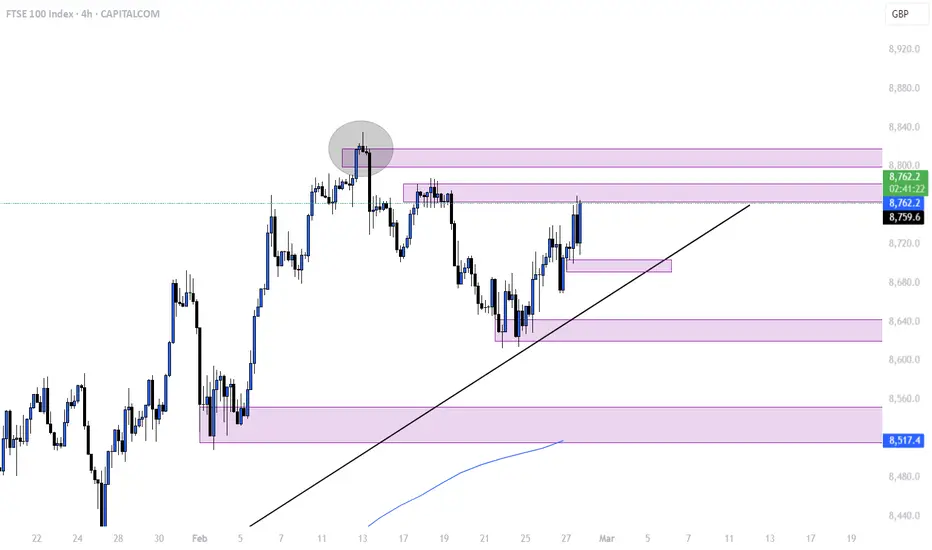
FTSE retest of ATH, The Week Ahead 03rd March ‘25Market Sentiment:
The FTSE 100 index maintains a bullish outlook, supported by the long-term uptrend. However, price action is at a key technical level, where market participants will look for confirmation of the next move.
Bullish Scenario:
Key Support: 8709 (20-day moving average, previous consolidation zone, and rising trendline).
A pullback to this level, followed by a bullish rebound, would confirm continued strength in the uptrend.
Upside Targets:
8850 (initial resistance)
8900 (next key resistance)
9000 (psychological resistance and long-term target)
A strong bounce from 8709 would reinforce bullish momentum and signal a continuation of the prevailing uptrend.
Bearish Scenario:
A confirmed break below 8709, with a daily close beneath this level, would indicate a potential trend shift or deeper correction.
This could expose the index to further downside risk, targeting:
8650 (next immediate support)
8620, if selling pressure intensifies
A sustained loss of 8709 could weaken bullish sentiment, increasing the likelihood of extended consolidation or correction.
Market Outlook:
The 8709 remains the key pivot level—holding above it supports the bullish case, while a break lower could indicate a shift in momentum. Traders should monitor price action and volume near this level to assess the next directional move in the index.
This communication is for informational purposes only and should not be viewed as any form of recommendation as to a particular course of action or as investment advice. It is not intended as an offer or solicitation for the purchase or sale of any financial instrument or as an official confirmation of any transaction. Opinions, estimates and assumptions expressed herein are made as of the date of this communication and are subject to change without notice. This communication has been prepared based upon information, including market prices, data and other information, believed to be reliable; however, Trade Nation does not warrant its completeness or accuracy. All market prices and market data contained in or attached to this communication are indicative and subject to change without notice.
UK100 trade ideas

UK100 - be prepare for another kill Team, yesterday we kill the UK market and put them into recession - we done nearly few time repeatedly
we are SETTING SHORT ON UK100 at 8742-35
Double the short position at 8776-85 - Target at 8748-36
Target 1 at 8712-06
Target 2 at 8696-82

Elliott Wave View: FTSE Should See More DownsideShort Term Elliott Wave View in FTSE suggests that cycle from 11.13.2024 low is in progress as a 5 waves impulse. Up from there, wave ((i)) ended at 8388.37 and pullback in wave ((ii)) ended at 8002.34. Wave ((iii)) higher subdivided into another 5 waves in lesser degree. Up from wave ((ii)), wave (i) ended at 8326.32 and pullback in wave (ii) ended at 8192.31. Wave (iii) higher ended at 8584.73 and dips in wave (iv) ended at 8462.18 as the 1 hour chart below shows.
The Index then resumed higher. Up from wave (iv), wave i ended at 8692.84 and wave ii pullback ended at 8520.2. Wave iii higher ended at 8767.5 and pullback in wave iv ended at 8685.78. Final leg wave v ended at 8820.93 which completed wave (v) of ((iii)). Pullback in wave ((iv)) is currently in progress as a double three Elliott Wave structure. Down from wave ((iii)), wave (w) ended at 8638.63 and wave ((x)) ended at 8768.05. Expect the Index to extend lower in wave (y) of ((iv)) to reach 8475 – 8587 area before it resumes higher. Near term, as far as pivot at 8818.31 high stays intact, expect rally to fail for further downside.

UK100 - PREPARE FOR ANOTHER SHORT Team, yesterday we shorted the UK100 with successful on double short volume as mentioned, and we almost put them into recession, lolz.
Today We are going to set up a short positions
Today, our short position will be at 8748-8762 - add small short volume
Double up on 8776-83
Target 1 at 8725-36
Target 2 at 8702-08

UK100Hi everyone what we can see on uk100 we reached hh hit the co-prativation line and we are going to reverse to 8.703.6 all have a good day (evening) CAPITALCOM:UK100 www.tradingview.com
FTSE 100 H1 Technical Analysis: Key Support Test at 8680-8700 Looking at the H1 timeframe for the FTSE 100, we're observing a critical technical setup:
Market Structure:
Price testing key support zone after recent downward pressure
Clear bearish momentum from recent highs at 8833
Moving averages aligned bearishly
Blue box indicating potential continuation zone lower
Key Levels:
Immediate Resistance: 8700
Critical Support: 8682
Current Price: ~8694
Next Support Target: 8616 (Shown in blue box)
Technical Indicators:
Volume showing increased selling interest at highs
Momentum indicators in bearish territory
All major moving averages now acting as resistance
Clear lower highs and lower lows structure forming
Trading Considerations:
Watch for reaction at current support (8682-8700 zone)
Potential for further downside if support breaks
Key resistance now at previous structure around 8750
Risk management crucial at these technical junction points

FTSE INTRADAY Breakout retest at 8675The FTSE (UK100) index price action sentiment appears bullish, supported by the longer-term prevailing uptrend.
The key trading level is at 8675, the “bull flag” breakout level. A corrective pullback from the current levels and a bullish bounce back from the 8675 level could target the upside resistance at 8790 followed by the 8854 and 8920 levels over the longer timeframe.
Alternatively, a confirmed loss of 8674 support and a daily close below that level could trigger a further retracement and a retest of 8608 support level followed by 8564.
This communication is for informational purposes only and should not be viewed as any form of recommendation as to a particular course of action or as investment advice. It is not intended as an offer or solicitation for the purchase or sale of any financial instrument or as an official confirmation of any transaction. Opinions, estimates and assumptions expressed herein are made as of the date of this communication and are subject to change without notice. This communication has been prepared based upon information, including market prices, data and other information, believed to be reliable; however, Trade Nation does not warrant its completeness or accuracy. All market prices and market data contained in or attached to this communication are indicative and subject to change without notice.

UK100 - what should we doTeam, yesterday another target hit for our trade on UK100 short position.
Today we set limit order short at 8722-32
Target 1 at 8705-8696
Target 2 at 8782-73
PLEASE NOTE: We will DOUBLE the short at 8764-80
target for this at 8734-28

Measured Moves: Understanding Harmonic SimplicityFew tools in trading are forward-looking and adapt to current volatility, Measured Moves do. Unlike traditional indicators, Measured moves offer a structured way to project price targets and turning points with no lag.
Let’s take a deep dive into the harmonic simplicity of the measure move and look at how it can be applied to real-world market conditions.
What Are Measured Moves?
A measured move is a price projection technique that assumes market swings tend to repeat in a proportional manner. By taking the length of a prior move and projecting it forward, traders can identify potential areas where price might react, either as a turning point or a continuation zone. This makes measured moves one of the few truly predictive tools in technical analysis—offering guidance without the lag that comes with moving averages or oscillators.
Beyond their predictive nature, measured moves are inherently adaptive. Markets move through phases of expansion and contraction, meaning fixed-length indicators can become unreliable when volatility shifts. Measured moves, by definition, adjust to the prevailing market conditions, making them particularly effective in dynamic environments.
Example: DXY Daily Candle Charts Measured Move
DXY Daily Candle Charts: Measured Moves
Past performance is not a reliable indicator of future results
Past performance is not a reliable indicator of future results
Timing Profit-Taking with Measured Moves
One of the most effective uses of measured moves is in setting profit targets. In trending markets, traders often struggle with the decision of when to exit—too early and they leave gains on the table, too late and they risk giving back profits. A measured move provides a logical framework for identifying where price may run out of steam.
The process is straightforward: take the length of a completed impulse move and project it from the swing low (in an uptrend) or swing high (in a downtrend) of a subsequent pullback. If price approaches this level and momentum starts to fade, it suggests a natural area for taking profits. This method ensures that you don’t rely solely on intuition or arbitrary levels but instead use market-driven symmetry to guide exits.
Example: FTSE 100 Breakout on Daily Candle Chart
Past performance is not a reliable indicator of future results
Past performance is not a reliable indicator of future results
Entering Two-Legged Pullbacks
Measured moves are also very useful for timing entries in corrective pullbacks—especially in two-legged retracements, which are common in trending markets. Price rarely moves in a straight line; instead, pullbacks often develop in two distinct waves or A,B,C,D pattern before resuming the dominant trend. This pattern can be frustrating for traders who enter too early, only to see price dip lower before the trend continues.
By measuring the size of the first pullback and projecting it forward, traders can anticipate the likely endpoint of the second leg. When price reaches this level and starts to stabilise, it provides a higher-probability entry for traders looking to trade with the trend. This technique works particularly well when combined with broader support or resistance levels, reinforcing key zones where buying or selling pressure may return.
Example: Gold Daily Candle Chart
Past performance is not a reliable indicator of future results
Past performance is not a reliable indicator of future results
Combining Measured Moves with Candle Patterns
Measured moves provide price-based structure, but confirmation from price action can refine entries and exits even further. Candlestick patterns help traders gauge sentiment at key measured move levels, offering a layer of confirmation before taking action.
For profit-taking, if price reaches a measured move projection and forms a reversal pattern—such as a shooting star in an uptrend or a hammer in a downtrend—it strengthens the case for locking in gains. Conversely, for entries, a two-legged pullback that completes at a measured move level becomes even more compelling when a bullish engulfing pattern or pin bar forms, signalling potential trend continuation.
By combining measured moves with candlestick confirmation, you avoid acting on rigid projections alone. Instead, you can use price action cues to validate measured move levels, improving decision-making and reducing false signals.
Summary:
Measured moves provide a structured, adaptable approach to navigating price action. Whether used for profit-taking or timing pullback entries, their ability to adjust to volatility and offer forward-looking projections makes them a valuable tool in a trader’s arsenal. When combined with candlestick patterns, they become even more effective, offering both precision and confirmation in a market that thrives on uncertainty.
Disclaimer: This is for information and learning purposes only. The information provided does not constitute investment advice nor take into account the individual financial circumstances or objectives of any investor. Any information that may be provided relating to past performance is not a reliable indicator of future results or performance. Social media channels are not relevant for UK residents.
Spread bets and CFDs are complex instruments and come with a high risk of losing money rapidly due to leverage. 83% of retail investor accounts lose money when trading spread bets and CFDs with this provider. You should consider whether you understand how spread bets and CFDs work and whether you can afford to take the high risk of losing your money.

UK100 - small short for nowTeam, we are shorting UK100 at 8708-8715 ranges,
Target 1 at 8682-74
Target 2 at 8661-57

Timing the FTSE’s PullbackNvidia has stormed back from its early February lows, rallying more than 20% to erase January’s sharp gap lower. But with the gap now closed, the stock has hit its first real test of resistance.
DeepSeek Reaction: Panic Fades
The initial sell-off was triggered by fears that DeepSeek’s AI breakthrough could loosen Nvidia’s grip on the industry. However, those concerns have since eased. While DeepSeek’s model offers cost advantages, it still relies on Nvidia’s GPUs, and overall AI accelerator demand remains strong. Nvidia’s software ecosystem remains a significant moat, making it difficult for the industry to shift away from its technology on a large scale. The broader takeaway? The market likely overreacted.
The Technical Significance of Gaps
Price gaps aren’t just voids on a chart—they represent key areas of supply and demand imbalance. When a stock gaps lower, it often creates a resistance zone as trapped buyers look to exit when price returns.
After rallying back earlier this month, Nvidia finally posted its first red candle the moment the gap was filled, snapping a ten-session streak of higher closes. This suggests sellers are stepping in, and the battle over direction is heating up.
Forward Scenarios: Breakout or Breakdown?
Breaking Higher: If Nvidia can push beyond the gap close, the next resistance is the late January swing high—the level that triggered the breakdown. Above that, the major hurdle remains the double-top all-time highs from the turn of the year.
Pulling Back: The rally to close the gap has formed a steep ascending trendline. A break below this could open the door for a deeper retracement, with the February swing lows as a key downside target. Given Nvidia’s multi-year uptrend, choppy consolidation phases like this are normal—but if support gives way, it could shift momentum in bears’ favour.
Nvidia (NVDA) Daily Candle Chart
Past performance is not a reliable indicator of future results
Disclaimer: This is for information and learning purposes only. The information provided does not constitute investment advice nor take into account the individual financial circumstances or objectives of any investor. Any information that may be provided relating to past performance is not a reliable indicator of future results or performance. Social media channels are not relevant for UK residents.
Spread bets and CFDs are complex instruments and come with a high risk of losing money rapidly due to leverage. 83% of retail investor accounts lose money when trading spread bets and CFDs with this provider. You should consider whether you understand how spread bets and CFDs work and whether you can afford to take the high risk of losing your money.

FTSE INTRADAY support at 8608The FTSE (UK100) index price action sentiment appears bullish, supported by the longer-term prevailing uptrend.
The key trading level is at 8608, which is the 21st February swing low. A corrective pullback from the current levels and a bullish bounce back from the 8608 level could target the upside resistance at 8740 followed by the 8790 and 8850 levels over the longer timeframe.
Alternatively, a confirmed loss of 8608 support and a daily close below that level could trigger a further retracement and a retest of 8564 support level followed by 8500.
This communication is for informational purposes only and should not be viewed as any form of recommendation as to a particular course of action or as investment advice. It is not intended as an offer or solicitation for the purchase or sale of any financial instrument or as an official confirmation of any transaction. Opinions, estimates and assumptions expressed herein are made as of the date of this communication and are subject to change without notice. This communication has been prepared based upon information, including market prices, data and other information, believed to be reliable; however, Trade Nation does not warrant its completeness or accuracy. All market prices and market data contained in or attached to this communication are indicative and subject to change without notice.

UK100 Short on Regression BreakMarket had a tough night on Friday - UK100 has broken the regression and the short bias in place.
I am considering this trade and which EA to use.

UK100What is UK 100 (FTSE 100)?
The UK 100, commonly referred to as the FTSE 100, is a stock market index that represents the performance of the largest publicly traded companies in the United Kingdom. some of the big names includes (1) ;AstraZeneca - Market Cap: £171.02 Billion
AstraZeneca is global pharmaceutical company specializing in oncology, cardiovascular, renal, and respiratory diseases.
(2)Shell - Market Cap: £161.21 Billion
Shell is One of the world's leading energy companies involved in oil and gas exploration and renewable energy solutions.
(3) HSBC Holdings - Market Cap: £148.05 Billion
HSBC is a multinational banking and financial services organization with operations worldwide.
(4) Unilever Group - Market Cap: £113.95 Billion
Unilever group is A consumer goods company with brands across food, beverages, cleaning products, and personal care.
(5)RELX Group (formerly Reed Elsevier) - Market Cap: £74.34 Billion
Relex group is Known for its information-based analytics business serving legal professionals worldwide.
(6) British American Tobacco - Market Cap: £71.05 Billion
BAT is is multinational tobacco company with a diverse portfolio including cigarettes and vaping products.
(7) Barclays.
The index is calculated based on market capitalization; larger companies have more influence on its movements.
The current Governor of the Bank of England is Andrew Bailey. He took office on March 16, 2020.
THE Impact of Monetary Policies on FTSE 100 UK100
(1)Interest Rates:
When interest rates rise, borrowing becomes more expensive for businesses and consumers. This can lead to reduced spending and slower economic growth, potentially causing stock prices to fall.
Conversely, lower interest rates make borrowing cheaper and can boost economic activity by encouraging investment and consumption.
(2)Quantitative Easing:
This involves injecting money into the economy by buying government bonds or other securities from banks.
It increases liquidity in financial markets but can also lead to inflationary pressures if not managed carefully.
(3) Forward Guidance:
The BoE uses forward guidance to communicate future policy intentions.
If it signals potential rate hikes or tightening measures ahead due to inflation concerns or strong economic data, this could negatively impact stocks like those in the FTSE 100 by increasing borrowing costs.
(4) Currency Fluctuations:
A stronger pound sterling often results from tighter monetary policies (e.g., higher interest rates). While beneficial for imports and controlling inflation, it can make exports more expensive for British companies listed in international markets.
(5)Market Sentiment:
Positive monetary policy decisions that support growth without excessive inflation tend to boost investor confidence in stocks like those within the FTSE 100(UK100).
Conversely, dovish policies signaling weaker economic conditions might reduce investor appetite for equities.
In summary:
Monetary policy decisions significantly influence stock market indices such as FTSE 100 through mechanisms like interest rates and quantitative easing.
Andrew Bailey leads these efforts at BoE with a focus on maintaining price stability while supporting sustainable growth..
DO YOUR OWN RESEARCH PLEASE!!!

FTSE still uptrending above 8590 levelThe FTSE (UK100) index price action sentiment appears bullish, supported by the longer-term prevailing uptrend.
The key trading level is at 8590, previous consolidation zone and a rising trendline zone. A corrective pullback from the current levels and a bullish bounce back from the 8590 level could target the upside resistance at 8695 followed by the 8740 and 8800 levels over the longer timeframe.
Alternatively, a confirmed loss of 8590 support and a daily close below that level could trigger a further retracement and a retest of 8556 support level followed by 8495.
This communication is for informational purposes only and should not be viewed as any form of recommendation as to a particular course of action or as investment advice. It is not intended as an offer or solicitation for the purchase or sale of any financial instrument or as an official confirmation of any transaction. Opinions, estimates and assumptions expressed herein are made as of the date of this communication and are subject to change without notice. This communication has been prepared based upon information, including market prices, data and other information, believed to be reliable; however, Trade Nation does not warrant its completeness or accuracy. All market prices and market data contained in or attached to this communication are indicative and subject to change without notice.

World-wide Bull Markets StartingI just wanted to share some of the major markets outside the US are starting major bull markets. Especially we should highlight Japan and the Nikkei is set to break and run from it's 1989 all time high. UK's FTSE is also also breaking above the range it's been in for almost the last 30 years. It's quite exciting! I would expect China to eventually follow suit and break it's two decade long range.
Good luck!

FTSE reacts to upbeat UK Retail Sales dataThe FTSE (UK100) index price action sentiment appears bullish, supported by the longer-term prevailing uptrend. UK Equity index is digesting upbeat retail sales, hot inflation, and strong wage growth data.
The key trading level is at 8648, a swing low. A corrective pullback from the current levels and a bullish bounce back from the 8648 level could target the upside resistance at 8750 followed by the 8800 and 8850 levels over the longer timeframe.
Alternatively, a confirmed loss of 8648 support and a daily close below that level would negate the bullish outlook opening a way for a further retracement and a retest of 8590 support level followed by 8495.
This communication is for informational purposes only and should not be viewed as any form of recommendation as to a particular course of action or as investment advice. It is not intended as an offer or solicitation for the purchase or sale of any financial instrument or as an official confirmation of any transaction. Opinions, estimates and assumptions expressed herein are made as of the date of this communication and are subject to change without notice. This communication has been prepared based upon information, including market prices, data and other information, believed to be reliable; however, Trade Nation does not warrant its completeness or accuracy. All market prices and market data contained in or attached to this communication are indicative and subject to change without notice.

Scalp LongUse proper risk management
Looks like good trade.
Lets monitor.
Use proper risk management.
Disclaimer: only idea, not advice.

A quick buy on FTSE right nowWe are seeing the following on the FTSE
1) H4 is oversold
2) There is H1 divergence
3) 2 patterns at the same level
4) Yesterdays low at 8648
5) Daily trend is up
This is likely to be a quick trade as there is huge resistance at 8685. We may turn short if needed.

FTSE100 H4 | Potential bearish reversalFTSE100 (UK100) is rising towards an overlap resistance and could potentially reverse off this level to drop lower.
Sell entry is at 8,686.45 which is an overlap resistance.
Stop loss is at 8,760.00 which is a level that sits above the 61.8% Fibonacci retracement and a pullback resistance.
Take profit is at 8,491.22 which is a swing-low support.
High Risk Investment Warning
Trading Forex/CFDs on margin carries a high level of risk and may not be suitable for all investors. Leverage can work against you.
Stratos Markets Limited (www.fxcm.com):
CFDs are complex instruments and come with a high risk of losing money rapidly due to leverage. 63% of retail investor accounts lose money when trading CFDs with this provider. You should consider whether you understand how CFDs work and whether you can afford to take the high risk of losing your money.
Stratos Europe Ltd (www.fxcm.com):
CFDs are complex instruments and come with a high risk of losing money rapidly due to leverage. 63% of retail investor accounts lose money when trading CFDs with this provider. You should consider whether you understand how CFDs work and whether you can afford to take the high risk of losing your money.
Stratos Trading Pty. Limited (www.fxcm.com):
Trading FX/CFDs carries significant risks. FXCM AU (AFSL 309763), please read the Financial Services Guide, Product Disclosure Statement, Target Market Determination and Terms of Business at www.fxcm.com
Stratos Global LLC (www.fxcm.com):
Losses can exceed deposits.
Please be advised that the information presented on TradingView is provided to FXCM (‘Company’, ‘we’) by a third-party provider (‘TFA Global Pte Ltd’). Please be reminded that you are solely responsible for the trading decisions on your account. There is a very high degree of risk involved in trading. Any information and/or content is intended entirely for research, educational and informational purposes only and does not constitute investment or consultation advice or investment strategy. The information is not tailored to the investment needs of any specific person and therefore does not involve a consideration of any of the investment objectives, financial situation or needs of any viewer that may receive it. Kindly also note that past performance is not a reliable indicator of future results. Actual results may differ materially from those anticipated in forward-looking or past performance statements. We assume no liability as to the accuracy or completeness of any of the information and/or content provided herein and the Company cannot be held responsible for any omission, mistake nor for any loss or damage including without limitation to any loss of profit which may arise from reliance on any information supplied by TFA Global Pte Ltd.
The speaker(s) is neither an employee, agent nor representative of FXCM and is therefore acting independently. The opinions given are their own, constitute general market commentary, and do not constitute the opinion or advice of FXCM or any form of personal or investment advice. FXCM neither endorses nor guarantees offerings of third-party speakers, nor is FXCM responsible for the content, veracity or opinions of third-party speakers, presenters or participants.

FTSE 100 Wave Analysis – 20 February 2025
- FTSE 100 broke support zone
- Likely to fall to support level 8600.00
FTSE 100 Index previously broke the support zone between the support level 8700.00 (which created daily Bullish Engulfing earlier this month) and the 38.2% Fibonacci correction of the upward impulse from January.
The breakout of this support zone accelerated the active short-term ABC correction 4, which belongs to the upward impulse sequence (C) from last year.
FTSE 100 Index can be expected to fall to the next support level 8600.00 (target price for the completion of the active correction 4 intersecting with the support trendline of the daily up channel from December).

ShortUse proper risk management
Looks like good trade.
Lets monitor.
Use proper risk management.
Disclaimer: only idea, not advice.

Moustafa! 18.02.25 Uk 100 analysis with two TP targets!Broke the falling wedge and is going towards the ATH
There is also a bullish pennant on the 1h frame to push the price to the TP
Good luck
Note:
My ideas are exclusive to myself only and is not regarded as an advice for traders or investors and are not more than personal thoughts which I just wanted to share with you all and I do hope they could help.
I am not selling any signals and I do not take money favour any trades recommendations. They are free of charge all lifelong but I keep the copy rights of them though to not be copied or shared or sold.
