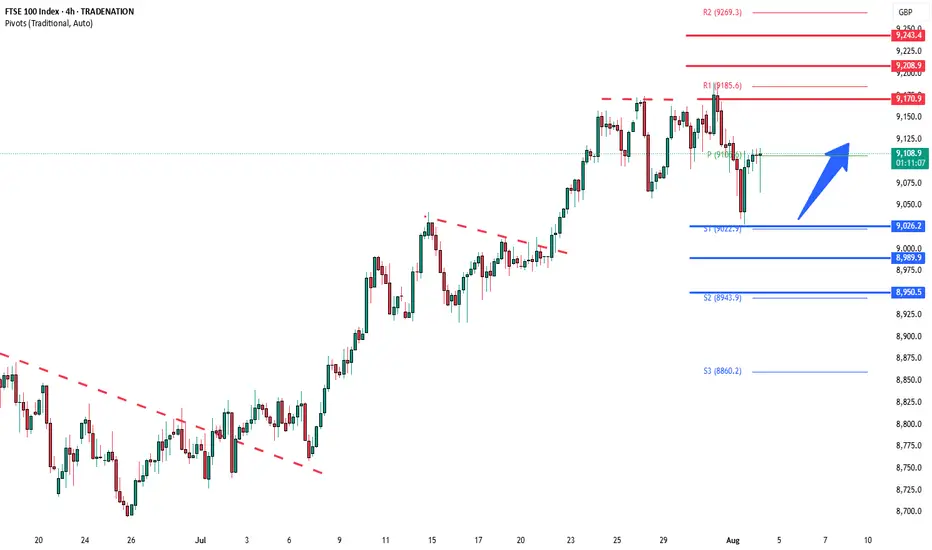
FTSE uptrend pause supported at 9026The FTSE remains in a bullish trend, with recent price action showing signs of a corrective pullback within the broader uptrend.
Support Zone: 9026 – a key level from previous consolidation. Price is currently testing or approaching this level.
A bullish rebound from 9026 would confirm ongoing ups
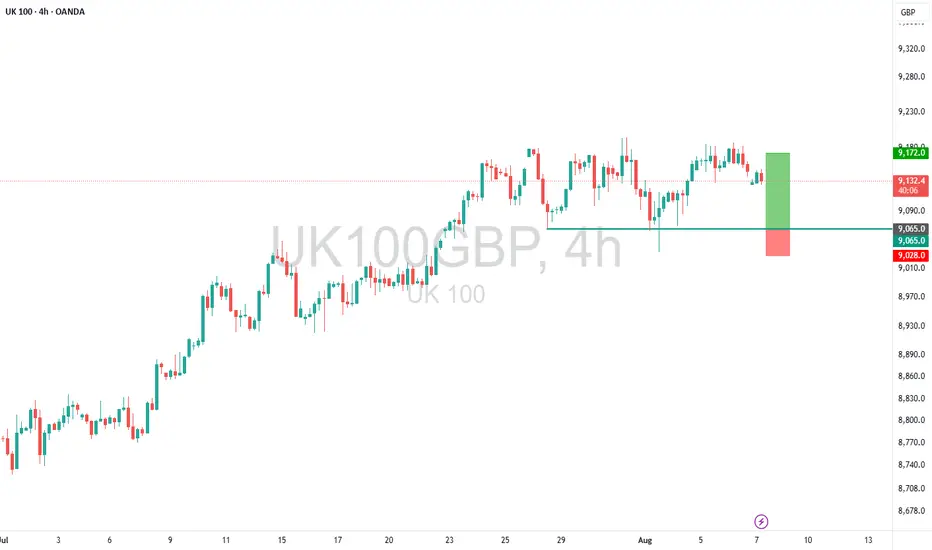
UK100 – Buy into Dip Ahead of BoE VolatilityTrade Idea
Type: Buy Limit
Entry: 9065
Target: 9172
Stop Loss: 9028
Duration: Intraday
Expires: 08/08/2025 06:00
Technical Overview
Price action appears to be forming a top, but short-term bias remains mildly bullish.
Lower correction is expected, presenting an opportunity t
FTSE oversold bounce backThe FTSE remains in a bullish trend, with recent price action showing signs of a corrective pullback within the broader uptrend.
Support Zone: 9026 – a key level from previous consolidation. Price is currently testing or approaching this level.
A bullish rebound from 9026 would confirm ongoing ups

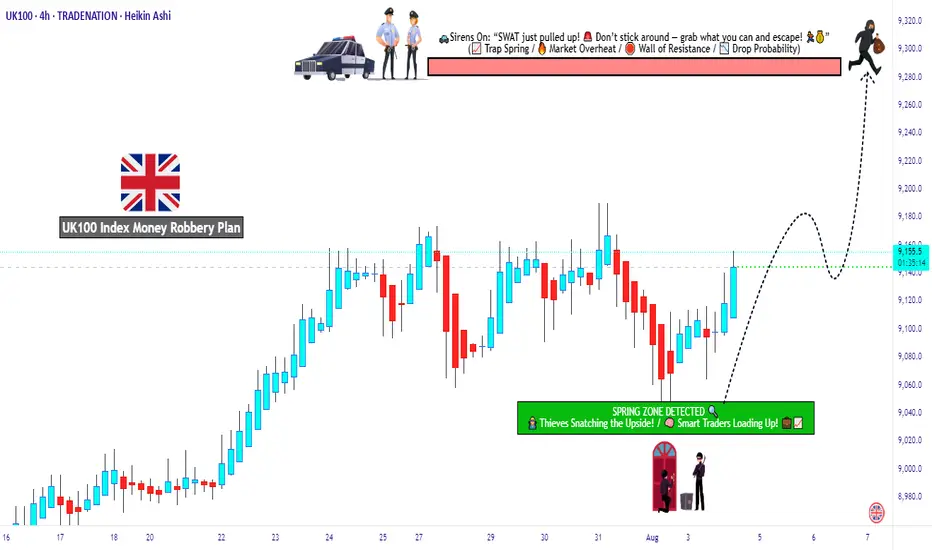
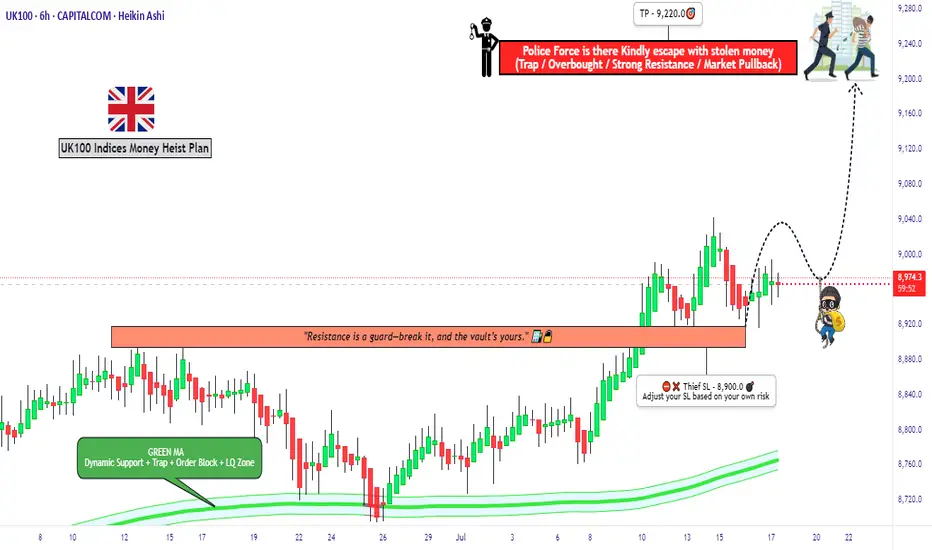
Is UK100 Setting Up the Cleanest Bull Robbery This Week?🏴☠️💹“UK100 Bullish Bank Job Heist 🧠💰” – Thief Trader Limit Order Operation 🚨📊
📢 Calling all stealthy traders, market pirates, and strategic looters! The vault is open, and the FTSE100 (UK100) index is now under our radar for a planned bullish extraction. This ain’t no regular trade — this is a Thie
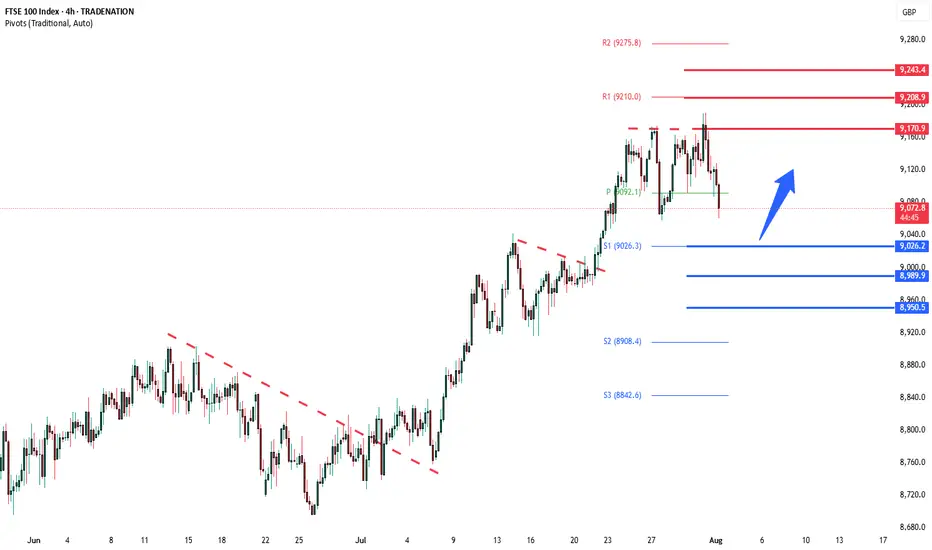
FTSE deeper corrective pullback supported at 9026The FTSE remains in a bullish trend, with recent price action showing signs of a corrective pullback within the broader uptrend.
Support Zone: 9026 – a key level from previous consolidation. Price is currently testing or approaching this level.
A bullish rebound from 9026 would confirm ongoing ups
UKX Trending UpUKX bullish continuation.
It could pull back to 8900 and continue with the Head and Sholder pattern on the weekly time scale with a price target of 9975.
Pattern and breakout confirmed.

UK100 - TIME TO DESTRUCTION UK TO HELLTeam, UK100 market is tank,
the economy is SH*T, not in a great shape
unemployment rising, crime increasing, jobless
inflation is out of control, but the market has not recognised the effect.
TIME TO PUT AN END TO THIS ERA - short range at 9175-9186
STOP LOSS AT 9225
EASY target 1 at 9152-42 - tak

"UK100 Bulls Vault Open! Grab the Loot & Escape Early"🏴☠️💰"UK100 / FTSE100 Market Heist Blueprint" – A Thief Trading Operation for High-Profit Target Extraction 💼📈
🌍 Hola! Hi! Bonjour! Ola! Hallo! Marhaba!
To all the Market Robbers, Smart Thieves, and Strategic Money Makers — welcome to another Thief Trading Heist Plan™.
Ready your gear and charts —
UK 100 – Moving Back Into the Spotlight It’s been a while since we covered the UK 100, but it feels like recent moves and the fact there is a Bank of England (BoE) rate decision next Thursday (August 7th) means it warrants some extra attention.
For much of 2025 the UK 100 has been the under achiever when compared to other European indic

FTSE bullish sideways consolidation capped at 9185The FTSE remains in a bullish trend, with recent price action showing signs of a corrective sideways consolidation within the broader uptrend.
Support Zone: 9066 – a key level from previous consolidation. Price is currently testing or approaching this level.
A bullish rebound from would confirm on

See all ideas
Displays a symbol's price movements over previous years to identify recurring trends.
Frequently Asked Questions
UK100 Future reached its highest quote on Jul 31, 2025 — 9,181.65 GBP. See more data on the UK100 Future chart.
The lowest ever quote of UK100 Future is 6,711.60 GBP. It was reached on Oct 13, 2022. See more data on the UK100 Future chart.
UK100 Future is just a number that lets you track performance of the instruments comprising the index, so you can't invest in it directly. But you can buy UK100 Future futures or funds or invest in its components.