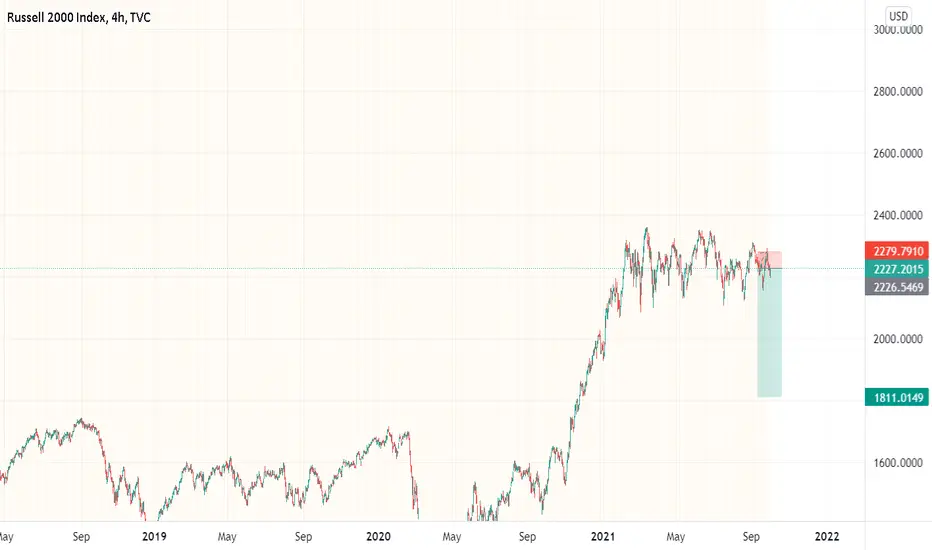
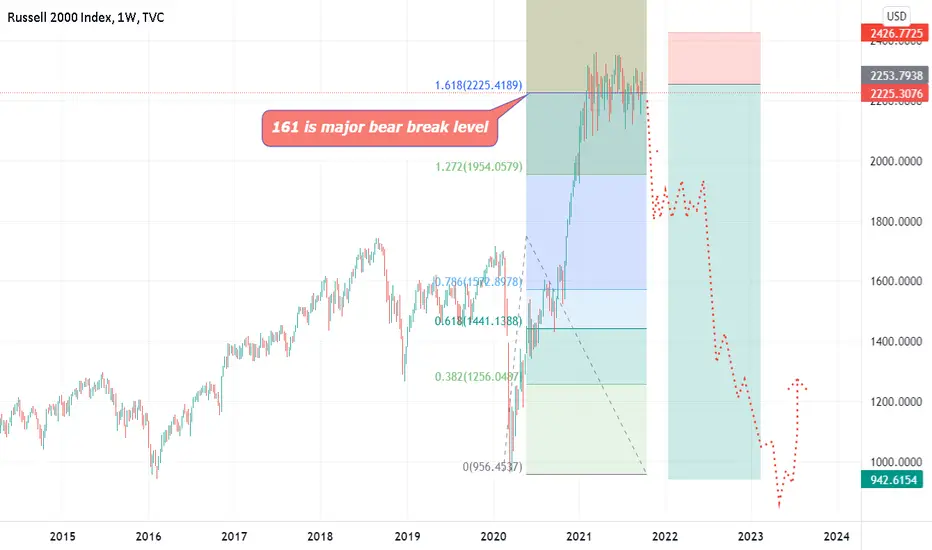
RUT bearish ending diagonal? We've been watching the 161 extension level on the RUT for 6 months now. It's interesting that the stocks that have been most volatile mainly come from an index that has traded essentially flat. We think a major breakout will come from this RUT range.
A big decision is to be made in RUT from this area. It's starting to look like the range is becoming an ending diagonal and we're already into the early - subtle - part of the breaking of this.
US2000 trade ideas

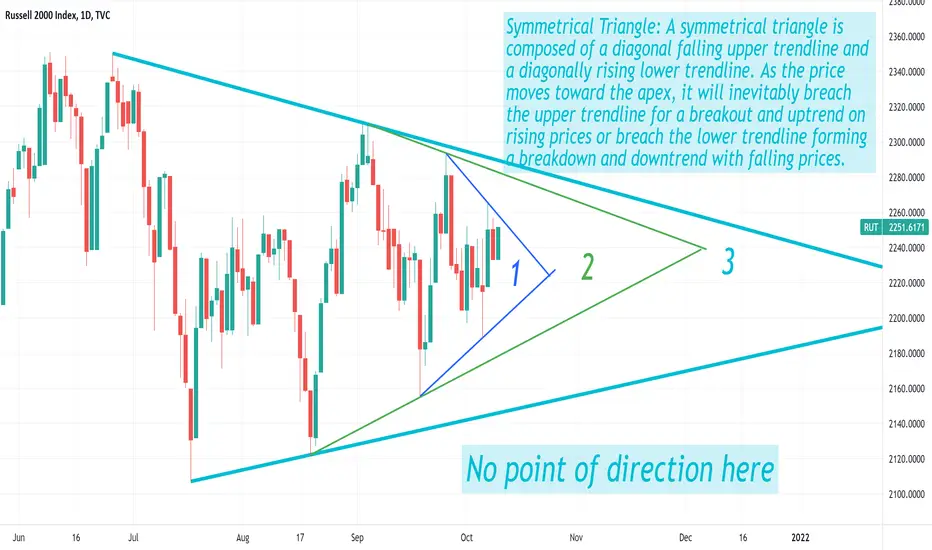
RUT is kind of cornered pretty tight, 3 symmetric triangles !What Is a Triangle?
A triangle is a chart pattern, depicted by drawing trendlines along a converging price range, that connotes a pause in the prevailing trend. Technical analysts categorize triangles as continuation patterns.
KEY TAKEAWAYS
In technical analysis, a triangle is a continuation pattern on a chart that forms a triangle-like shape.
Triangles are similar to wedges and pennants and can be either a continuation pattern, if validated, or a powerful reversal pattern, in the event of failure.
There are three potential triangle variations that can develop as price action carves out a holding pattern, namely ascending, descending, and symmetrical triangles.
Type of Triangles
1/ Ascending Triangle: An ascending triangle is a breakout pattern that forms when the price breaches the upper horizontal trendline with rising volume. It is a bullish formation. The upper trendline must be horizontal, indicating nearly identical highs, which form a resistance level. The lower trendline is rising diagonally, indicating higher lows as buyers patiently step up their bids. Eventually, the buyers lose patience and rush into the security above the resistance price, which triggers more buying as the uptrend resumes. The upper trendline, which was formerly a resistance level, now becomes support.
2/ Descending Triangle: A descending triangle is an inverted version of the ascending triangle and considered a breakdown pattern. The lower trendline should be horizontal, connecting near identical lows. The upper trendline declines diagonally toward the apex. The breakdown occurs when the price collapses through the lower horizontal trendline support as a downtrend resumes. The lower trendline, which was support, now becomes resistance.
3/ Symmetrical Triangle: A symmetrical triangle is composed of a diagonal falling upper trendline and a diagonally rising lower trendline. As the price moves toward the apex, it will inevitably breach the upper trendline for a breakout and uptrend on rising prices or breach the lower trendline forming a breakdown and downtrend with falling prices.Traders should watch for a volume spike and at least two closes beyond the trendline to confirm the break is valid and not a head fake. Symmetrical triangles tend to be continuation break patterns, meaning that they tend to break in the direction of the initial move before the triangle formed. For example, if an uptrend precedes a symmetrical triangle, traders would expect the price to break to the upside.
US Russell Momentum strategy that solves 80% of your problemsMarket phases - Price Action
The market can only go in three directions:
1. up,
2.down,
3. sideways.
With high / low defined, we can use several charts to identify these market phases and start a simple search for our Swing Highs and Swing
Lows.
In short:
• the market rises when price makes higher highs and higher lows.
• the market goes down when the price makes lower highs and lower lows,
• The market goes sideways when price does not make higher highs and higher lows or lower highs and lower lows.
It may sound childishly simple, almost like stating something obvious, but
you will be amazed how often people forget these simple facts. One
the most important question is: "Where is the market going?"
A trend shift to a downtrend occurs when we see the following
sequence:
The change of direction is confirmed when price drops below the last lows
(as seen in the chart above). Otherwise
speaking, this is a 1-2-3 reversal - you go short (sell) after
correction at the level of the average price

RUT swing short trade: 7th October 2021RUT is one of my favourites for OTM swing puts on. With it having traded range bound for so long there's potential for a big increase in IV if we breakout under the lows and head into a sharp drop.
Short entry 2260
Stop 2318
Target 1845

Retrace to 2207 then surge northMulti Timeframe Analysis
Hint: Bullish direction after retracement
Recommendation: Confident long
COVID fears depressed the SP500 but the bearish 200 period EMA is now being broken. Except the price to retest the 61% fibonacci level (2207) before moving up north to 2267 or the -61.8 Fibonacci.
MARKET ORDER RULES
Market order position upon the confluence of valid entry rules on the 4H or 1H chart.
-=ENTRY RULES=-
Trading philosophy: Don’t short at the lowest of the bearish momentum nor do we long at the peak of a bullish impulse. The safest entries are at the end of a retrace on the 38.2%, 50%, 61.8% or 78.6% fibonacci back in the direction of the master trend.
Note: I use Daily/4H or 4h/1H market structures with wave analysis to prep for potential entries. The RSI , MACD and EMA indictors are confirmation for entries at the 4H or 1H timeframe
For SHORT:
4H chart should confirm that the bullish retrace had turned bearish in the direction of master trend. The MACD should have dropped below zero signifying a bearish environment. Price would have dropped below the 10 and 20 EMA . For good measure, check that the 4h and D1 RSI is below the 50 signal line
For LONG:
4H chart should confirm that the bearish retrace had turned bullish in the direction of the master trend. The MACD should have gone above zero signifying a bullish environment. Price had gone above the 10 and 20 EMA . For good measure, check that the 4h and D1 RSI is above the 50 signal line
About me
I am not a financial advisor nor a signal provider. These are the opinions of a 20-year private trader in the legal profession as well as a businessman diversified in the tech and hospitality industries. My favored tools of the trade include wave analysis, price action on the 4H to Weekly timeframes and institutional order flow.

Russell 200 a Pure sideway..!at the first look, it is pure sideways, and not good for trade!
But you can fit a sine wave into this chart and because of the 10-12% range, it could be a good trading setup at the extreme points!!!
Watch it closely in the next 2-3 weeks for a potential buy opportunity!

RUSSELL BREAK COMING SOON!!The Russell 2000 has been in a year long consolidation pattern - w/ price finding supply above 2315 & demand below 2165 - We are currently opening the month inside last months & last quarters value - which makes price action neutral at the moment - BUT price held up well durning this latest equity selloff showing some relative strength & a possible short term higher low - looking for a break & buildup above 2257 top setup for another test of the highs w/ probability of finally breaking out of this range increasing - however price action below this months open should b considered negative and any bullish setups would have to wait till we move back above.
Watch & see how it plays out!!!

RUT (Russell 2000 ETF) - Resistance, Support, Trend - 09/05/21RUT has been consolidating between $2123.55 and $2348.03, for this year 2021.
Bullish scenario:
-RUT price breaks up above resistances to new all-time-highs.
-Resistance levels: $2348.03, $2392.66.
Bearish scenario:
-RUT price pulls back down to test supports below (horizontal and trendline supports).
-Support levels: $2240, $2123.55, $2060.54.
Note: On the Weekly chart, RUT price has always been consolidating sideways for 2021.


US2000 Up move continue bounce off trendlineUS2000 Up move continue bounce of trendline. Short term and long term limits

RUT swing short Shorting RUT looking for the big support break some time this week/next week. If we break I think we're into a really strong swing down.
RUT swing short Wide stop losses here can be above the last high at 2476. Using intra-week/day timeframes can offer much higher risk:reward setups. If a break is made it should be fairly easy to build up a short position in the developing downtrend.
Is Another Move Coming for the Russell 2000?The Russell 2000 had a sharp rally in late 2020 and early 2021. Now it may be setting up for a similar move.
Notice the triangle forming on the small cap index recently, which is interesting for two reasons.
First, it shows that prices are squeezing into a range. Ranges can be followed by breakouts.
Second, it shows that RUT made a higher low in September versus August. This is noteworthy because the S&P 500, Nasdaq-100 and Dow Jones Industrial Average all made lower lows this month. Higher lows and modest drops amid periods of volatility are signs of accumulation and relative strength.
Speaking of relative strength, this chart shows how RUT’s relative strength has improved since mid-September. (See our Smart Relative Strength script.)
Next, the small-cap index has been holding support at its rising 200-day simple moving average (SMA).
Finally, the macro backdrop may favor RUT as interest rates rise and investors pivot back toward cyclical reopening stocks. Traders may want to keep a close eye on this chart for a potential breakout if the broader market stabilizes.
TradeStation is a pioneer in the trading industry, providing access to stocks, options, futures and cryptocurrencies. See our Overview for more.

RUS2000USD continuing down side afterRUS2000USD continuing down side after an abc flat correction. Limit is at daily support.

RUT short trade Things can get really interesting for the RUT if we break under this range we've held in for the last 6 months.

Russell 2000 will tell us if melt-up in Nasdaq continues...Look for Russell breaking out to upside or downside.

RUSSELL 2000 hourly chartRUSSELL 2000 hourly chart
Buy around 2156
First target 2214.20
Second target 2,250.50
Stop Loss Daily Close Below 2141.00

RUT swing short Rut's ranged in the same area for over 6 months now and might be starting to break. We currently have a butterfly pattern and what can turn into a head and shoulders with a flat neckline. Brutal breaks come from those when they come to pass.

RUT short Like SPX (Linked) RUT shows downtrending properties and is deep into where a retrace would be expected to end. Entering short.

The market is talking. Can YOU hear it?Pareto's law says that roughly the top 20% of the market constituents should roughly represent 80% roughly of the overall market cap, and vice versa: the bottom 80% of constituents will represent 20% of the overall market cap.
When price seems irrational, and higher cap stocks start to represent more of the market than previous decades, and thus are given a higher weight in the major indices, it can be very useful to look at a large portion of the bottom 80% to get a more rational prospect of market value.
Russell 2000 represents many small and mid cap stocks, which are mostly given low weights in large portfolios and indices, compared to larger cap stocks such as TSLA or the FAANG stocks.
We get an interesting peek at the overall market value if we look at these companies in the median of the market, in addition to accounting for money supply expansion.
We can see that if we account for inflation, the relativity of the money supply in relation to the Russell 2000 has always topped out at about where it is now, in the past 20 years.
The price seems to be disconnected from value at the moment, off by a factor of 2 or 3. For the larger caps that are not included in this index, this overpriced factor is probably larger, maybe 5 or 10, given the current conditions of an irrationally large-cap dominated market.
Let me know what you think.
Do you think the dip of 1200 in 2020 was a valid retest?
Or was it just forced participation, coercion by the FED?
Do you think that, given such coercion, we're in for a further lower retest when said coercion becomes less effective?
Cheers


US-market correction ahead of us?Discussed is our weekly update of the risk model for the US market.
Price action of the major US market indices and relevant indicators advise caution.
See our homepage for daily updates on trading recommendation for the major US-market indices and ETF's:
www.js-techtrading.com

Russell 2000, longWe have green candle confirmation on current support line. Target: yellow channel upper line (2360$). Stop loss: yellow channel middle line 2238$
