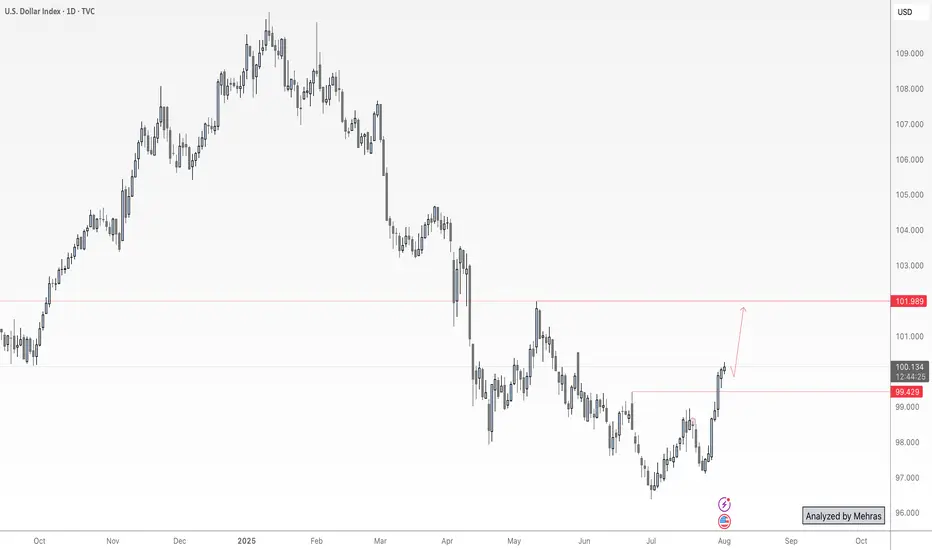
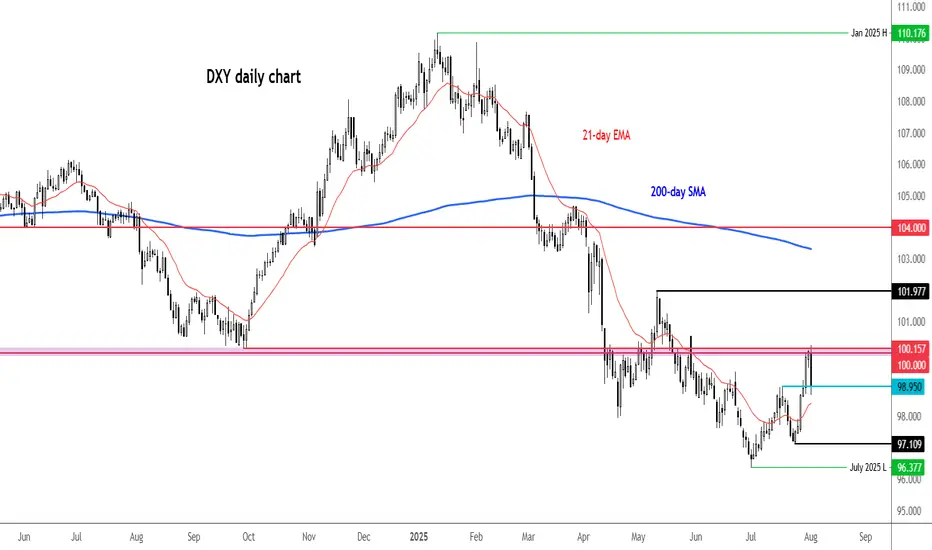
DXY Just Broke Through the Lock… Where’s the Market Headed Now?🌅 Good Morning, Friends!
A few days ago, I marked 98.950 as a key threshold for the DXY index. As of today, that level has officially been broken—and the bullish momentum we anticipated is now kicking in. 📈
The next target? 101.000.
That said, it’s crucial to remember: DXY is heavily influenced by fundamental data. Stay alert and keep a close eye on key economic developments—they’re essential for navigating this move.
This breakout validates the analysis I shared with you all. And it wasn’t just about charts—it was about discipline, precision, and timing.
Every single like from you is a huge boost to my motivation. Thanks from the heart—your support drives me to keep sharing these insights! 💙
USDX trade ideas

NFP Volatility Ahead – Is the Dollar Ready to Break Higher?🟢 DXY Outlook – A Key Day for the Dollar Index
Yesterday’s monthly candle closed with strong bullish momentum, marking a powerful start to August. Today, on the first trading day of the month, we’re expecting three major U.S. economic releases:
NFP, Average Hourly Earnings (m/m), and the Unemployment Rate.
As discussed in last week’s outlook, DXY has successfully broken above the key 100 level and confirmed a monthly close above it — a significant technical development. With no major order blocks or visible resistance in the way, the path toward the 102 target appears technically clear.
That said, I anticipate mixed data from today’s releases — which means we could see both sides of liquidity being taken during the initial reaction. Price might dip toward lower zones temporarily to collect liquidity before resuming its bullish move toward 102.
📌 In summary:
From a swing perspective, I believe the direction remains bullish for the Dollar Index as long as we hold above the 100 level.
When I say the data might be “mixed,” I mean the market could show an initial drop toward lower zones at the time of release — not because of a reversal, but to grab liquidity before continuing higher toward the 102 target.
Unless we see something unexpectedly extreme in the numbers, I expect the DXY to remain on track to reach the 102 level in the coming days or next week.
🔁 This analysis will be updated whenever necessary.
Disclaimer: This is not financial advice. Just my personal opinion.
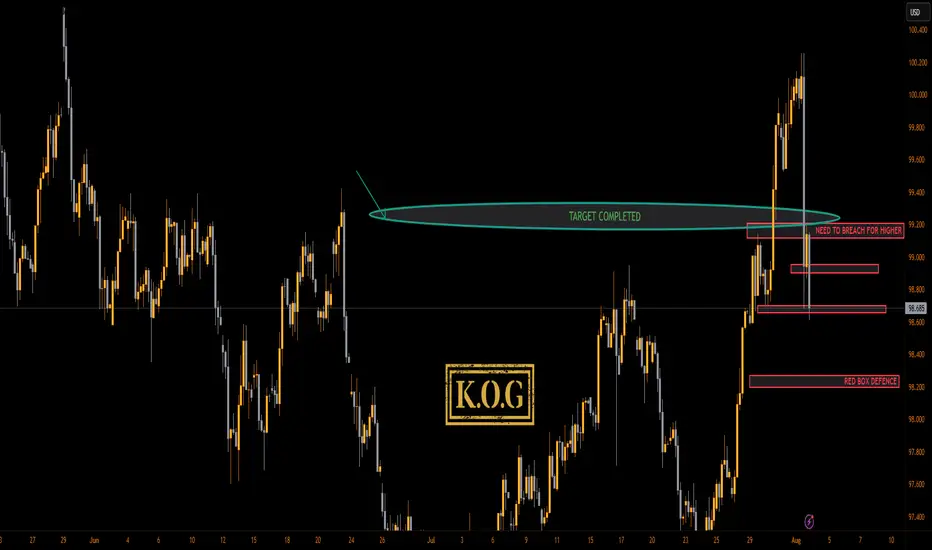
KOG - DXYDXY
As we can see here we've hit and breached the target level we gave a few weeks ago on the dollar. We're now at a red box level that can cause a temporary tap and bounce unless it's broken, so we'll keep an eye on this.
As always, trade safe.
KOG
DXY Bulls Ready — Can Powell Spark the Rally?📊 DXY Pre-FOMC Outlook
In my previous analysis released on Monday, I expected the Dollar Index to fill the gap around the 98.60 zone and range below the key red line at 99.429.
Now, with less than 8 hours left until the highly anticipated FOMC rate decision, it’s time to take a closer look at tonight’s event and what it could mean for the markets.
From a purely technical perspective — setting the news aside — the Dollar Index looks ready to break through the crucial 100 level and kick off a strong bullish rally.
However, recent political pressure from Trump urging rate cuts, along with visible tension between him and Fed Chair Jerome Powell, has created uncertainty. If it weren’t for these conflicting signals, I would’ve confidently expected a clean breakout above 100.
As much as I enjoy trading news-driven events, I’ll likely stay out of the market tonight and observe from the sidelines. The setup is tempting, but the dual narratives make it risky.
That said — if you ask for my final take — I believe the stage is fully set for a bullish dollar and a corresponding drop in gold, EUR, GBP, and other major assets.
Let’s see how it plays out. 👀💥

Dollar I Weekly CLS I Model 2 I Ready for pullbackYo Market Warriors ⚔️
Fresh outlook drop — if you’ve been riding with me, you already know:
🎯My system is 100% mechanical. No emotions. No trend lines. No subjective guessing. Just precision, structure, and sniper entries.
🧠 What’s CLS?
It’s the real smart money. The invisible hand behind $7T/day — banks, algos, central players.
📍Model 1:
HTF bias based on the daily and weekly candles closes,
Wait for CLS candle to be created and manipulated. Switch to correct LTF and spot CIOD. Enter and target 50% of the CLS candle.
For high probability include Dealing Ranges, Weekly Profiles and CLS Timing.
Trading is like a sport. If you consistently practice you can learn it.
“Adapt what is useful. Reject whats useless and add whats is specifically yours.”
David Perk aka Dave FX Hunter
💬 Don't hesitate to ask any questions or share your opinions

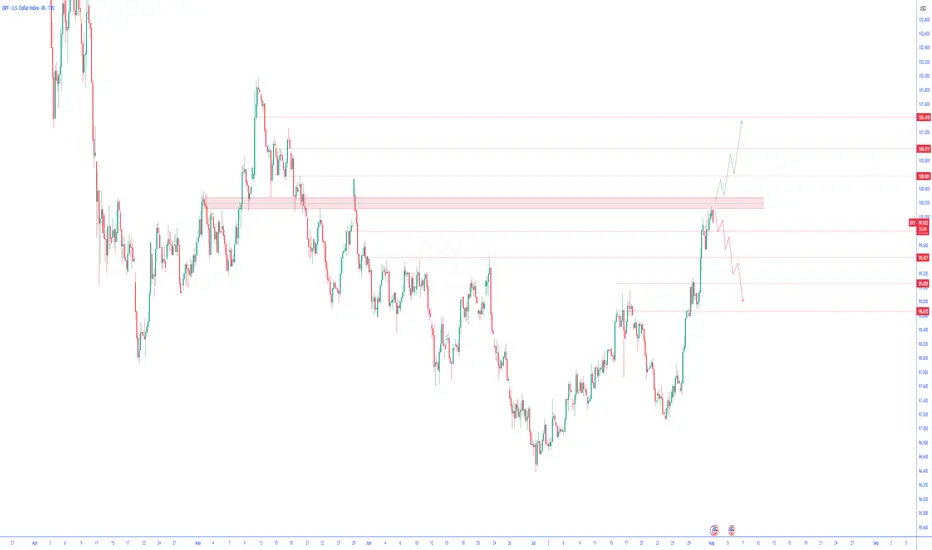
DXY: Weekly OutlookWeekly DXY Outlook
On the weekly chart, the US Dollar Index (DXY) has reached a critical zone that was last tested in February 2022.
While a rebound is not guaranteed, the fact that the DXY has declined nearly 12% over just six months—despite a resilient U.S. economy—suggests the potential for renewed strength in the dollar.
I think the index could begin a recovery toward key levels at 100.00, 101.97, and possibly 106.00/
It’s worth noting that the broader bearish trend began with the trade tensions initiated during the Trump administration, which strained relations with several major trading partners.
Given that this is a weekly chart, it should be used more as a reference point rather than a trading signal.
You may find more details in the chart!
Thank you and Good Luck!

3rd August 2025 Daily Analysis For DxyDAILY DXY ANALYSIS FOR 3RD AUGUST 2025. Looking to see this setup play out completely on DXY . Will be focused on selling Gu and EU when the DXY setup start playing out

Dollar Index (DXY): Will It Rise More?!
Dollar Index is on its way to 100.4 resistance.
A breakout of a major supply cluster on a daily after FED meeting
yesterday indicates a strong bullish pressure.
I think that growth will continue soon.
❤️Please, support my work with like, thank you!❤️

Bullish on The US Dollar Currently short term bullish on the dollar until it gets to the orange box. A retracement lower to accelerate the move higher is permitted. Let's see how this unfolds in the coming weeks

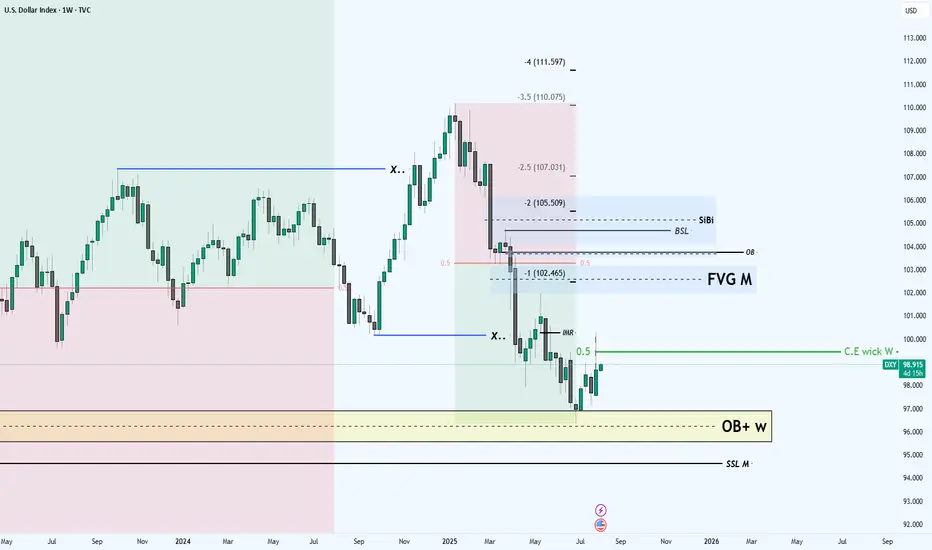
future of the DXYHi to every one
In the DXY we are in the middle of the decisioning area which means
we should wait for the market to show its hands
First sensitive level that i am looking for is the C.E of the weekly candle(Prev.week)
IF we get resistance at that level we can wait for the price to deep into the SSL M level
Other wise i don't see any indication and obstacle for the DXY to reach the OB level above the 0.5 mid level of the range
this is my the first low hanging fruit objective which is high probability
after that my ultimate objective is the SiBi to be rebalanced
This was the technical perspective
BUT
things are happening around the world the most important one is the
USA central bank Interest Rate Cutting Decision which can leads the DXY to go lower without retracting to the 0.5 of the range
this factor also should be considered BUT overall i am bullish for DXY
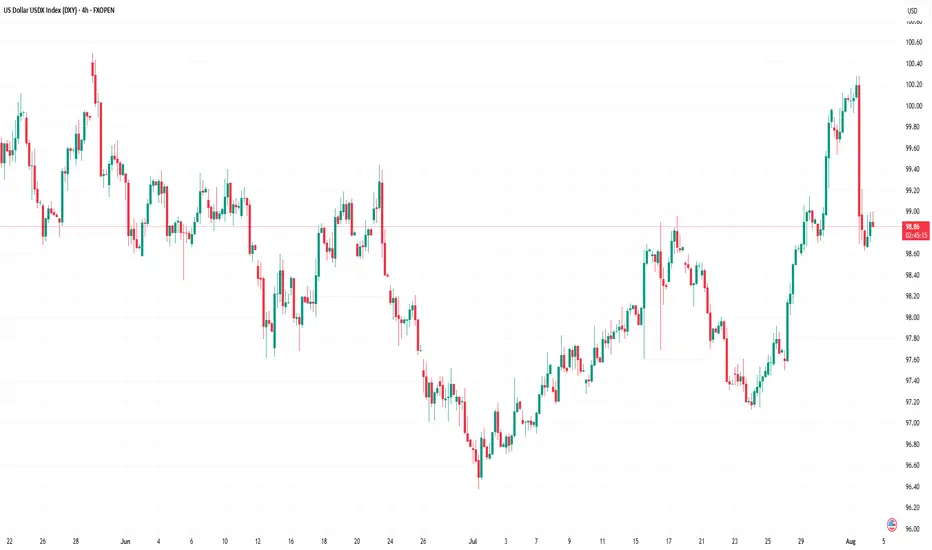
US Dollar Index (DXY) Plummets Following Labour Market DataUS Dollar Index (DXY) Plummets Following Labour Market Data
The US Dollar Index (DXY) fell by approximately 1.4% on Friday after the release of disappointing US labour market figures. According to Forex Factory:
→ The unemployment rate rose from 4.1% to 4.2%;
→ The Nonfarm Employment Change figure came in at 73K, well below the forecast of 103K. This is the lowest level of job creation in the nonfarm sector in 2025 and is roughly half the previous month’s reading (prior to revisions).
→ Furthermore, revisions for May and June were significantly more severe than usual. The May figure was revised downward by 125,000 — from +144,000 to +19,000. Similarly, the June figure was revised down by 133,000 — from +147,000 to +14,000.
These results point to a weakening labour market, which increases the likelihood of a rate cut aimed at supporting economic growth. In turn, expectations of a Fed rate cut are acting as a bearish driver for the US dollar.
Technical Analysis of the DXY Chart
Six days ago, we highlighted two U-shaped trajectories (A and B), which together formed a bullish сup and рandle pattern on the US Dollar Index chart.
Following this, price action generated a notable upward impulse (as indicated by the arrow), breaking through the upper boundary of the pattern.
However, Friday’s news triggered the following developments:
→ A new top (4) was formed on the chart, accompanied by a false bullish breakout above the psychological level of 100.00;
→ The price declined to the 98.80 area. The downward move slowed here, as this zone had previously seen strong bullish activity during the breakout from the pattern’s upper boundary — likely explaining why the market is finding support here on Monday morning.
Overall, the technical picture has shifted towards a bearish outlook. Friday’s peak continues the summer sequence of lower highs and lows: 1 → 2 → bottom of pattern (A) → 4. This structure is part of a broader downtrend that has defined the market in 2025.
Should bearish sentiment persist, fuelled by Friday’s data, we can assume a further decline in the US Dollar Index towards the median line of the descending channel (shown in red), which has been drawn through the aforementioned price extremes.
This article represents the opinion of the Companies operating under the FXOpen brand only. It is not to be construed as an offer, solicitation, or recommendation with respect to products and services provided by the Companies operating under the FXOpen brand, nor is it to be considered financial advice.
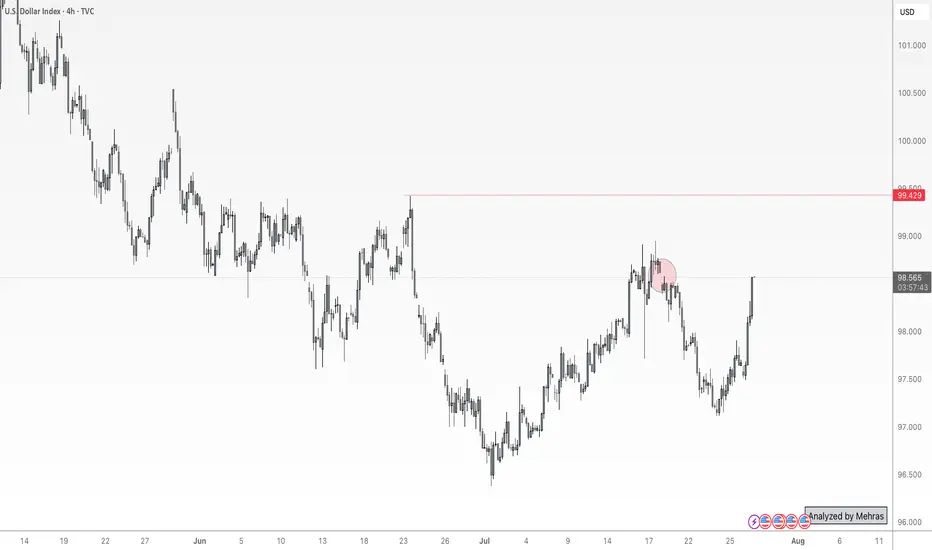
U.S. Dollar Index (DXY) Technical Analysis – 4-Hour TimeframeU.S. Dollar Index (DXY) Technical Analysis – 4-Hour Timeframe
Following yesterday’s economic data from the United States, which included stronger-than-expected GDP growth and consumer confidence figures, the U.S. Dollar Index (DXY) has continued its upward trend with strength. These developments have reinforced expectations for continued monetary tightening—or at least keeping interest rates elevated—which in turn has boosted demand for the dollar.
On the 4-hour chart, after a strong bullish rally, the dollar index has now reached a key resistance zone that previously acted as a major barrier.
Bullish Scenario:
If the current resistance zone is decisively broken and price stabilizes above it, the bullish momentum could extend further toward higher technical levels. This scenario would gain additional strength if upcoming economic data continues to support the dollar.
Bearish Scenario:
However, if the price fails to break through the resistance and signs of buyer weakness begin to emerge, a corrective pullback toward previous support levels may occur. This scenario could be further intensified if weaker economic data is released or if the Federal Reserve signals a more dovish stance.
At the moment, traders are advised to closely monitor the price reaction to the current zone and wait for confirmation before committing to the next move.
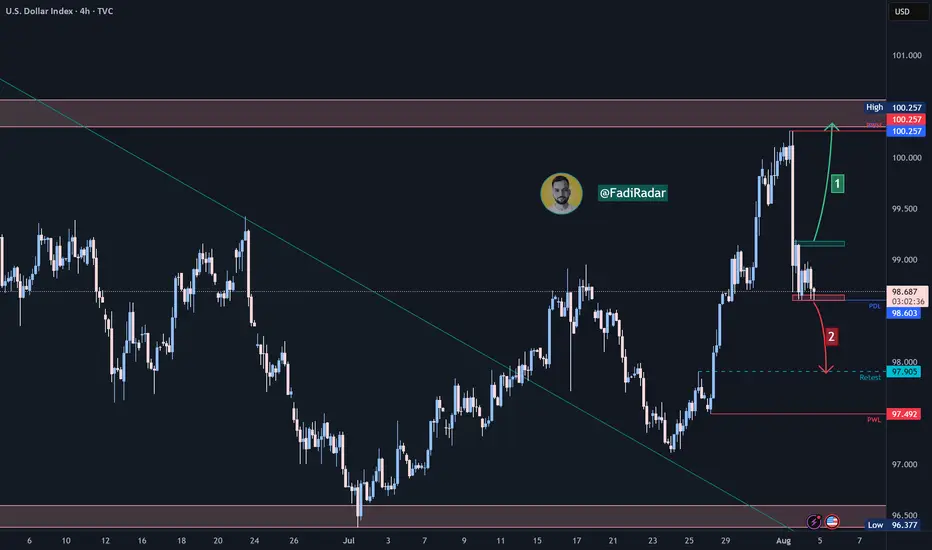
US Dollar Index (DXY) Technical Analysis:The DXY is currently moving sideways near the 98.65 support zone after a sharp drop from the 100.25 resistance, which marked last week’s high.
🔹 Bearish Scenario:
If the price breaks below 98.65 and holds, a continuation toward 97.90 is likely, with potential to reach the 97.50 support area.
🔹 Bullish Scenario:
If the price reclaims 99.00 and confirms support above it, we could see a retest of the 99.50–100.25 resistance zone, which remains key in the short term.
⚠️ Disclaimer:
This analysis is not financial advice. It is recommended to monitor the markets and carefully analyze the data before making any investment decisions.
DXY Top-Down Analysis: Market Structure & Directional Bias This video demonstrates a top-down analysis of DXY. I'll show you how to identify market structure, value areas, directional bias, and key support and resistance levels. You'll learn to analyze the market from weekly to hourly timeframes using Heikin-Ashi candles and the 200 EMA.

DXY USDOLLAR CRASH Incoming!Long-term fundamentals are bearish
Long-term sentiment = bearish
Long-term technicals = bearish
Trump wants a weaker dollar + FED injecting endless amounts of cash into the markets
driving stocks/ gold up, and the dollar down, losing purchasing power.
My plan is to look for shorts on the 1hr-4hr timeframe with lower timeframe confirmation.
Once price starts turning over, day-traders can join in.
Agree or disagree?

DXY: USD Flexes Muscle - Pairs SlideFriday, July 25, 2025
The foreign exchange markets are experiencing a pronounced USD bullish session this morning, with the US Dollar Index (DXY) showing robust gains of +0.35% while simultaneously pressuring all major currency pairs into negative territory. The Japanese Yen (JPY) is bearing the brunt of this dollar strength, currently registering losses between -0.4% to -0.66% across JPY pairs. This market behavior suggests traders should pay particularly close attention to DXY dynamics, as its movements will likely dictate price action across all major currency pairs in today's session.
Technical Perspective: DXY at Critical Inflection Point
A detailed examination of the Dollar Index reveals several compelling technical factors that market participants should consider:
1. Weekly Demand Zone Reaction
- The DXY has demonstrated a strong rejection from a significant weekly demand area
- The subsequent bullish spike indicates potential continuation of upward momentum
- This price action suggests institutional buyers are defending this key level
2. Commitment of Traders (COT) Report Insights
Non-commercial traders (typically hedge funds and speculators) have increased their positions from a bottom level not seen since June 2021 meanwhile the Commercial traders (often corporations hedging FX exposure) show opposing extreme positioning. This stark divergence between trader categories often precedes significant market moves
3. Seasonal Patterns Favor USD Strength
- Historical seasonal analysis indicates the current period typically supports dollar appreciation
- The combination of technical and seasonal factors creates a potentially powerful bullish setup
✅ Please share your thoughts about DXY in the comments section below and HIT LIKE if you appreciate my analysis. Don't forget to FOLLOW ME; you will help us a lot with this small contribution.

US Dollar Index: Was Friday the Start of a Pullback Or Reversal?Welcome back to the Weekly Forex Forecast for the week of Aug 4 - 8th.
In this video, we will analyze the following FX market:
USD Index
The DXY had a strong week, but turned bearish Friday on weak jobs numbers. Was this just a retracement from the impulsive move up? Will price now find support for another bullish leg?
It all comes down to the +FVG, whether it holds or folds.
Look for price to continue down to discount prices early in the week... and then find it's footing on support.
Enjoy!
May profits be upon you.
Leave any questions or comments in the comment section.
I appreciate any feedback from my viewers!
Disclaimer:
I do not provide personal investment advice and I am not a qualified licensed investment advisor.
All information found here, including any ideas, opinions, views, predictions, forecasts, commentaries, suggestions, expressed or implied herein, are for informational, entertainment or educational purposes only and should not be construed as personal investment advice. While the information provided is believed to be accurate, it may include errors or inaccuracies.
I will not and cannot be held liable for any actions you take as a result of anything you read here.
Conduct your own due diligence, or consult a licensed financial advisor or broker before making any and all investment decisions. Any investments, trades, speculations, or decisions made on the basis of any information found on this channel, expressed or implied herein, are committed at your own risk, financial or otherwise.

DXY ShortDXY is likely to fall from $99.8 upon reaching it, based on the Crab Pattern, potentially reaching targets TP #1 - TP #2.

DXY LONGi am looking to go long on DXY from this level of breaker block.. a possible pullback to this level we will engage on the buy and use itr as cross reference for our dollar pairs ..

DXY BULLISH coming weeks Dxy is oversold, and what goes down must go up. Price did a nice retracement, setting up for next week to go higher or the week after, depending on consolidation. For me, DXY will go higher, leaving its cross pairs like EURUSD to go lower.

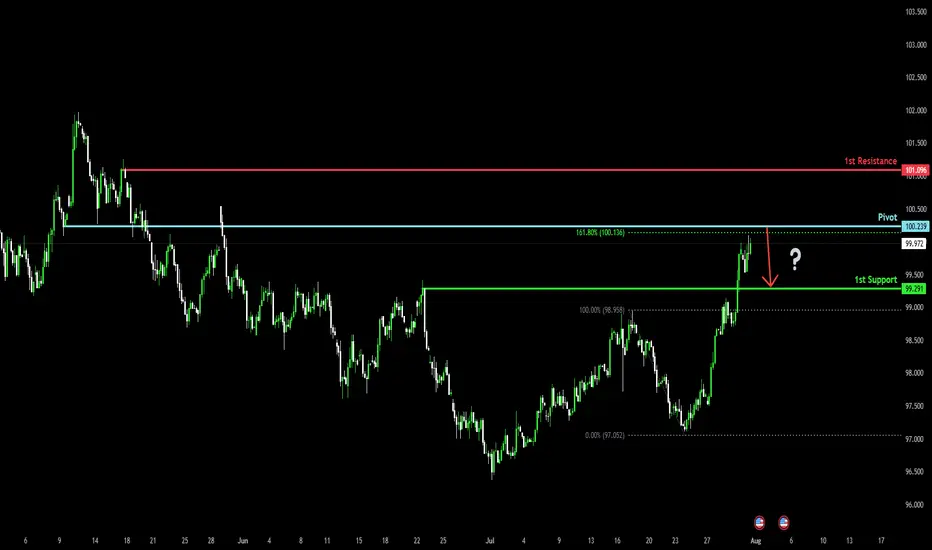
Bearish reversal off overlap resistance?The US Dollar Index (DXY) is rising towards the pivot and could reverse to the 1st support.
Pivot: 100.23
1st Support: 99.29
1st Resistance: 101.09
Risk Warning:
Trading Forex and CFDs carries a high level of risk to your capital and you should only trade with money you can afford to lose. Trading Forex and CFDs may not be suitable for all investors, so please ensure that you fully understand the risks involved and seek independent advice if necessary.
Disclaimer:
The above opinions given constitute general market commentary, and do not constitute the opinion or advice of IC Markets or any form of personal or investment advice.
Any opinions, news, research, analyses, prices, other information, or links to third-party sites contained on this website are provided on an "as-is" basis, are intended only to be informative, is not an advice nor a recommendation, nor research, or a record of our trading prices, or an offer of, or solicitation for a transaction in any financial instrument and thus should not be treated as such. The information provided does not involve any specific investment objectives, financial situation and needs of any specific person who may receive it. Please be aware, that past performance is not a reliable indicator of future performance and/or results. Past Performance or Forward-looking scenarios based upon the reasonable beliefs of the third-party provider are not a guarantee of future performance. Actual results may differ materially from those anticipated in forward-looking or past performance statements. IC Markets makes no representation or warranty and assumes no liability as to the accuracy or completeness of the information provided, nor any loss arising from any investment based on a recommendation, forecast or any information supplied by any third-party.
What now for the dollar after a poor NFP report?It is difficult not to link the bad US data to the impact of tariffs. Indeed, it certainly looks that way, especially given that the slowdown in jobs started in early Q2 when reciprocal tariffs were announced. Companies expecting margins to be squeezed by higher duties probably thought twice about hiring workers in order to keep costs down. So, the US labour market has been losing steam fast, undoubtedly due to tariff concerns. Unless the data surprises on the upside soon, the Fed may have no choice but to cut—and cut again. Against this backdrop, the recovery in the dollar is going to a long bumpy road.
We noted the area around 100.00 to be resistance in the previous update, and that level has held, thanks to the weak jobs report (and ISM survey that was released later). The DXY was testing potential support around 98.95 at the time of writing. Will it be able to bounce there? Break that on a closing basis and next week could bring more technical dollar selling.
By Fawad Razaqzada, market analyst with FOREX.com
DXY at Its Most Critical Level of 2025 — Will the 100 Bank LevelThe Dollar Index (DXY), just like several other majors, is approaching a very important level. We’re now near the 100 mark, which is not only a psychological level — but also a key institutional (bank) level.
There’s also a gap zone left behind that price is about to fill. I believe the index will stay in a range over the next 1–2 days as it waits for critical data later this week — especially Wednesday’s announcements and Friday’s NFP report, which could set the tone for what’s next.
Based on current market sentiment, Trump’s remarks, Powell’s upcoming speech, and broader macro factors, I believe DXY has the potential to break above 100 and move toward 102–104, if that level is broken cleanly.
Let’s also not forget — price bounced from a monthly demand block near 96, and we’re seeing weak support across majors like EUR and Gold. That adds confluence for potential dollar strength.
📌 What do you think — is dollar strength just around the corner?
🔁 This analysis will be updated whenever necessary.
Disclaimer: This is not financial advice. Just my personal opinion.