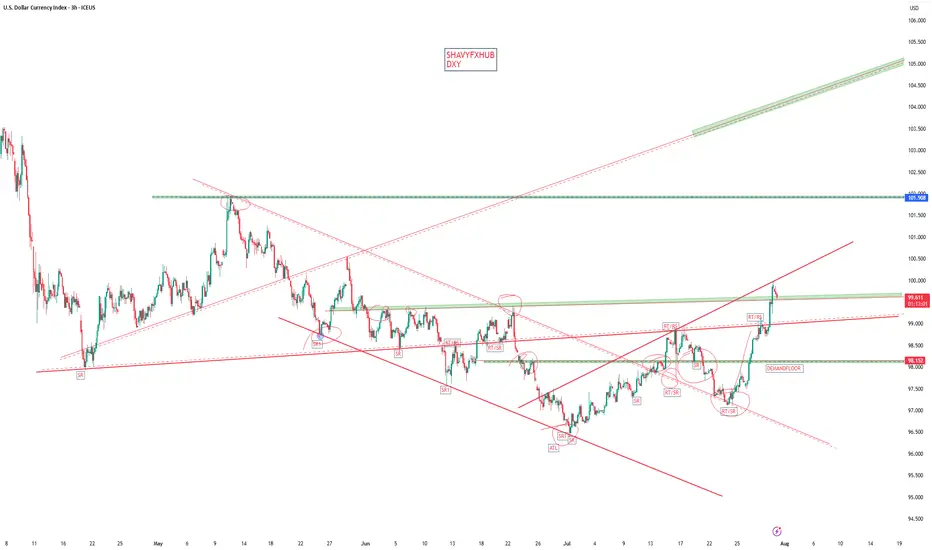
DXY 8H – Rejected Key Resistance, Can the Dollar Bounce Back?The U.S. Dollar Index (DXY) just got rejected off a key 8H supply zone near the psychological 100 level — failing to reclaim a level that previously acted as major support. With EMAs flattening and macro uncertainty rising, the dollar’s next move will have big implications across global markets.
🔹 Price Structure
The $100–$101.50 zone acted as support for months before breaking — and DXY just got rejected on its first retest.
The next resistance levels are stacked at $104, $108, and $110, each tied to prior breakdown points and macro peaks.
If DXY can't reclaim $100, a slide toward EMA support at ~$98 or even new lows remains in play.
🔹 EMA Signals
Price currently hovers between the EMA 50 and EMA 100 — an indecision zone often preceding trend continuation or reversal.
A breakdown below both EMAs would confirm momentum is stalling, while a reclaim of $100 could reignite the bullish push.
🔹 Implications for Risk Assets
If the dollar weakens from here, we could see renewed upside in crypto and equities.
Conversely, a reclaim and surge toward $104+ would likely pressure risk-on markets.
Is the DXY topping out — or just gearing up for another leg higher?
Let’s talk macro 👇
USDX trade ideas

DXY Outlook – From Bias to Execution Previous day closed bearish from a known supply zone, leading to a sell bias, Narrowing down to the 1H timeframe, I identified a familiar bearish flag price action pattern.

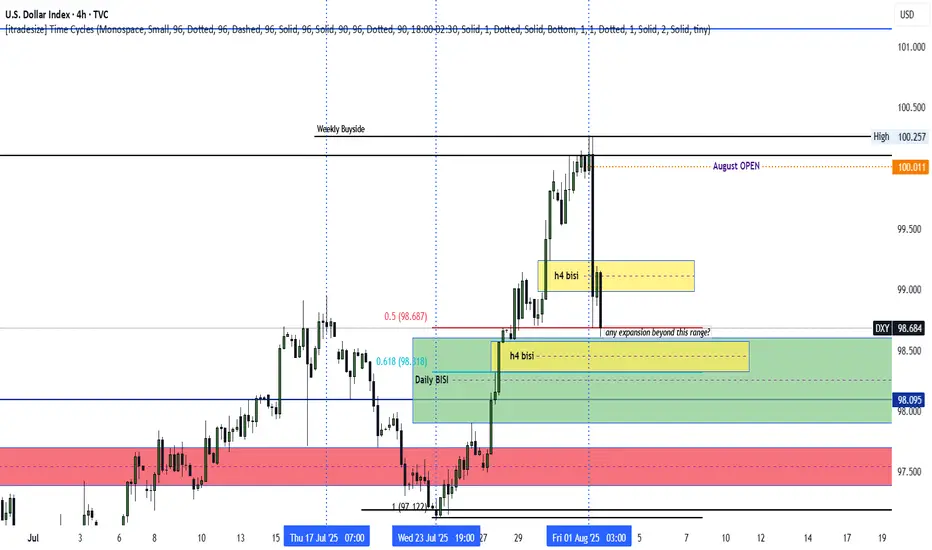
DXY bullish into AUGUSTThe dxy seems poised to rally following a rally above PMHs. The August OPEN decline could end up being nothing but a retracement as we rally high. Monday, Tuesday and Wednesday could range, while Thursday and the NFP push us above August's current highs. An expansion below Friday's New York AM lows (H4) could signal continued decline as we seek to establish weekly LOWS. Patience as the market unfolds is hand is ALWAYS key. Let's chat.
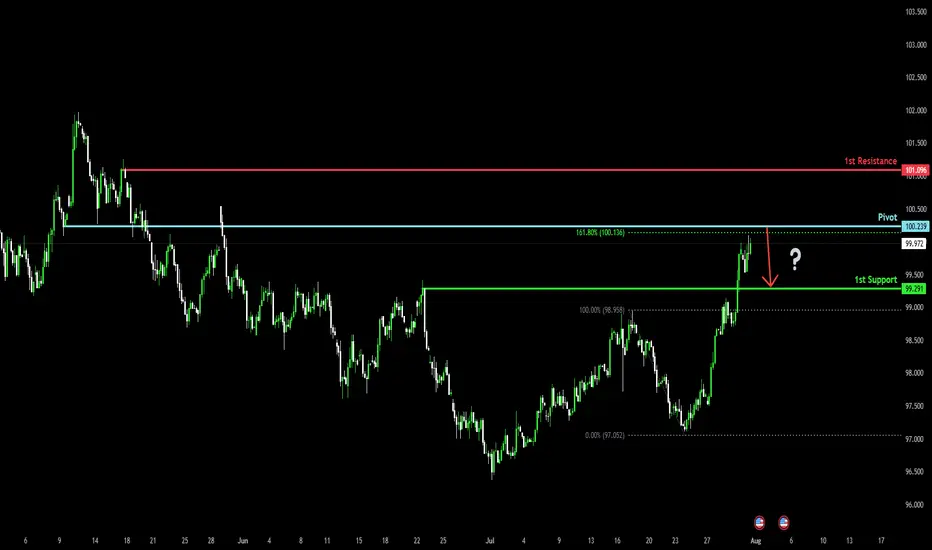
Bearish reversal off overlap resistance?The US Dollar Index (DXY) is rising towards the pivot and could reverse to the 1st support.
Pivot: 100.23
1st Support: 99.29
1st Resistance: 101.09
Risk Warning:
Trading Forex and CFDs carries a high level of risk to your capital and you should only trade with money you can afford to lose. Trading Forex and CFDs may not be suitable for all investors, so please ensure that you fully understand the risks involved and seek independent advice if necessary.
Disclaimer:
The above opinions given constitute general market commentary, and do not constitute the opinion or advice of IC Markets or any form of personal or investment advice.
Any opinions, news, research, analyses, prices, other information, or links to third-party sites contained on this website are provided on an "as-is" basis, are intended only to be informative, is not an advice nor a recommendation, nor research, or a record of our trading prices, or an offer of, or solicitation for a transaction in any financial instrument and thus should not be treated as such. The information provided does not involve any specific investment objectives, financial situation and needs of any specific person who may receive it. Please be aware, that past performance is not a reliable indicator of future performance and/or results. Past Performance or Forward-looking scenarios based upon the reasonable beliefs of the third-party provider are not a guarantee of future performance. Actual results may differ materially from those anticipated in forward-looking or past performance statements. IC Markets makes no representation or warranty and assumes no liability as to the accuracy or completeness of the information provided, nor any loss arising from any investment based on a recommendation, forecast or any information supplied by any third-party.
USD Working Strongest Month Since April 2022After a decisive sell-off ran for most of the first-half of the year, USD bulls have stepped up in July and DXY is currently up 3.3% for the month.
That's the strongest monthly outing in the currency since April of 2022- and that's just after the Fed had started their rate hike campaign that year. It led into a massive rally that ran through September as the USD set fresh 20-year highs.
The question now is one of continuation, and motive seems to be fairly clear. I've outlined the technical backdrop as this shift has taken place over the past month, as the Dollar held a higher-low last week and that drove into a higher-high this week.
There's likely some short squeezing contributing to the rally but with U.S. data remaining strong, and inflation on the way back up, the rate cuts that markets had priced-in back in March and April for 2025 are now in question.
This brings attention to the next major item - with Non-farm Payrolls tomorrow morning.
On a short-term basis the USD move has already started to show overbought conditions on the four-hour chart, and daily RSI is getting close to the 70-level. So perhaps ideal would be a soft report tomorrow at which point a pullback could show. It's from that that we can see whether bulls will come in to defend higher-lows, and there's now support potential at prior resistance of 99.40 in DXY.
If we do see a strong report, the 100 level is the spot for bulls to reckon with and at that point, we may be looking at an overbought RSI scenario on the daily chart - which doesn't necessarily preclude bullish continuation although it will make it more difficult to chase topside breakouts. - js
USD Re-Tests a Familiar Area of SupportBack in April the US Dollar was dropping like a rock. While the sell-off in stocks had stalled by the time we got to Easter, the bearish trend in USD was in full-force, going along with a strong breakout in Gold and many major FX pairs. But it was the low on Easter Monday that finally stalled matters for a bit. That price came in right around the 98.00 level, and led to four weeks of strength, including through the May FOMC rate decision, all the way until the 102-handle came into play. That's where the music stopped for the USD rally in Q2, and sellers went back for another push down to fresh lows that ultimately showed with a fresh three-year-low on day one of Q3.
Since then, however, bears have been stalled and there's a couple of different supporting backdrops there, such as the oversold readings that had shown on both the daily and the weekly as we came into Q3, or the falling wedge formation that had built as sellers remained really aggressive at highs or tests of resistance while less so around lows or tests of support.
And it's not like July was all that bullish of a month for the USD as we heard Trump continue to press his desire for low rates, including threats to fire FOMC Chair Jerome Powell. And at this stage, markets are pricing in a rate cut in September, along with another by the end of the year and possibly two. So expectations on rates are really low yet, on a relative basis, the USD has held up somewhat well.
At this point we're at another major test with the USD re-testing that same spot of support that had come into play in April, around the 98.00 handle in DXY. There's more context for support in the USD down to around 97.60, which helps to create a zone. For USD-weakness, I still think GBP/USD remains as attractive, but for USD-strength, EUR/USD could be an interesting case given the Fibonacci resistance that's started to show there. - js
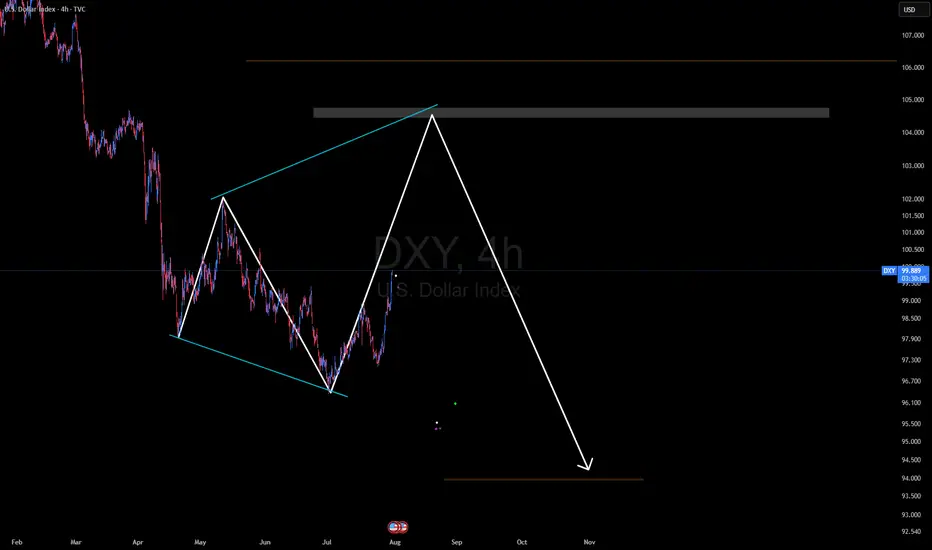
DXY continued downside, next stop 90Perfect parallel channel + Fib 2.618 intersection
Gl
Not financial advice

Candle close above 100 after 2 months.If the Dollar Index manages to close above the 100 level today, following the important news release, there's a chance the upward move could continue toward the key 101 zone next week.
However, unless it breaks above the 101 level with strong momentum, the overall trend in the higher timeframes still remains bearish.
Dollar dropWith the break of the ascending channel's bottom, the price is expected to reach the bottom of the range.
DXY: Absolute Price Collapse Ahead! Short!
My dear friends,
Today we will analyse DXY together☺️
The market is at an inflection zone and price has now reached an area around 98.553 where previous reversals or breakouts have occurred.And a price reaction that we are seeing on multiple timeframes here could signal the next move up so we can enter on confirmation, and target the next key level of 98.471.Stop-loss is recommended beyond the inflection zone.
❤️Sending you lots of Love and Hugs❤️
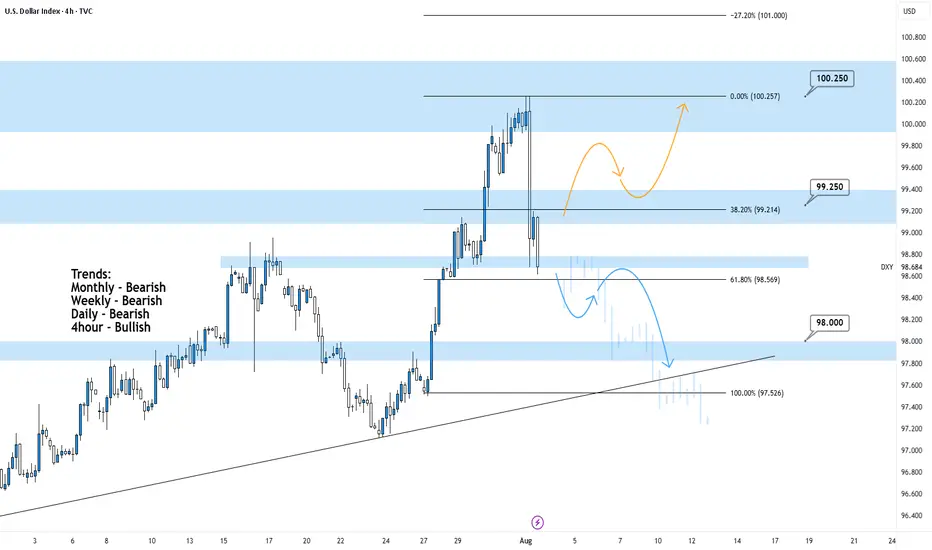
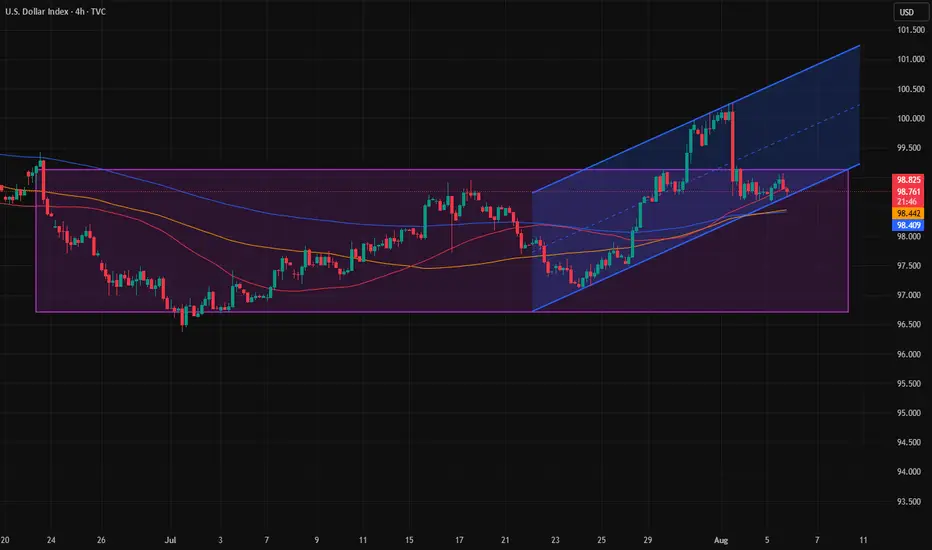
DXY 4Hour TF - August 3rd,2025🟦 DXY 4H Analysis Neutral idea
📅 August 3, 2025
🔹 Top-Down Trend Bias:
• Monthly – Bearish
• Weekly – Bearish
• Daily – Bearish
• 4H – Bullish
The dollar index is in a larger bearish cycle but just bounced from near-term resistance around 100.250. While the 4H shows temporary strength, we’re trading into major resistance and we may see it short lived.
🔍 Key Levels to Watch
• Support: 98.00
• Resistance Zones: 99.25 and 100.25
• 61.8% Fib: 98.57
Price is currently testing structure after rejecting from the 100.25 resistance zone. This area remains a strong ceiling unless the higher timeframe structure shifts.
✅ Scenario A: Bearish Continuation (Blue Path)
1. Bearish Structure confirmation below the current zone
2.If bearish rejection confirms, expect price to continue toward 98.00, possibly 97.50
3.Clean confluence with the higher timeframe trend
⚠️ Scenario B: Bullish Extension (Orange Path)
1.If price breaks and holds above 99.25, we may see a continuation toward 100.25
2.Short-term bullish strength, but against HTF bias
3.Must treat as a counter-trend idea unless confirmed with HTF structure shift
🧠 Final Notes
• 98.50 is the key decision zone, watch reaction closely
• Trend remains bearish on all major timeframes
• Don’t force the long, lean bearish unless structure proves otherwise
DOLLAR INDEXDepartments Responsible for Each Economic Report
Indicator Responsible Department/Source
Average Hourly Earnings m/m U.S. Bureau of Labor Statistics (BLS), part of the Department of Labor
Non-Farm Employment Change BLS (Establishment Survey)
Unemployment Rate BLS (Household Survey)
Final Manufacturing PMI S&P Global/Markit (private company)
ISM Manufacturing PMI Institute for Supply Management (ISM, private sector)
ISM Manufacturing Prices Institute for Supply Management (ISM)
Revised University of Michigan (UoM) Consumer Sentiment University of Michigan (private/public university)
Construction Spending m/m U.S. Census Bureau, Department of Commerce
Revised UoM Inflation Expectations University of Michigan
How the Federal Reserve Interprets “Greater Than” or “Lower Than” Forecast
1. Average Hourly Earnings,
2.Non-Farm Payrolls,
3. Unemployment Rate
Higher than forecast (stronger labor market):
Tight labor markets (higher wages, more jobs, lower unemployment) suggest inflationary pressure.
The Fed may view this as a signal to keep rates higher for longer, as wage and job growth could fuel inflation.
Lower than forecast (weaker labor market):
Signals cooling in employment and wage growth, reducing upward pressure on inflation.
The Fed may see this as justification to consider easing policy or at least pausing further rate hikes.
2. Manufacturing PMIs (ISM, S&P)
Above 50: Signals expansion in manufacturing; below 50 indicates contraction.
Higher than forecast: Points to stronger economic momentum; the Fed may see upside risks to inflation.
Lower than forecast: Indicates weaker manufacturing activity; a possible sign of slowing demand, which could support rate cuts or dovish policy if persistent.
3. ISM Manufacturing Prices
Higher than forecast: Suggests inflationary pressures in manufacturing input costs; Fed interprets this as a reason for vigilance on inflation.
Lower than forecast: Implies easing input price pressures, supporting a dovish outlook if inflation remains subdued.
4. University of Michigan Consumer Sentiment & Inflation Expectations
Stronger than forecast sentiment: Consumers are more optimistic, often a sign of solid spending potential. May amplify inflation if this leads to greater demand.
Higher inflation expectations: If consumers expect higher future inflation, this can become self-fulfilling and the Fed may maintain tighter policy.
Weaker sentiment/lower inflation expectations: Reduces inflation risk, gives the Fed more flexibility to ease if needed.
5. Construction Spending
Higher than forecast: Indicates resilient investment and demand in the real economy.
Lower than forecast: Suggests cooling real estate and infrastructure spending; may support a dovish Fed outlook if sustained.
Summary Table
Data Surprises Interpretation for Fed Policy
Higher-than-forecast More hawkish; raises risk of persistent inflation
Lower-than-forecast More dovish; reduces pressure to hold rates higher
The Fed looks at the overall pattern across these data. Persistent upside surprises heighten concerns about inflation, supporting tighter policy. Downside surprises suggest cooling economic momentum and may encourage future rate cuts or pauses. The relative impact depends on which indicators surprise and the broader economic context.
#DXY #DOLLAR

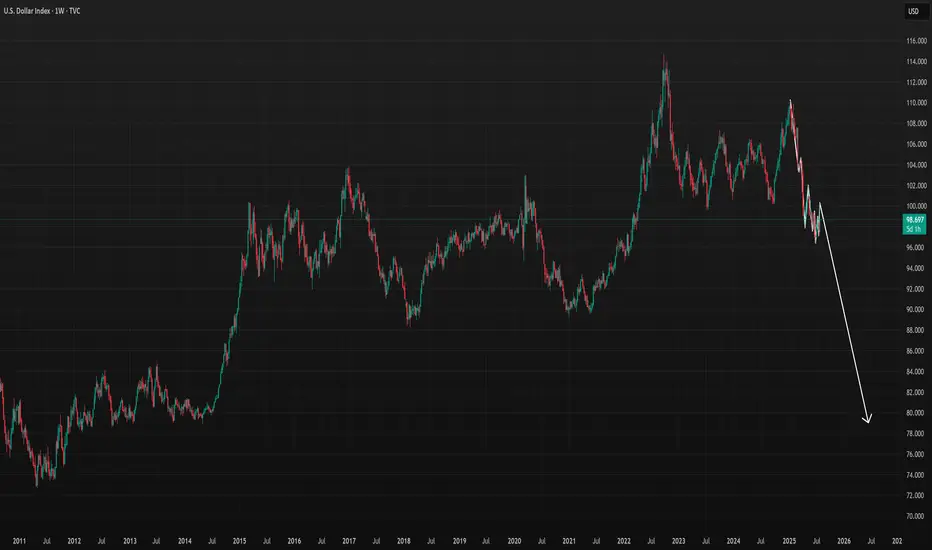
DXY to go extremely low due to Tariffs and Market ManipulationDXY to go extremely low due to Tariffs and Market Manipulation Reports
- The US Debt is almost over $38 Trillion in under 3 months
- Continue to monitor for weekly bearish signals on the chart
TVC:DXY
OANDA:USDCAD
OANDA:NZDUSD
DXY ShortDXY is likely to fall from $99.8 upon reaching it, based on the Crab Pattern, potentially reaching targets TP #1 - TP #2.

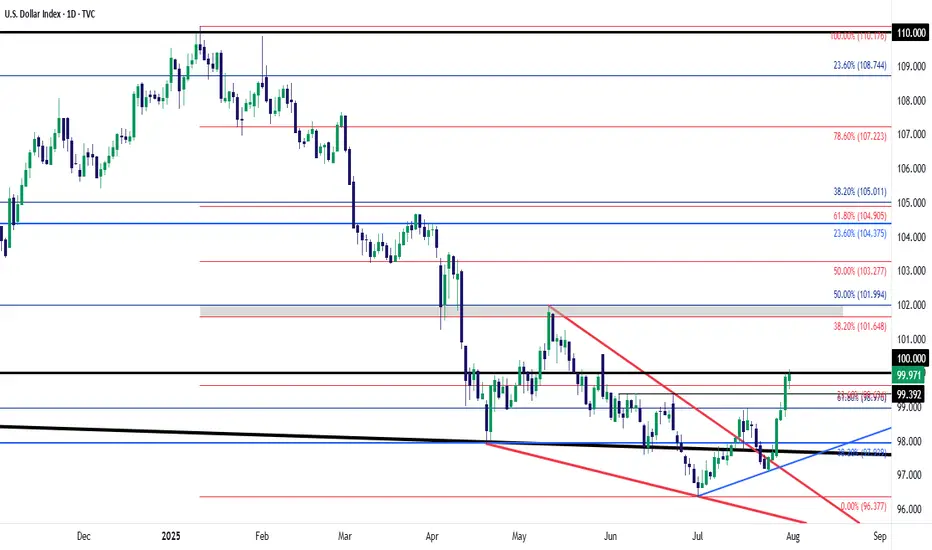
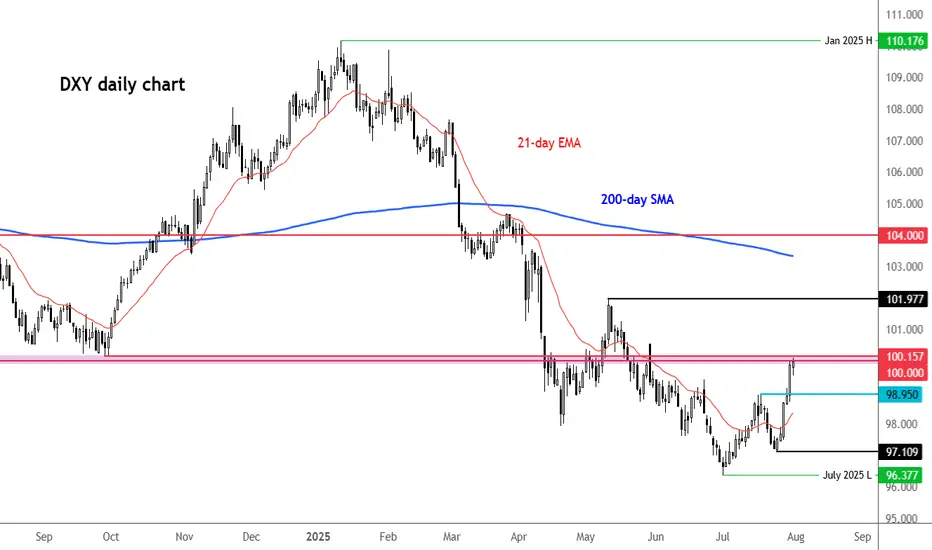
DXY testing 100.00 resistanceThe US dollar index has risen to rest a key resistance area around the 100.00 level. Previously a key support and resistance zone, what happens here could determine the near-term technical direction for the US dollar.
Key support below this zone is at 98.95, marking a prior resistance. Given the short-term bullish price structure, I would expect this level to hold if the greenback were to ease back from here.
If the bullish momentum gathers pace, then 101.00 could be the next stop, followed by the recent high of 101.97.
From a macro point of view, resilient economic data and persistent core inflation concerns continue to support the Federal Reserve’s cautious policy approach. Today’s core PCE inflation reading came in slightly above forecast, at 2.8% year-over-year versus the expected 2.7%. In addition, jobless claims were better than anticipated, registering 218,000 compared to the 224,000 forecast. The Q2 Employment Cost Index also surprised to the upside, rising 0.9% quarter-on-quarter.
These figures follow yesterday’s stronger-than-expected GDP report and a solid ADP private payrolls release, further underscoring the strength of the U.S. economy.
Attention now turns to Friday’s nonfarm payrolls report, which could have a meaningful impact on rate expectations. Fed Chair Jerome Powell has emphasized the importance of the unemployment rate as a key metric, so any upside surprise could reinforce the Fed’s current position.
However, expectations are not very high for the non-farm payrolls report. Current forecasts suggest an increase of 106,000 jobs, with average weekly earnings rising 0.3% month-over-month, and the unemployment rate edging up to 4.2%. Yet, the scarcity of strong leading indicators this month adds a layer of uncertainty to the outlook.
By Fawad Razaqzada, market analyst with FOREX.com
DXY Just Broke Resistance – Is This the Start of a Dollar Rally?As per our analysis, DXY has successfully broken above the primary and secondary resistance line.
If the price manages to close above the marked resistance zone, we could see further upside momentum ahead.

DXY bullish trend The market reaction indicates that the economy remains very strong, and there is no immediate need for the Fed or any central bank action. Powell emphasized that any potential rate cuts will depend on the upcoming data, especially the August reports. As a result, the DXY is expected to remain strong and could rise towards the 104.00–106.00 levels. A potential bearish reversal in the DXY would only be likely if there is significant economic deterioration or a clear shift in Fed policy expectations.
DXYThe Federal Open Market Committee (FOMC) announced on July 30, 2025, that it will maintain the federal funds rate at the current target range of 4.25% to 4.50%. This keeps the rate unchanged from previous meetings, continuing a "wait-and-see" approach amid mixed economic signals. The decision was supported by a 9-2 vote. The committee highlighted that recent data suggests economic activity growth has moderated in the first half of the year, with low unemployment and somewhat elevated inflation. The FOMC indicated it would carefully assess incoming data, the evolving economic outlook, and the balance of risks before making further adjustments. There is no rate cut at this meeting, but the Fed remains attentive to risks on both sides of its dual mandate of maximizing employment and achieving inflation around 2%.
Federal Reserve Chair Jerome Powell emphasized the need for additional data, particularly regarding the impact of tariffs on inflation and economic conditions, before changing policy. The economy showed stronger-than-expected second-quarter growth, but inflation remains above the Fed's 2% target, contributing to the decision to hold rates steady. The committee's stance reflects caution despite pressure from political sources to cut rates.
The next FOMC meeting after this one will be in September 2025, and some economists predict a possible rate cut then depending on economic developments. Powell's press conference and the FOMC statement will be closely analyzed for any subtle shifts in policy tone or outlook.
In summary:
Federal funds rate maintained at 4.25% - 4.50%
Economic growth moderated but remains solid
Low unemployment, inflation somewhat elevated
Fed is data-dependent and cautious
No rate cut for now but possible in September
This is consistent with the ongoing approach since late 2024 of holding rates steady to balance inflation control and support for the labor market.
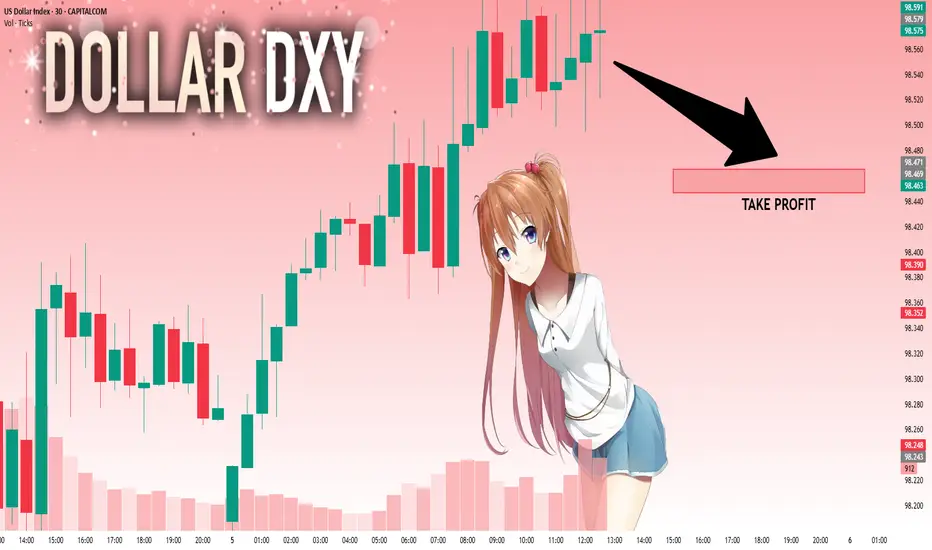
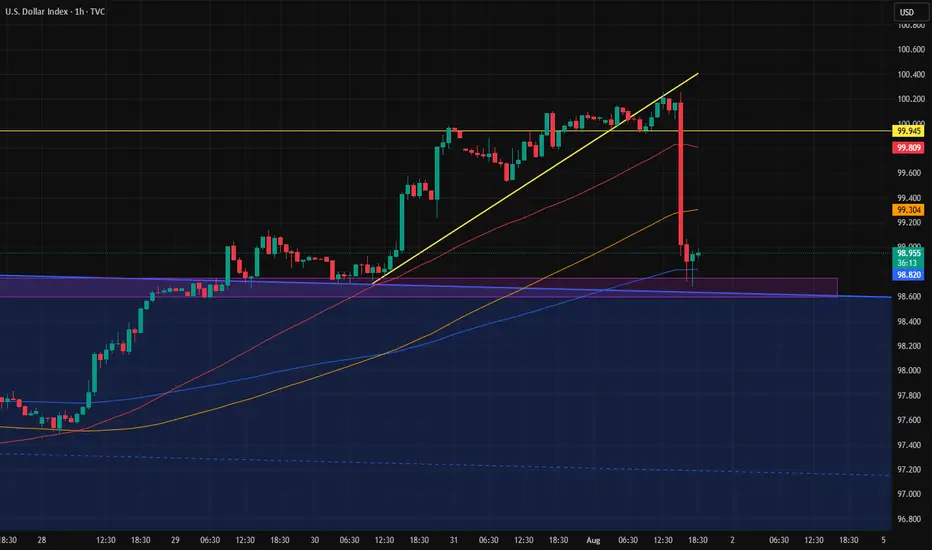
The strength of the PMI reportWe all saw how a large and strong candle formed right after the news, hitting the top of the previous channel.
So now that channel top zone has proven to be valid.
Now we have to see whether this candle leads to another drop in the dollar, or if the dollar recovers and slowly starts moving back toward 100.
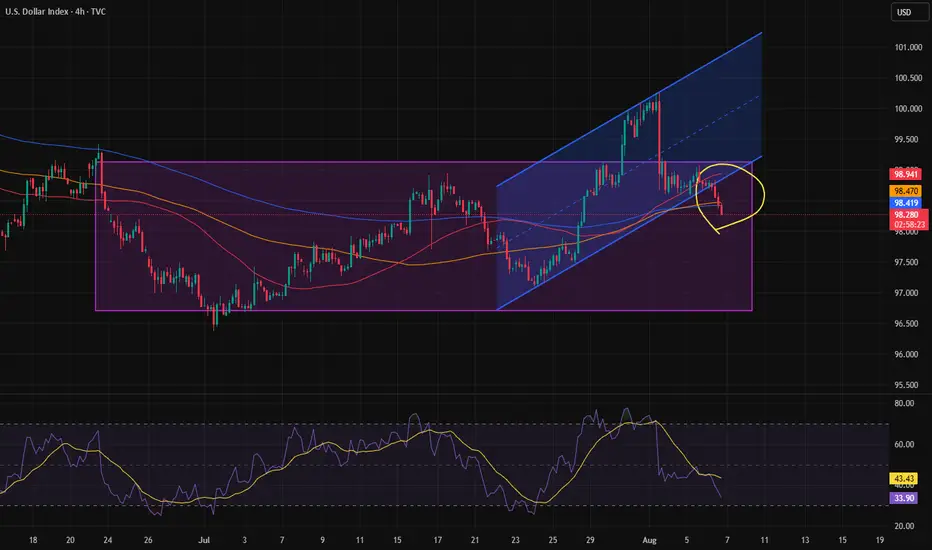
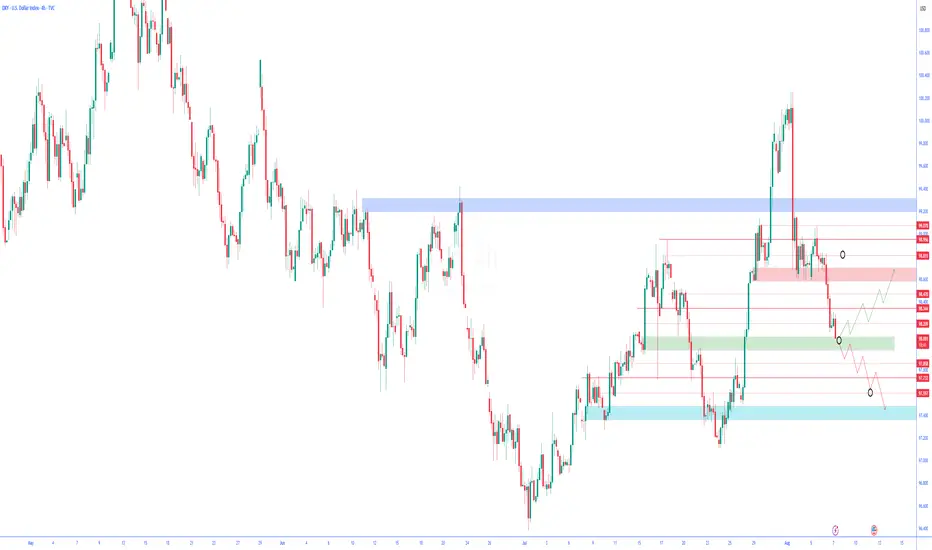
Technical Analysis of the US Dollar Index (DXY) | 4-Hour Timefr🟢 Technical Analysis of the US Dollar Index (DXY) | 4-Hour Timeframe
On the 4-hour chart, the US Dollar Index has recently formed a Drop-Base-Drop (DBD) structure and is now positioned on a significant support level. This area can play a critical role in traders' decision-making for the next move.
✅ Current Situation:
After the initial drop, the price entered a short-term base/consolidation phase, then continued its decline and is now testing a demand zone (support). In this structure, two potential scenarios are worth considering:
🔼 Bullish Scenario:
If the price reacts positively to this support zone:
A rebound toward previous supply areas is likely.
Holding above the first resistance could indicate a temporary or even long-term trend reversal.
This level may provide a low-risk entry opportunity for buyers targeting a reversal.
🔽 Bearish Scenario:
If selling pressure continues and the current support breaks:
A further drop as part of a third wave (impulse) may unfold.
Lower support zones would become the next target areas for sellers.
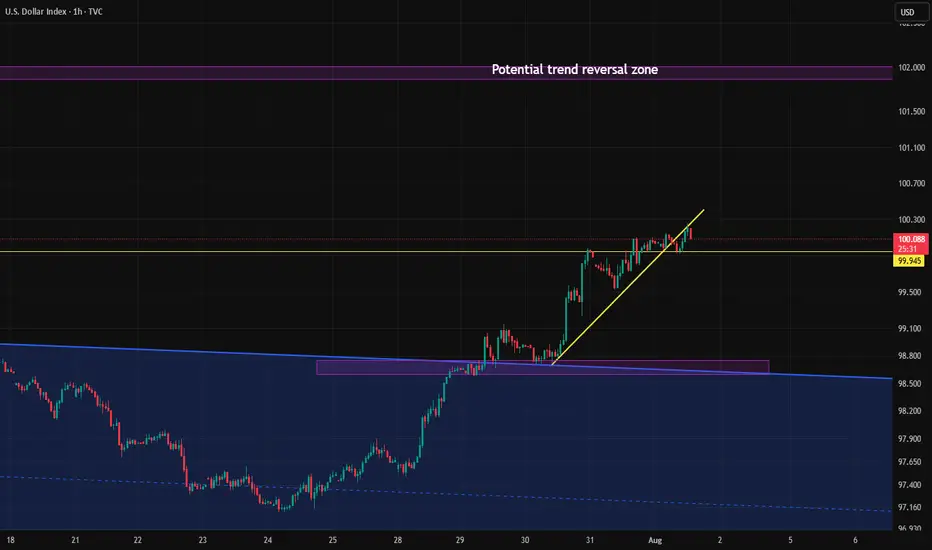
Breakout from the channel again?After a long period of ranging, the DXY finally managed to break the range's ceiling last week and even gave us a channel confirmation afterward. But if you remember, there were several major news events last week, with the last one on Friday causing the price to fall back into the range. Now we can see that an ascending channel has formed inside the range, and the price is currently at the bottom of that channel. If it manages to break out of the channel again, there’s a chance that this time the trend might truly reverse.
DXY (USDX): Trend in daily time frameThe color levels are very accurate levels of support and resistance in different time frames, and we have to wait for their reaction in these areas.
So, Please pay special attention to the very accurate trend, colored levels, and you must know that SETUP is very sensitive.
(((((we have two trend)))))
BEST,
MT

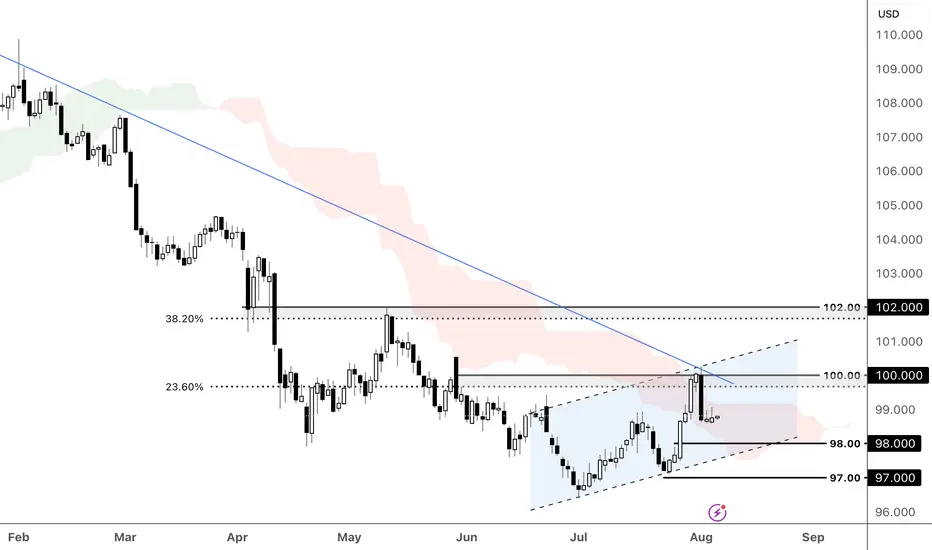
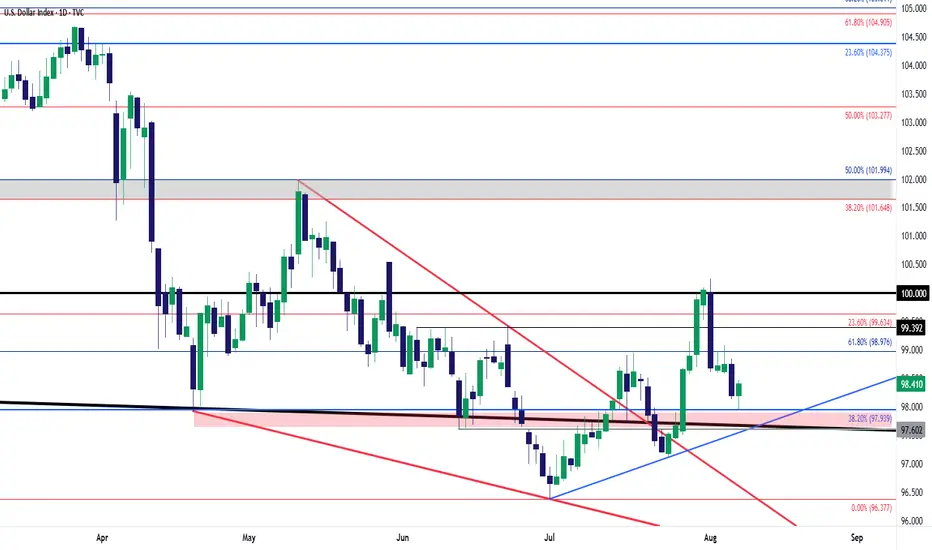
DXY is testing the descending trend line, breakout happening? The US dollar firmed as Trump's escalating tariff threats, from pharma to Indian exports, amplified trade tensions and boosted safe-haven flows. Despite rising global uncertainty, optimism over a possible US-China trade truce extension and a sharply narrower trade deficit also underpinned dollar strength.
DXY retreated below the descending trend line and the ascending channel's upper bound. The price is consolidating below the 100.00 psychological resistance, which aligns with the 23.6% Fibonacci Retracement. A rebound from the support at 98.00, in line with the ascending channel's lower bound, could prompt a retest of the channel's resistance, paving the way for further gains toward the 38.2% Fibonacci Retracement and 102.00 resistance, upon breaking 100.00. Conversely, a bearish breakout of the channel and close below the 98.00 support could prompt a further decline toward the following support at 97.00.
By Li Xing Gan, Financial Markets Strategist Consultant to Exness