DXYLong term view on DXY. Retracement into range after reaching D 3.5-4 levels - which is also W 1-1.5 (SBZ) levels, to continue to W 2-2.5/M 1-1.5 levels. Eyes on M SIBI paired with bullish D SD levels. Commercials in net long positions typically leads to higher prices.
USDX trade ideas

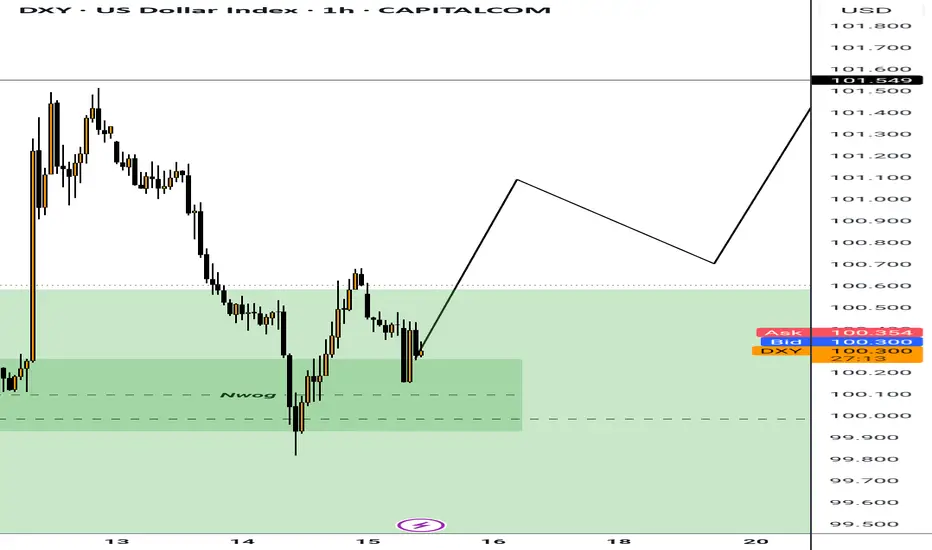
Bullish bounce?US Dollar Index (DXY) has bounced off the pivot and could rise to the 1st resistance.
Pivot: 100.27
1st Support: 99.06
1st Resistance: 101.91
Risk Warning:
Trading Forex and CFDs carries a high level of risk to your capital and you should only trade with money you can afford to lose. Trading Forex and CFDs may not be suitable for all investors, so please ensure that you fully understand the risks involved and seek independent advice if necessary.
Disclaimer:
The above opinions given constitute general market commentary, and do not constitute the opinion or advice of IC Markets or any form of personal or investment advice.
Any opinions, news, research, analyses, prices, other information, or links to third-party sites contained on this website are provided on an "as-is" basis, are intended only to be informative, is not an advice nor a recommendation, nor research, or a record of our trading prices, or an offer of, or solicitation for a transaction in any financial instrument and thus should not be treated as such. The information provided does not involve any specific investment objectives, financial situation and needs of any specific person who may receive it. Please be aware, that past performance is not a reliable indicator of future performance and/or results. Past Performance or Forward-looking scenarios based upon the reasonable beliefs of the third-party provider are not a guarantee of future performance. Actual results may differ materially from those anticipated in forward-looking or past performance statements. IC Markets makes no representation or warranty and assumes no liability as to the accuracy or completeness of the information provided, nor any loss arising from any investment based on a recommendation, forecast or any information supplied by any third-party.

DXY Comparing the dollar index and Usdcad , According to price, I can see an SMT Divergence upon the two corelated pairs that should be moving on the same direction , but divergence was formed. Looking forward for bearish on the Dollar index this day 16th May 2025.

DXY (US Dollar): Bullish Order FlowA bullish order block has been identified on the H1 timeframe, situated below the Asian session range. With the US Dollar maintaining steady strength, there is potential for price to retrace into this order block for mitigation. Should this occur, a continuation of the bullish trend is anticipated, with price likely to rally and break above the recent structural high.

DXY 1W Forecast until the end of MAY 2025Up-trend will resume and last until the end of February 2025 topping no higher than 114. Current bottom is in at 105.9
Hence, it shouldn't fall below.
After February a consolidation period of 1,5 months will trap price action between the bottom of 122.16 and upper level of 114.9
The spring squeezed during consolidation will provide enough energy for further upwards movement starting in the end of April 2025. This will ignite a chain of devaluation of national currencies followed by epidemic inflation across the globe. This will finish/cool-down at DXY reaching the mark of 148.
New reality after May 2025?

US Dollar Index 1WCurrent strengthening of DXY will not last for long. Optimal level for start of reversal is 103.122
After the reversal the downtrend will resume and go for final stage (discharge) which may look like a flash crash on the last week of June 2025 down to 96.362
Starting from July 2025 DXY will print a reversal pattern moving sideways and slightly up all the way until September 2025. In the mid-end of September we will see a major retest which will mark a start big bullish cycle and global domination of US Dollar.

Looking for Longs in DXYDXY Looks good to look for longs. Arguably, I will be looking for scalping longs only on Friday. This is due to no high impact news to drive price, hence, we might face consolidation on higher timeframe.

DXY: Absolute Price Collapse Ahead! Short!
My dear friends,
Today we will analyse DXY together☺️
The in-trend continuation seems likely as the current long-term trend appears to be strong, and price is holding below a key level of 100.450 So a bearish continuation seems plausible, targeting the next low. We should enter on confirmation, and place a stop-loss beyond the recent swing level.
❤️Sending you lots of Love and Hugs❤️

DXY Bullish Rebound Expected! Buy!
Hello,Traders!
DXY is making a local
Bearish correction towards
The horizontal support level
Around 100.200 but we are
Locally bullish biased so
After the retest we will be
Expecting a local bullish rebound
Buy!
Comment and subscribe to help us grow!
Check out other forecasts below too!
Disclosure: I am part of Trade Nation's Influencer program and receive a monthly fee for using their TradingView charts in my analysis.

Dxy 1Hr Analysis 15-May-2025The US Dollar Index (DXY) showed signs of recovery following its sharp decline in April 2025. This rebound appeared to coincide with easing concerns around trade tensions between the US and other countries, particularly China. The index climbed toward the 102 level before retreating, likely influenced by lower-than-expected CPI (inflation) data.
Looking ahead, potential scenarios for DXY include:
• A sustained move above the 101 level may open the door for a test of the 102 area. If momentum continues, market participants may observe whether the index approaches the 103–103.2 range.
• Alternatively, if DXY struggles to stay above the 101 level and a downward pressure persists, attention may shift to the 100, and even lower to the 99 level — a zone that has previously attracted buying interest.
Disclaimer: easyMarkets Account on TradingView allows you to combine easyMarkets industry leading conditions, regulated trading and tight fixed spreads with TradingView's powerful social network for traders, advanced charting and analytics. Access no slippage on limit orders, tight fixed spreads, negative balance protection, no hidden fees or commission, and seamless integration.
Any opinions, news, research, analyses, prices, other information, or links to third-party sites contained on this website are provided on an "as-is" basis, are intended only to be informative, is not an advice nor a recommendation, nor research, or a record of our trading prices, or an offer of, or solicitation for a transaction in any financial instrument and thus should not be treated as such. The information provided does not involve any specific investment objectives, financial situation and needs of any specific person who may receive it. Please be aware, that past performance is not a reliable indicator of future performance and/or results. Past Performance or Forward-looking scenarios based upon the reasonable beliefs of the third-party provider are not a guarantee of future performance. Actual results may differ materially from those anticipated in forward-looking or past performance statements. easyMarkets makes no representation or warranty and assumes no liability as to the accuracy or completeness of the information provided, nor any loss arising from any investment based on a recommendation, forecast or any information supplied by any third-party.


TARIFF IMPACT TO DOLLAR ?Hi Trader,
Here my analysis for TVC:DXY , Looking on how the hot topic about tariff right now. For now bias on the strong move for TVC:DXY

DXY buyMy bias on the 4hr timeframe is definitely bullish, this technical analysis and the deals that we see trump making with the mid east guys is definitely a good sign for the dollar, hopefully powell's speech today will be good news.
DXY price created an impulse to the downside now we starting to see a correction forming
waiting for the completion of the structure in accordance to our trading plan to take
The us Dollars to the downside.

US Dollar Index (DXY) – Bullish Setup in PlayThe market has spoken and it’s whispering a potential bullish breakout .
As seen in the chart, the US Dollar Index (DXY) recently broke out from a short-term consolidation zone after forming a solid base near the 99.00 region. Currently, it's retesting a minor support level (highlighted by the yellow horizontal line).
Key Observation:
Price is holding above this support zone with strength. If this level holds, I anticipate a continuation to the upside as marked by the white arrow.
Target: The next major resistance zone lies near the 103.00 area, where price previously reversed. This becomes the logical next stop if the bullish momentum continues.
What I’m Watching:
Reaction from the current support zone
Strength of buyers stepping in
Any fundamental catalysts from USD-related news/events
In trading, it's not about predicting, it's about preparing. This chart reflects a classic "break-and-retest" scenario often seen before major moves.
Let’s see how this plays out over the coming days.

DXY ? Gold?
Speculation of
weaker $
www.tradingview.com
If this happens _ First signal I'm looking for is 1st cutting interest rates
Gold will be stronger
( But haven't break down trendline)
Crypto world be stronger
etc etc.
I'm just preparing mind & shift of trend
All setup will eventually reverse when DXY goes below 99.9999
All the best
Not a guru

DXY Analysis (Updated)Here is an updated DXY and Forex analysis as per my last one. Let me know what you think!
- R2F Trading

DXY - market structure - RISK and TRADE managment make profitDXY - market structure - RISK and TRADE managment make profit, adapt , dont react

DXY retest of the gap and ready for bullishness
DXY retested the gap formed at the beginning of the week. The area of demand had efficiency underneath it - price swept the efficient zone, and closed in the identified zone. Price is currently bullish, but I would like to see price close above the 100.53 mark before looking for a buy trade.

DXY I Just see BullsI want us to continue up from this 4HR CISD and IFVG. I don't want to see a sweep of any swing Low.

My expectation for DXY todayBase on H4 price action, the direction is bullish.
now its looking for the support to bounce higher in my opinion.
Good luck

USD INDEXHello Traders.
This is my analysis for USD INDEX.
I am not a professional and I would be happy if you share your opinion in the comments.

USD Holds Key Res at 102 but Bulls Show Up at Higher-LowUSD came into the week with a full head of steam as price broke out to the 102.00 level on Monday. This was pushed by a strong move in USD/JPY testing 148 and EUR/USD testing 1.1100 - but then the Tuesday CPI report came out soft and that gave bulls reason to take profits on the USD.
That pullback ran vividly into early-Wednesday trade but at that point, support appeared at an important spot of prior resistance of 100.28, which was the neckline for the inverse head and shoulders pattern that led into last week's FOMC-fueled breakout.
That support has so far held and that keeps bulls in control of the trend on daily and four-hour charts. The key test now is a big batch of drivers for tomorrow morning with retail sales, PPI and a speech from FOMC Chair Jerome Powell.
At this point, EUR/USD retains bearish potential and USD/JPY bullish potential, which I'll touch on in a following post, and the door is open for Dollar bulls to make a move into the end of the week. On the other side of DXY, USD/CAD remains of interest as the pair has re-tested the psychological level of 1.4000. - js
