Technical Analysis | DXY | U.S. Dollar Index4-Hour Timeframe🔍 Technical Analysis | DXY | U.S. Dollar Index
4-Hour Timeframe
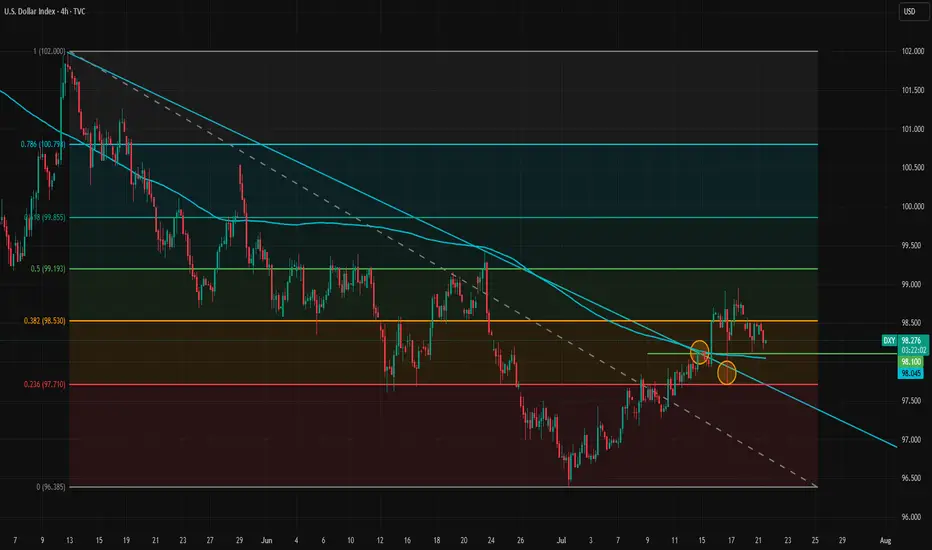
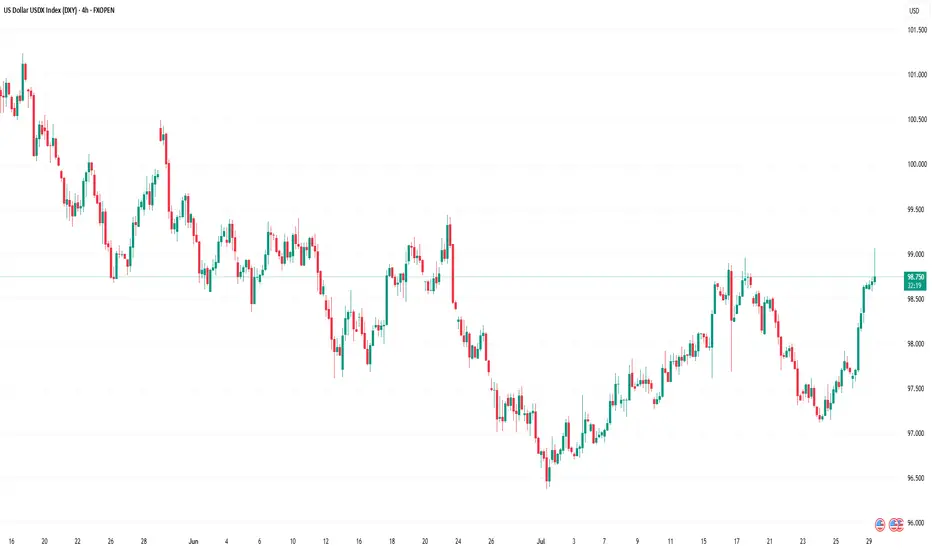
After hitting a strong supply zone marked in blue at the top of the chart, the price faced selling pressure and entered a bearish phase. Currently, the price is trading within a decision zone between buyers and sellers, where both bullish and bearish scenarios are possible.
🔼 Bullish Scenario:
If the price finds support at the mid-level support zone marked in green, and signs of a bullish reversal appear—such as proper candlestick formation or a renewed breakout of minor resistances (creating higher highs)—then the index is expected to move toward higher resistance levels.
🔽 Bearish Scenario:
Considering the market structure, if the mid-level support is lost and the price settles below this zone, the downtrend may accelerate. The dollar index could then move toward the lower support zone, marked in blue, which previously acted as a strong barrier and reversal area. This level may again serve as a key point to watch for market reactions.
✅ Conclusion
The U.S. Dollar Index is currently in a corrective phase, oscillating within a sensitive range. The price reaction to the current support zone will likely determine the next directional move. Therefore, it is recommended to wait for a confirmed breakout or bounce from this area before entering any trades.
USDX trade ideas
Dollar Index in Danger: Patterns Point to More DownsideThe dollar index (DXY) is flashing serious warning signs. In this video, I break down the technical evidence behind my bearish outlook on both the monthly and daily charts. The head and shoulders pattern we spotted did work it's way to breaking the neckline BUT the target will Not be achieved as the data on the charts have changed. On the daily charts we have a strong bearish engulfing candle, there is also an RSI divergence in the overbought zone, stochastic indicator has turn down and momentum is also following along. The downtrend on the monthly timeframe has not formed any divergence yet so I expect price to fall below the previous month's low in the coming weeks.
There will be bounces from support zones on the daily and 4 hours, these will be opportunities for good entries.
If you’re holding USD or trading around it, this is a must-watch. The signals are clear—are you prepared?
Cheers and I wish everyone a profitable trade in the coming week.

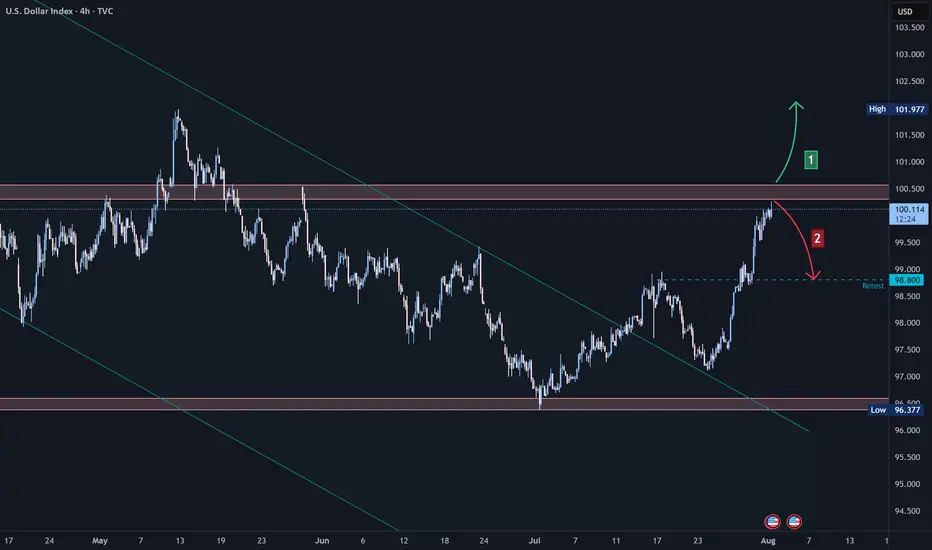
US Dollar Index (DXY) Technical Analysis:The DXY has recently exited a bearish wave, retested support levels, and began a recovery — currently trading near 100.09, a key resistance area.
🔹 If price breaks and holds above 100.09, the upward move may continue toward the 102.00 zone.
🔹 However, if the index rejects this level and reverses, a retest of 98.80 could follow.
⚠️ Disclaimer:
This analysis is for educational purposes only and does not constitute financial advice. Always perform your own analysis and monitor the markets before making any investment decisions.
DXY Outlook – From Bias to Execution Previous day closed bullish on DXY, leading me to look out for a bullish bias, On the 1H, I identified a familiar bullish pennant forming within the uptrend.

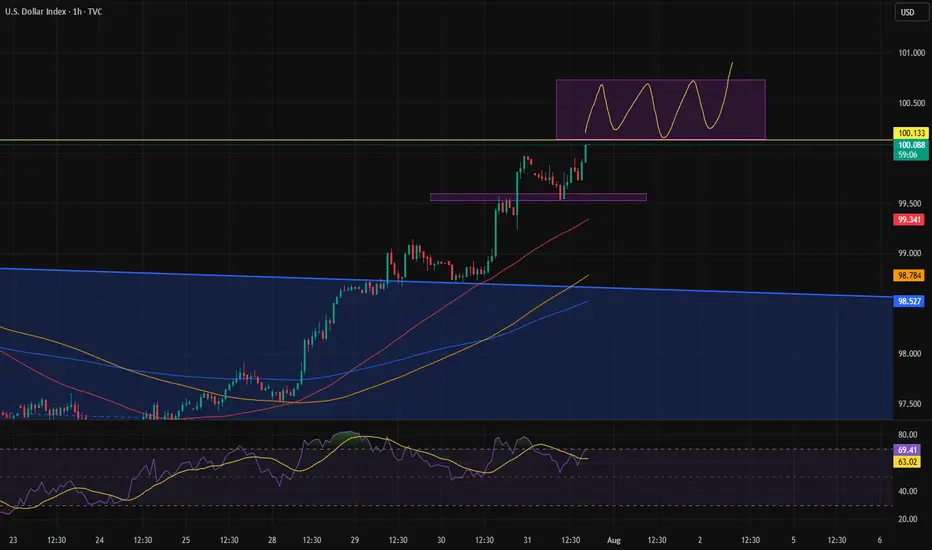
U.S. Dollar Index (DXY) – Pro Analysis | 1H Chart |1. Strong Bullish Momentum
DXY broke out sharply above the 99.41 resistance, showing clear strength from bulls with minimal pullbacks during the rally.
2. Short-Term Rejection at Supply
Price was rejected from the 99.978 zone — a key supply area. This indicates the presence of active sellers near the psychological 100 level.
3. Retesting Breakout Structure
Currently hovering just above 99.669, the DXY is retesting the previous breakout level. This could act as short-term support if bullish momentum resumes.
4. Next Key Zones
Resistance: 99.978 → 100.534
Support: 99.411 → 98.92
Break below 99.411 may invalidate the breakout.
5. Outlook
Bias remains bullish above 99.41. However, failure to reclaim 99.978 soon may signal temporary exhaustion or consolidation before next leg up.

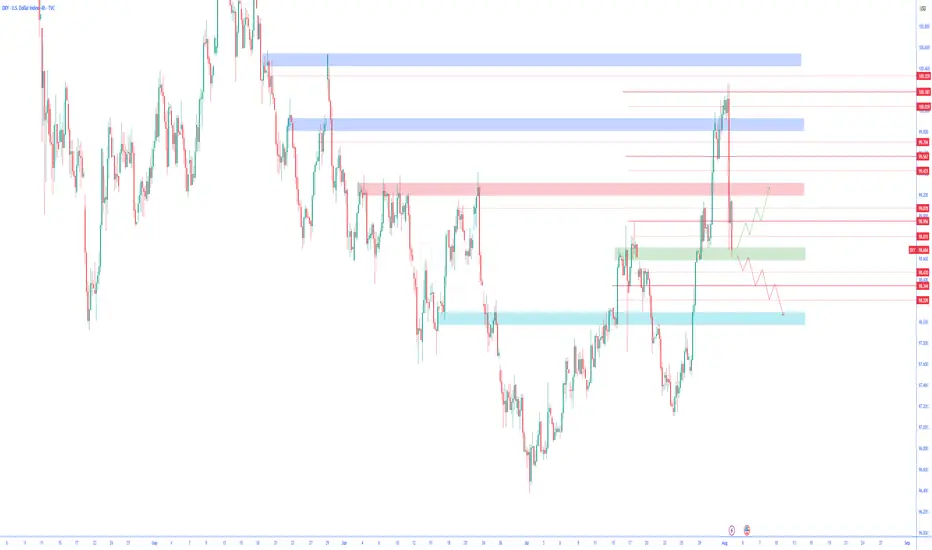
DXY 8H – Rejected Key Resistance, Can the Dollar Bounce Back?The U.S. Dollar Index (DXY) just got rejected off a key 8H supply zone near the psychological 100 level — failing to reclaim a level that previously acted as major support. With EMAs flattening and macro uncertainty rising, the dollar’s next move will have big implications across global markets.
🔹 Price Structure
The $100–$101.50 zone acted as support for months before breaking — and DXY just got rejected on its first retest.
The next resistance levels are stacked at $104, $108, and $110, each tied to prior breakdown points and macro peaks.
If DXY can't reclaim $100, a slide toward EMA support at ~$98 or even new lows remains in play.
🔹 EMA Signals
Price currently hovers between the EMA 50 and EMA 100 — an indecision zone often preceding trend continuation or reversal.
A breakdown below both EMAs would confirm momentum is stalling, while a reclaim of $100 could reignite the bullish push.
🔹 Implications for Risk Assets
If the dollar weakens from here, we could see renewed upside in crypto and equities.
Conversely, a reclaim and surge toward $104+ would likely pressure risk-on markets.
Is the DXY topping out — or just gearing up for another leg higher?
Let’s talk macro 👇

DXY POTENTIAL SCENARIO two possible scenarios for DXY in next coming weeks , watch the support and wait for confirmation before buying Dollar ,

104This channel is not providing individualized trading or investment advice, nor is it a banking service, brokerage service, trading service, investment service or money management service

Range above 100.It seems like the dollar is trying to push back above the 100 level after a long time, and it's likely forming a range up there to establish stability in that zone.
DXY attempting an inverse H&S breakoutSeeing a big green candle today on dxy after confirming the neckline of the inverse head and shoulders pattern as support on the previous daily candle.
USD to continue down?: Weekly Review/ fundamental analysis There was a lot of information to take in during the week starting Monday 28 July. A US / EUR trade deal announcement, US GDP, MICROSOFT earnings all contributed to positive market sentiment as the S&P continued to push all time highs. But in a reminder that anything can happen, a combination of NFP, AMAZON earnings and fresh TARIFF UNREST, ensured the week ended on a sour note.
The week got off to a good start with the US / EUR announcement. Although the news weakened the EUR as it appeared the US got the better end of the deal. And all of last weeks EUR positivity was unwound.
Despite the overall positive market mood at the beginning of the week, the currencies once again didn't quite correlate with the environment, as the USD and JPY both started the week particularly strong. Which could have been put down to 'EUR liquidity', meaning the USD and JPY benefited most from the weakness of the EUR. But, more likely, I suspected it was 'positioning' ahead of the important central bank interest rate meetings.
The meetings didn't disappoint, starting with the FOMC. The overall message was a continued reluctance to immediately cut interest rates. In a thinly veiled dig at the president, the line, "looking through inflation by not HIKING rates" sent the USD soaring as the probability of a September cut dropped to 40%.
A few hours later it was the BOJ'S turn. Although acknowledging inflation, a reluctance to immediately HIKE rates disappointed JPY bulls. And when added to positive MICROSOFT earnings, by Thursday's European session we had a peak JPY short opportunity.
But, alas, it wasn't long before disappointing Amazon earnings and the president stirring the tariff pot rocked the boat. And when Friday's NFP data 'surprised to the downside', the rot set in, the S&P dropped and in particular, sentiment for the USD crumbled. And the probability of a September rate cut significantly rose back up to 90%.
It's difficult to trade NFP at the best of times, but particularly when ISM data shortly follows. But I wouldn't argue with anyone who fancied a USD short on Friday.
I begin the new week with an open mind. I do think the S&P has a good chance of recovering (it's only natural for traders to use bad news as an excuse to take profits from all time highs). Sentiment for the USD could remain subdued, I suspect the US 10year will be a prominent part of the narrative.
On a personal note, outside of trading, drunk idiots smashing a bakery window and a member of staff leaving at short notice kept me busy. But I did manage one trade. A post BOJ 'short JPY'. It was coin toss between a post FOMC 'USD long' or a standard 'risk on AUD long'. I plumbed for the AUD. Ultimately, it wouldn't have mattered and the trade it profit.
Please feel free to offer thoughts questions, maybe you've spotted something I've not mentioned.
Results:
Trade 1: AUD JPY +1.3
Total = +1.3%
Fundamentals Support Dollar’s Potential Trend ReversalThe dollar appears to be reversing its direction on the 4-hour timeframe. The trendline has been broken and retested twice, but the dollar has held above it, signaling a potential shift in momentum.
Despite intense pressure from the White House on the Federal Reserve, the data is likely to prevent the Fed from cutting rates at the upcoming meeting and possibly at the one after that. A potential rate cut in September will largely depend on incoming inflation and labor market data.
The inflation impact of tariffs became more visible in the latest CPI report, but the effect is still relatively modest. This aligns with our theory that tariff-driven inflation will build gradually and persist over a longer period, rather than cause an immediate spike.
Meanwhile, the labor market has not shown clear signs of rapid weakening, so there is no strong case for a rate cut from that side either. The Financial Conditions Index also indicates that monetary policy remains on the accommodative side. Bloomberg financial conditions index is at highest level since March.
As markets increasingly recognize that no rate cuts are likely in the near term, and with the August 1 tariff deadline approaching amid potential rising risks of trade tensions between the U.S. and the EU, the dollar may gain further support. The U.S.–EU bond market spread also does not favor a stronger euro at the moment, adding to the dollar's upside potential.
In the short term, 98.10 and 98.53 are immediate support and resistance levels. If the dollar breaks above 98.53 again, upward momentum may strengthen and open the path toward the 100 level.
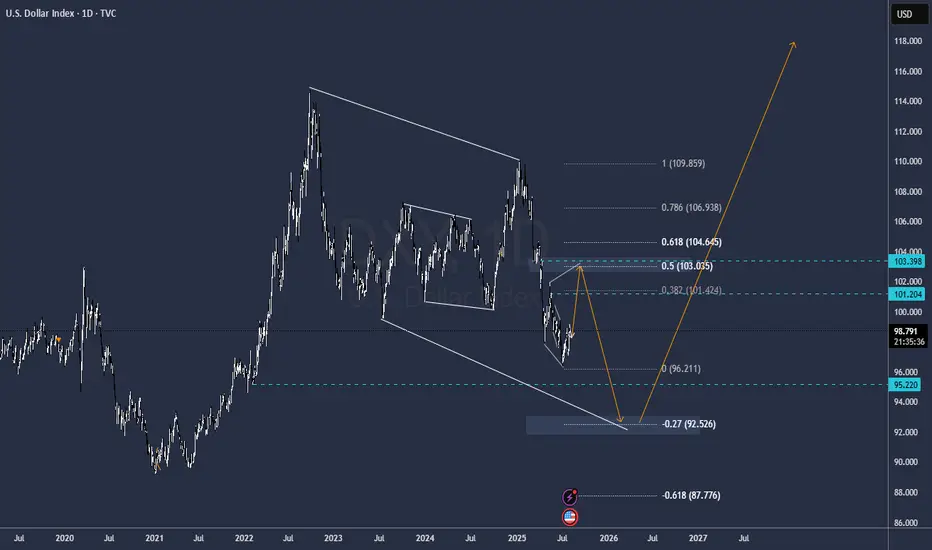
DXY BEARISH TREND 30-JUL 15-JUN 2025There are some major upcoming events that could significantly impact the US dollar index (DXY), including the ADP Non-Farm Employment Change and the Federal Funds Rate decision. Because of this, I expect the DXY to continue its downward movement until it reaches around 94.5. If it breaks below that level, it’s also possible that it could drop further and reach 89.00.
Currently, the DXY is expected to start its move downward from the 99.20–99.50 range, making a decline from that level quite likely

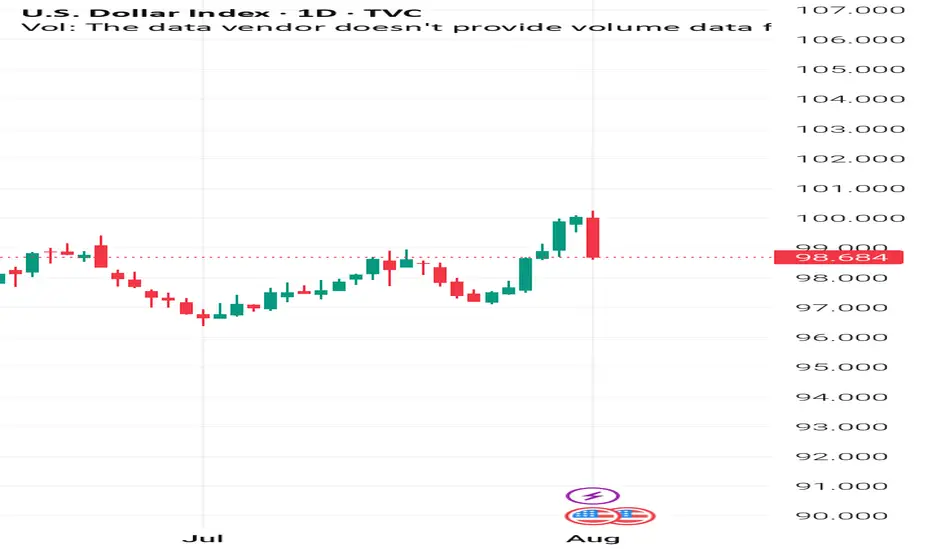
Data Release - Interest Rate DecisionJul 30 2025: Interest Rate Decision (4.5%)
Rates remain unchanged as expected.
OANDA:XAUUSD remains bearish with the help of GDP data.
TVC:DXY remains bullish with the help of GDP data. No major changes in either pairs.
Volatility is increased.
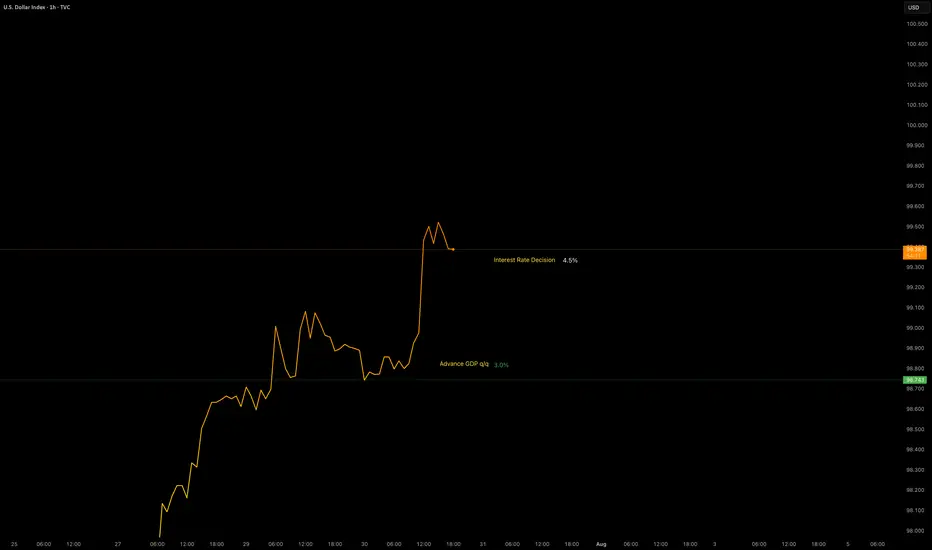
DOLLAR INDEX DXYThe latest U.S. economic data released on July 30, 2025 shows:
ADP Non-Farm Employment Change: Actual increase of 104,000 jobs, significantly above the forecast of 77,000. This marks a strong rebound from the previous decline of -23,000 in June and indicates solid labor market momentum, particularly in services sectors like leisure/hospitality, financial activities, and trade/transportation. However, education and health services saw job losses. Wage growth remains steady at 4.4% year-over-year for job-stayers.
Advance GDP q/q Growth: Actual growth came in at 3.0%, beating the forecast of 2.5% and improving sharply from -0.5% previously. This suggests that the economy is expanding robustly in the second quarter
Advance GDP Price Index q/q (Inflation measure): Actual was 2.0%, slightly below the forecast of 2.2%, and down from 3.8% previously, indicating easing inflation pressures .
Interpretation of this data for Federal Reserve policy:
The stronger-than-expected job growth and GDP expansion signal a resilient economy, which may reduce the immediate likelihood of Fed rate cuts, as these indicators support sustained economic momentum.
The slightly softer inflation reading on the GDP Price Index suggests inflation pressures are continuing to moderate, which could offer some flexibility to the Fed.
Overall, the Fed is likely to view this data mix as supportive of a cautious, data-dependent approach, possibly maintaining current rates in the short term without rushing to cut, but monitoring to ensure inflation stays on a downward path.
If the Fed prioritizes strong growth and a resilient labor market, rate hikes or holds are more likely than cuts. If inflation remains subdued, it could permit a gradual easing down the line but probably not immediately.
Let me know if you want a detailed outlook on market reactions to this release or the potential Fed communication following today’s data.
#GOLD

DXY still in downward channel. Rejection here = BTC rally The DXY is still in a downward sloping channel and trying to break back above the previous 2-year cycle low, but I think will reject here and kick off the next leg of the BTC rally.
Ideally we get a big DXY drop and ultimately break below the 95% level and on down into 'Bitcoin Super Rally Zone'🚀

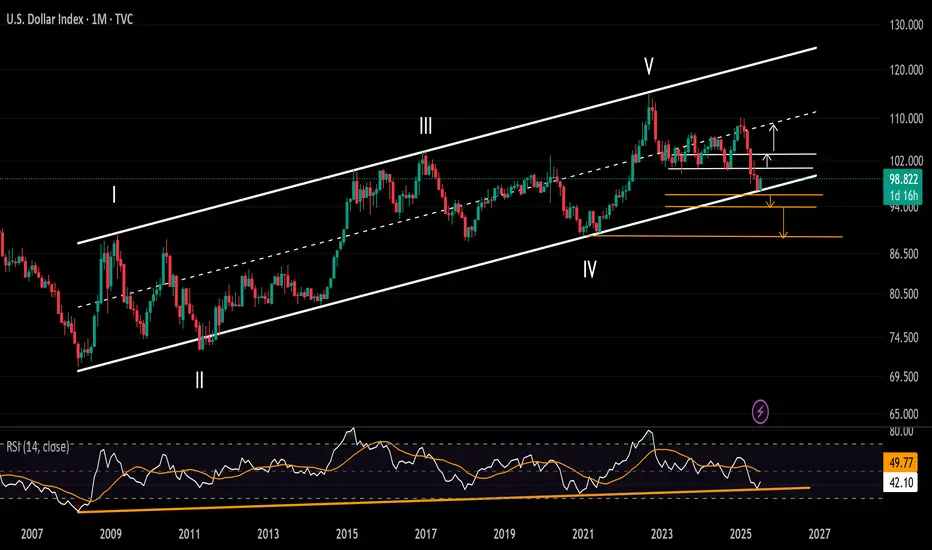
DXY Surge Pressures Currency Market in Volatile Market WeekThe US Dollar Index (DXY) has held its rebound off historical support zones on both the price chart and the RSI indicator throughout July. The monthly RSI is bouncing off a support line extending between the troughs of 2008 and 2020. Meanwhile, price action is rebounding from a support trendline that connects the lows of 2008, 2014, and 2021, within the 96–94 zone.
Bearish Scenario: A solid close below this support zone may confirm a long-term bearish signal, potentially pushing the index toward the 94 and 90 levels.
Bullish Scenario: A confident move above 100 and 103 could signal a reversal in the currency market, potentially leading the DXY back toward the mid-range of the long-standing channel between 105 and 107, originating from the 2008 lows.
Written by Razan Hilal, CMT
DXY warning of an incoming bear market?The DXY is into major multifactor support on the weekly timeframe. We have 2 weekly trendlines intersecting right at the 97.00 level. The first connects the highs from March 2020 through the lows of July 2023 to where we are now. The second is much larger and goes all the way back to 2007, connecting the lows from 2007, 2011 and 2021. We could see a major bounce here for months and some companies have reported during earnings that the sole reason for their improved earnings was due to weakness in the dollar. What happens to earnings when the DXY goes back into bull mode???? Time will tell...

DXY dayly structureMay change indeed
but its pretty much what meassures and current development is showing
GG
Bearish reversal?The US Dollar Index (DXY) is rising towards the pivot and could reverse to the 1st support.
Pivot: 99.24
1st Support: 98.27
1st Resistance: 99.97
Risk Warning:
Trading Forex and CFDs carries a high level of risk to your capital and you should only trade with money you can afford to lose. Trading Forex and CFDs may not be suitable for all investors, so please ensure that you fully understand the risks involved and seek independent advice if necessary.
Disclaimer:
The above opinions given constitute general market commentary, and do not constitute the opinion or advice of IC Markets or any form of personal or investment advice.
Any opinions, news, research, analyses, prices, other information, or links to third-party sites contained on this website are provided on an "as-is" basis, are intended only to be informative, is not an advice nor a recommendation, nor research, or a record of our trading prices, or an offer of, or solicitation for a transaction in any financial instrument and thus should not be treated as such. The information provided does not involve any specific investment objectives, financial situation and needs of any specific person who may receive it. Please be aware, that past performance is not a reliable indicator of future performance and/or results. Past Performance or Forward-looking scenarios based upon the reasonable beliefs of the third-party provider are not a guarantee of future performance. Actual results may differ materially from those anticipated in forward-looking or past performance statements. IC Markets makes no representation or warranty and assumes no liability as to the accuracy or completeness of the information provided, nor any loss arising from any investment based on a recommendation, forecast or any information supplied by any third-party.

DXY Goes 98.200 and then Bullish The DXY GOES 98.200 IN 1H OB then we see again dxy is bullish and next target is 99 to 100.

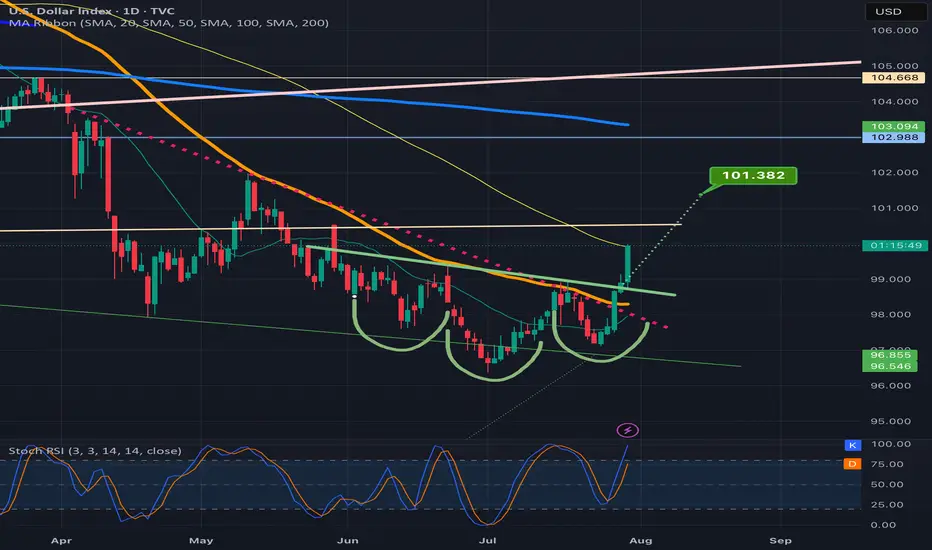
US Dollar Index (DXY) Reaches One-Month HighUS Dollar Index (DXY) Reaches One-Month High
The US Dollar Index (DXY) has risen to its highest level since early July. According to media reports, the bullish sentiment in the market is driven by the following factors:
→ Optimism around US trade agreements. A new trade deal with the EU — which includes a 15% tariff on European goods — is being perceived by the market as favourable for the United States.
→ Confidence in the resilience of the US economy. Strong Q2 corporate earnings have acted as an additional bullish catalyst. Investors may have started covering short positions against the dollar, viewing concerns over a US slowdown as overstated.
→ Expectations that the Federal Reserve will keep interest rates on hold.
From a technical standpoint, today’s DXY chart reflects strengthening bullish momentum.
Technical Analysis of the DXY Chart
Two U-shaped formations (A and B) that developed over the summer have created a bullish сup and рandle pattern — a formation that suggests waning bearish pressure, as evidenced by the shallower second dip.
This setup points to the potential for a bullish breakout above the trendline (marked in red) that has defined the downward movement in the DXY throughout the first half of 2025.
As previously analysed, there are signs that the dollar index may have found a base following a period of decline. This could indicate a shift in market sentiment and the possible end of the recent bearish phase.
This article represents the opinion of the Companies operating under the FXOpen brand only. It is not to be construed as an offer, solicitation, or recommendation with respect to products and services provided by the Companies operating under the FXOpen brand, nor is it to be considered financial advice.
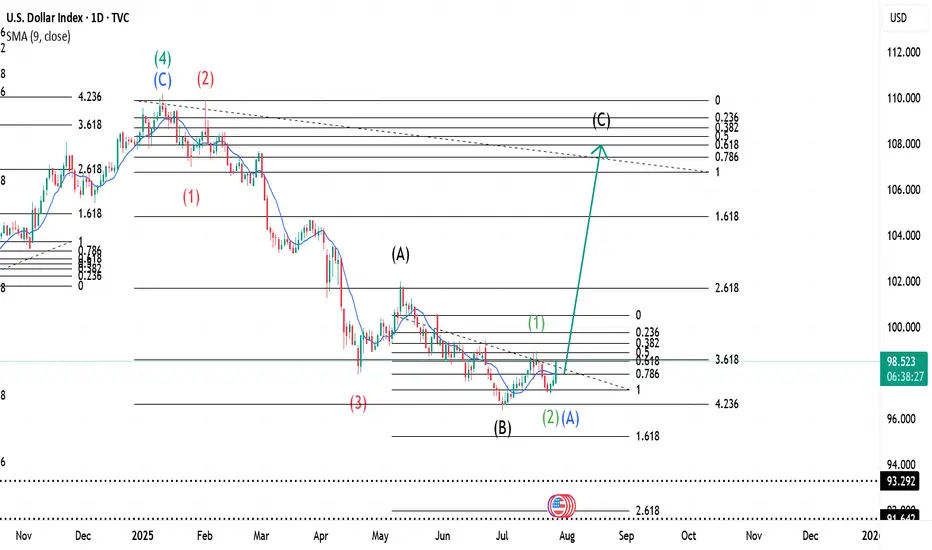
$ INDEX ~ Real Time Elliott Wave UpdatesThis is an update of a $ index chart I had previously posted. We see a Wave 1(Green) completed and a dip occurring. This dip is marked as Wave 2(Green) or Wave A(Blue). It has two readings because it could be a Zigzag, hence 2 or an A of a Flat, hence A. I will offer updates as the wave unfolds. All other analysis remains the same as I had previously posted and can be checked for references. Sentiment still remains buy.