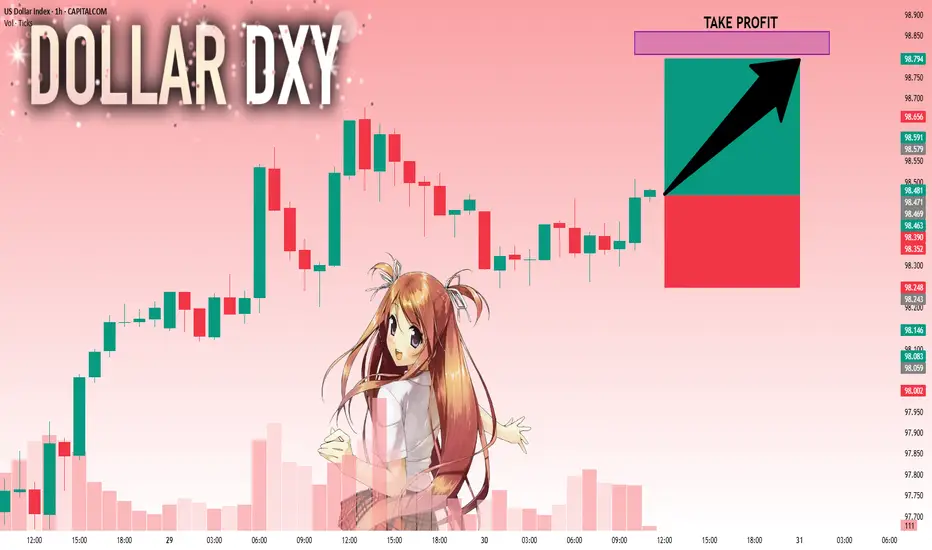
DXY at Its Most Critical Level of 2025 — Will the 100 Bank LevelThe Dollar Index (DXY), just like several other majors, is approaching a very important level. We’re now near the 100 mark, which is not only a psychological level — but also a key institutional (bank) level.
There’s also a gap zone left behind that price is about to fill. I believe the index will stay in a range over the next 1–2 days as it waits for critical data later this week — especially Wednesday’s announcements and Friday’s NFP report, which could set the tone for what’s next.
Based on current market sentiment, Trump’s remarks, Powell’s upcoming speech, and broader macro factors, I believe DXY has the potential to break above 100 and move toward 102–104, if that level is broken cleanly.
Let’s also not forget — price bounced from a monthly demand block near 96, and we’re seeing weak support across majors like EUR and Gold. That adds confluence for potential dollar strength.
📌 What do you think — is dollar strength just around the corner?
🔁 This analysis will be updated whenever necessary.
Disclaimer: This is not financial advice. Just my personal opinion.
USDX trade ideas
DXY HEADING INTO LAST WEEK OF JULY DXY ZONES
WEEKLY TF, TO DAILY, TO 4HR ANALYSIS.
The successful devaluation of the dollar by the administration since the election continues.
DXY dumped below key daily support at 97.600.
It was reclaimed but failed at key daily resistance dating back to 2024 — the same zone as the 0.382 Fibonacci level.
Failure to gain support at 97.580 (0.23 Fib level) = a bearish signal for the dollar index (DXY), potentially sending it back down to the 97.100–97.200 range. If that breaks, look for a further continuation toward the 96.700–96.800 zone.
This is a big week for news, reports, and interest rate decisions for the U.S., EUR, and CAD, as we close out July.
Still bearish on DXY for now.
However, if the dollar can break through the 97.950–98.000 range and catch support — then push past the 98.135–98.200 zone (0.618 Fib level) — I’ll be looking for a long entry on DXY up to the 98.900–99.400 zone for the next test.
Again, I remain bearish for now, but depending on the data and what the Fed does with U.S. rates, we could see a strong DXY this week. Until we pass those zones, I’m staying bearish.
New to trading (6 months in) — before you leave any hate comments:
I’m here to learn and would genuinely appreciate any advice or help in becoming better and more thorough.

USD Dollar Index (DXY): Pushing Higher As Forecast!Welcome back to the Weekly Forex Forecast for the week of July 30 - Aug1
In this video, we will analyze the following FX market:
USD Index
In my last USD video, the forecast was for higher prices. Check the related links below to see that video forecast. It played out exactly as analyzed. The +FVG was used to push for higher prices. The FOMC decision to keep the rate unchanged only pushed it further along.
Enjoy!
May profits be upon you.
Leave any questions or comments in the comment section.
I appreciate any feedback from my viewers!
Like and/or subscribe if you want more accurate analysis.
Thank you so much!
Disclaimer:
I do not provide personal investment advice and I am not a qualified licensed investment advisor.
All information found here, including any ideas, opinions, views, predictions, forecasts, commentaries, suggestions, expressed or implied herein, are for informational, entertainment or educational purposes only and should not be construed as personal investment advice. While the information provided is believed to be accurate, it may include errors or inaccuracies.
I will not and cannot be held liable for any actions you take as a result of anything you read here.
Conduct your own due diligence, or consult a licensed financial advisor or broker before making any and all investment decisions. Any investments, trades, speculations, or decisions made on the basis of any information found on this channel, expressed or implied herein, are committed at your own risk, financial or otherwise.

Will DXY Get Supported With Fresh US-EU Trade Agreement?Macro approach:
- The US dollar index has traded mixed since last week, pressured by lingering trade uncertainty and cautious market sentiment ahead of major economic events.
- Dovish Fed expectations and subdued US inflation continued to weigh on the greenback, while news of a fresh US-EU trade agreement and upcoming talks with China contributed to two-way price action.
- Economic data reflected a resilient labor market but flagged moderating US growth, with investors closely watching forthcoming GDP figures and the Fed's policy stance.
- The US dollar index may remain range-bound as markets await catalysts, including the Fed meeting, the 2Q GDP release, and key labor market data.
Technical approach:
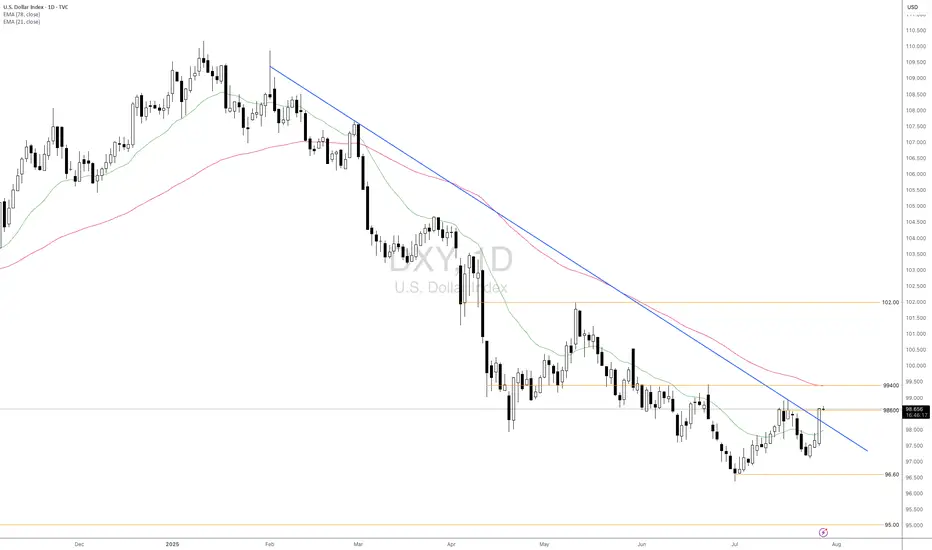
- DXY surged and closed above the descending trendline and the resistance at around 98600, indicating an early signal of a shift in the market trend.
- If DXY maintains above 98600, it may retest the following resistance at 99400, confluence with EMA78.
- On the contrary, closing below the descending trendline and EMA21 may prompt a retest of the swing low at 96.60.
Analysis by: Dat Tong, Senior Financial Markets Strategist at Exness
Why a USD Bounce Could Trigger a Stock PullbackThe US Dollar has faced brutal selling during the first half of 2025. Some are even questioning whether the Dollar’s global hegemony is at risk. Early in the year the US stock market AMEX:SPY sold off aggressively, falling 19% from mid‑March to early April. Since then stocks have more than regained their losses and the Dollar is still in the tank. So where does that leave us for the rest of the year?
The Dollar Inverse Correlation
The US Dollar has an inverse correlation to most everything. Stocks, bonds, crypto, commodities, real estate — all are measured in Dollars. Therefore when the Dollar loses value, all things equal it takes more of them to reach the same value those assets were denominated at before. Conversely when the Dollar rises, other assets lose value in Dollar terms. Here we can see a long standing inverse correlation to stocks AMEX:SPY
Dollar in oversold territory
The Relative Strength Index (RSI) is a momentum oscillator that measures the magnitude of recent price changes on a scale from 0 to 100 to help identify overbought (above 70) or oversold (below 30) conditions. The Dollar has hit oversold several times so far this year, but not yet staged a material recovery.
Stocks in overbought territory
Meanwhile stocks have staged a blistering rebound off the "Liberation Day" driven selloff earlier this year. The S&P 500 now sits at an all‑time high, and you guessed it, has tapped overbought twice this month.
USD is fundamentally attractive
Because investors seek to earn the highest available yield on their capital, they tend to move funds into currencies offering higher interest rates (and away from those with lower rates), so differences in policy rates across countries create incentives for cross‑border borrowing and lending that drive FX flows. For example the Fed ( ECONOMICS:USINTR ) is at 4.5%, and the ECB ( ECONOMICS:EUINTR ) is at 2.15%. Moreover the Dollar is down significantly against major trading pairs that have lower yields. In our prior example the Dollar is down 11.98% against the Euro YTD (1- FX:EURUSD ), leaving substantial room for capital gains. Gravity could lure FX traders back in the second half of 2025.
Tariff calculus
Tariffs tend to bolster the imposing country’s currency in two main ways: by making imports more expensive they reduce import volumes, improving the trade balance (i.e. fewer foreign‑currency outflows), and by collecting duties in domestic currency the government effectively withdraws that currency from circulation, increasing its relative scarcity. Both effects lift demand for—and support the value of—the home currency.
Putting it all together
Despite the TVC:DXY ’s ~10.8% YTD slide and repeated oversold conditions, the compelling carry trade sets the stage for a USD bounce that, in turn, could pressure overextended equities. With stocks stretched and the Dollar oversold, the carry‑driven rebound in USD could well presage a pullback in equities. Stocks are expensive, Dollars are cheap 🤑

DOLLAR INDEX The federal funds rate is the interest rate at which U.S. banks and credit unions lend their excess reserve balances to other banks overnight, usually on an uncollateralized basis. This rate is set as a target range by the Federal Open Market Committee (FOMC), which is the policymaking arm of the Federal Reserve. The current target range as of July 2025 is approximately 4.25% to 4.5%.
The federal funds rate is a key benchmark that influences broader interest rates across the economy, including loans, credit cards, and mortgages. When the Fed changes this rate, it indirectly affects borrowing costs for consumers and businesses. For example, increasing the rate makes borrowing more expensive and tends to slow down economic activity to control inflation, while lowering the rate stimulates growth by making credit cheaper.
The Fed adjusts this rate based on economic conditions aiming to maintain stable prices and maximum employment. It is a vital tool of U.S. monetary policy, impacting economic growth, inflation, and financial markets.
In summary:
It is the overnight lending rate between banks for reserve balances.
It is set as a target range by the Federal Reserve's FOMC.
It influences many other interest rates in the economy.
Current range (July 2025) is about 4.25% to 4.5%.
1. ADP Non-Farm Employment Change (Forecast: +82K, Previous: -33K)
Above Forecast:
If ADP employment is much stronger than expected, the Fed would see this as a sign of ongoing labor market resilience. Robust job growth would support consumer spending, potentially keep wage pressures elevated, and could make the Fed less likely to ease policy soon. This reinforces the case for holding rates steady or staying data-dependent on further cuts.
Below Forecast or Negative:
If ADP jobs gain falls short or is negative again, the Fed may interpret it as a weakening labor market, raising recession risk and reducing inflationary wage pressures. This outcome could increase the chances of a future rate cut or prompt a more dovish tone, provided it aligns with other softening indicators.
2. Advance GDP q/q (Forecast: +2.4%, Previous: -0.5%)
Above Forecast:
A GDP print above 2.4% signals surprisingly strong economic growth and likely sustains the Fed’s view that the U.S. economy is avoiding recession. The Fed may delay rate cuts or take a more cautious approach, as stronger growth can support higher inflation or at least reduce the urgency for support.
Below Forecast or Negative:
Weak GDP—especially if close to zero or negative—would signal that the economy remains at risk of stagnation or recession. The Fed may then pivot to a more dovish stance, become more willing to cut rates, or accelerate discussions on easing to avoid a downturn.
3. Advance GDP Price Index q/q (Forecast: 2.3%, Previous: 3.8%)
Above Forecast:
A significantly higher-than-expected GDP Price Index (an inflation measure) points to persistent or resurgent inflationary pressures in the economy. The Fed might see this as a reason to delay cuts or maintain restrictive rates for longer.
Below Forecast:
If the Price Index prints well below 2.3%, it suggests that inflation is cooling faster than anticipated. This outcome could allow the Fed to move toward easing policy if other conditions warrant, as price stability is more clearly in hand.
Bottom Line Table: Data Surprises and Likely Fed Reaction
Data Surprise Fed Outlook/Action
All above forecast Hawkish bias, rate cuts delayed or on hold
All below forecast Dovish bias, higher chances of rate cut
Mixed Data-dependent, further confirmation needed
Summary:
The Fed’s interpretation hinges on how these figures compare to forecasts and to each other. Stronger growth, jobs, and inflation = less rush to cut; weaker numbers = lower rates sooner. If growth or jobs are especially weak or inflation falls sharply, expect more dovish Fed commentary and a greater likelihood of future easing. Conversely, if the data all surprise to the upside, hawkish (rate-hold) messaging is likely to persist.
The U.S. Dollar Index (DXY) is a financial benchmark that measures the value of the United States dollar relative to a basket of six major foreign currencies. It provides a weighted average reflecting the dollar's strength or weakness against these currencies. The DXY is widely used by traders, investors, and economists to gauge the overall performance and health of the U.S. dollar on the global stage.
Key Features of the DXY:
Currencies included and their weights:
Euro (EUR) – 57.6%
Japanese Yen (JPY) – 13.6%
British Pound (GBP) – 11.9%
Canadian Dollar (CAD) – 9.1%
Swedish Krona (SEK) – 4.2%
Swiss Franc (CHF) – 3.6%
It was established in 1973 after the collapse of the Bretton Woods system to serve as a dynamic measure of the dollar's value.
The index reflects changes in the exchange rates of these currencies versus the U.S. dollar, with a higher DXY indicating a stronger dollar.
The DXY influences global trade dynamics, commodity prices (like oil and gold), and financial markets.
It is calculated as a geometric mean of the exchange rates weighted by each currency's significance in U.S. trade.
#DXY
In essence, the DXY is a crucial tool to assess how the U.S. dollar is performing against its major trade partners’ currencies, helping market participants make informed decisions in foreign exchange and broader financial markets.

FX Matrix: Dollar Index, GBP/USD & EUR/USDDollar Index : 99.394, 100.425 - 100.690
Euro: 1.14855 - 1.14477
GBP: 1.31643 - 1.31453

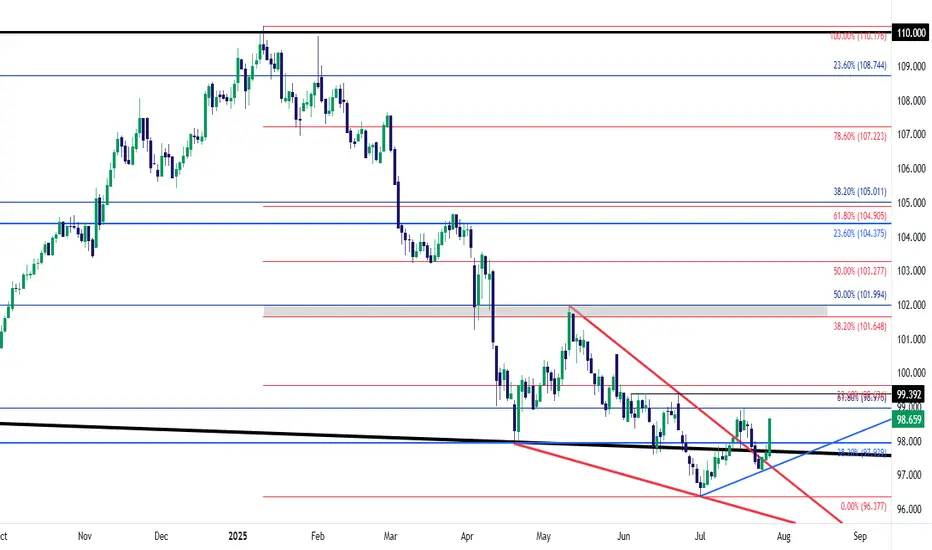
IS A HIGHER LOW SECURED ON THE DXY? LET'S FIND OUTIn this weekend analysis, I am still paying attention to the higher time frame downtrend on the dollar index while acknowledging the higher low support on the daily chart forming an inverse Head and Shoulders pattern. On the 4H and lower timeframes we have a strong ceiling made up of the 200SMA and 50SMA resistance level and need to break through from the 20SMA Line in the sand support. This weeks trade plan and thesis is for price to hold above the 20 SMA on the 4H timeframe expecting a potential dip to the zone of 97.128 (liquidity zone) and then bounce up to a weekly target of 97.7. This Thesis is INVALIDATED if a candle opens and closes below 97.015. I wish everyone a great trading week. Thank for supporting my publications and trade ideas. Cheers!!!

DXY - trade - market structure DXY - trade - market structure , easy setup, clean setup , good probability, if this happen is a big win, use risk and trade managment
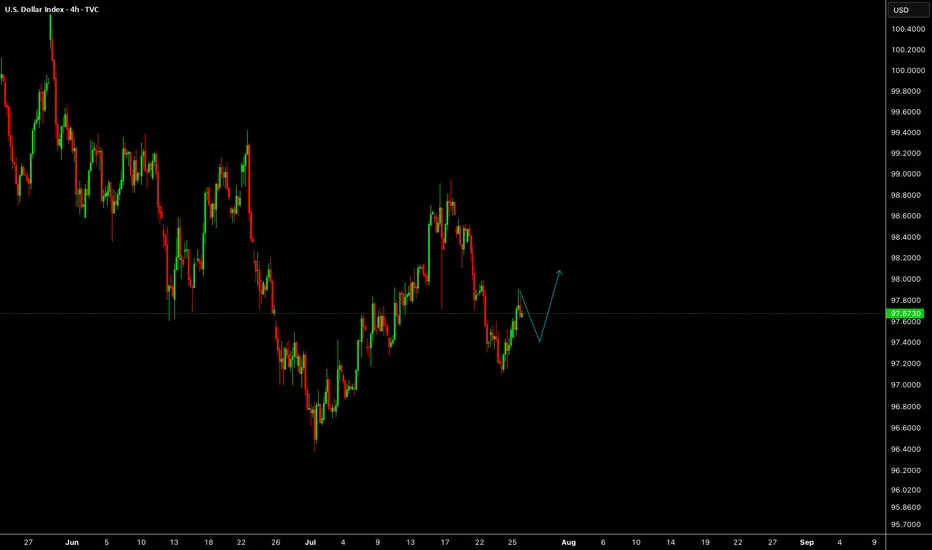
Decision Zone for DXY This Week: Around 97.600After a significant downward expansion in DXY, we observed a consolidation around last week's low. This week, the market opened with a pullback.
The first stop for this pullback appears to be the current daily fractal high candle and the weekly bearish FVG on the chart. We can assess potential selling pressure from this area on lower timeframes. We'll be monitoring the wicks within this zone, along with any newly forming FVGs.
If the price breaks above this area, our next points of interest will be the gaps within the zone above the 0.5 swing level, and ultimately the swing high itself as the final target.
Given the current setup, we believe there are promising trading opportunities on EURUSD.
Take care until the next update!

DXY: Bulls Are Winning! Long!
My dear friends,
Today we will analyse DXY together☺️
The in-trend continuation seems likely as the current long-term trend appears to be strong, and price is holding above a key level of 98.471 So a bullish continuation seems plausible, targeting the next high. We should enter on confirmation, and place a stop-loss beyond the recent swing level.
❤️Sending you lots of Love and Hugs❤️
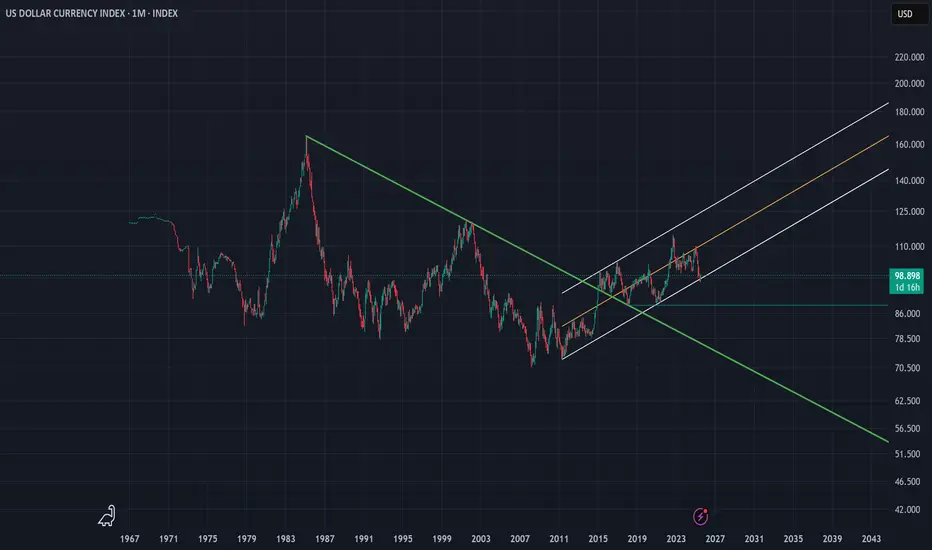
DXY | Timeframe: 1MWith the breakout of the downtrend line drawn since 1985 and its breach in late 2014, the DXY index officially entered a relatively stable upward trend and is currently oscillating within a parallel channel. Although, on the monthly timeframe, it has recently touched the lower boundary of the channel, we can expect at least a rise toward the channel’s midline. However, if the lower support of the channel is broken, a static support around the approximate rate of 88 can be considered a notable support level. Should this support also fail, the long-term downtrend dating back to 1985 would be regarded as the most important support for the DXY index. Meanwhile, moving averages such as the MA50, MA100, and other longer-period moving averages serve as dynamic supports along the way.
It is also worth mentioning that currently reaching the 120 level is considered an ideal target for the DXY index, and ultimately, it is by breaking this resistance zone that the index can reach its “Utopia”.
---------
I will try to continuously update this analysis of the TOTAL symbol according to market changes and developments. Also, I welcome reading your critiques and comments, so don’t forget to leave a comment!
DOLLAR INDEX The federal funds rate is the interest rate at which U.S. banks and credit unions lend their excess reserve balances to other banks overnight, usually on an uncollateralized basis. This rate is set as a target range by the Federal Open Market Committee (FOMC), which is the policymaking arm of the Federal Reserve. The current target range as of July 2025 is approximately 4.25% to 4.5%.
The federal funds rate is a key benchmark that influences broader interest rates across the economy, including loans, credit cards, and mortgages. When the Fed changes this rate, it indirectly affects borrowing costs for consumers and businesses. For example, increasing the rate makes borrowing more expensive and tends to slow down economic activity to control inflation, while lowering the rate stimulates growth by making credit cheaper.
The Fed adjusts this rate based on economic conditions aiming to maintain stable prices and maximum employment. It is a vital tool of U.S. monetary policy, impacting economic growth, inflation, and financial markets.
In summary:
It is the overnight lending rate between banks for reserve balances.
It is set as a target range by the Federal Reserve's FOMC.
It influences many other interest rates in the economy.
Current range (July 2025) is about 4.25% to 4.5%.
1. ADP Non-Farm Employment Change (Forecast: +82K, Previous: -33K)
Above Forecast:
If ADP employment is much stronger than expected, the Fed would see this as a sign of ongoing labor market resilience. Robust job growth would support consumer spending, potentially keep wage pressures elevated, and could make the Fed less likely to ease policy soon. This reinforces the case for holding rates steady or staying data-dependent on further cuts.
Below Forecast or Negative:
If ADP jobs gain falls short or is negative again, the Fed may interpret it as a weakening labor market, raising recession risk and reducing inflationary wage pressures. This outcome could increase the chances of a future rate cut or prompt a more dovish tone, provided it aligns with other softening indicators.
2. Advance GDP q/q (Forecast: +2.4%, Previous: -0.5%)
Above Forecast:
A GDP print above 2.4% signals surprisingly strong economic growth and likely sustains the Fed’s view that the U.S. economy is avoiding recession. The Fed may delay rate cuts or take a more cautious approach, as stronger growth can support higher inflation or at least reduce the urgency for support.
Below Forecast or Negative:
Weak GDP—especially if close to zero or negative—would signal that the economy remains at risk of stagnation or recession. The Fed may then pivot to a more dovish stance, become more willing to cut rates, or accelerate discussions on easing to avoid a downturn.
3. Advance GDP Price Index q/q (Forecast: 2.3%, Previous: 3.8%)
Above Forecast:
A significantly higher-than-expected GDP Price Index (an inflation measure) points to persistent or resurgent inflationary pressures in the economy. The Fed might see this as a reason to delay cuts or maintain restrictive rates for longer.
Below Forecast:
If the Price Index prints well below 2.3%, it suggests that inflation is cooling faster than anticipated. This outcome could allow the Fed to move toward easing policy if other conditions warrant, as price stability is more clearly in hand.
Bottom Line Table: Data Surprises and Likely Fed Reaction
Data Surprise Fed Outlook/Action
All above forecast Hawkish bias, rate cuts delayed or on hold
All below forecast Dovish bias, higher chances of rate cut
Mixed Data-dependent, further confirmation needed
Summary:
The Fed’s interpretation hinges on how these figures compare to forecasts and to each other. Stronger growth, jobs, and inflation = less rush to cut; weaker numbers = lower rates sooner. If growth or jobs are especially weak or inflation falls sharply, expect more dovish Fed commentary and a greater likelihood of future easing. Conversely, if the data all surprise to the upside, hawkish (rate-hold) messaging is likely to persist.
The U.S. Dollar Index (DXY) is a financial benchmark that measures the value of the United States dollar relative to a basket of six major foreign currencies. It provides a weighted average reflecting the dollar's strength or weakness against these currencies. The DXY is widely used by traders, investors, and economists to gauge the overall performance and health of the U.S. dollar on the global stage.
Key Features of the DXY:
Currencies included and their weights:
Euro (EUR) – 57.6%
Japanese Yen (JPY) – 13.6%
British Pound (GBP) – 11.9%
Canadian Dollar (CAD) – 9.1%
Swedish Krona (SEK) – 4.2%
Swiss Franc (CHF) – 3.6%
It was established in 1973 after the collapse of the Bretton Woods system to serve as a dynamic measure of the dollar's value.
The index reflects changes in the exchange rates of theses versus the U.S. dollar, with a higher DXY indicating a stronger dollar.
The DXY influences global trade dynamics, commodity prices (like oil and gold)

DXY forecast From weekly view the DXY is looking bearish at least till 95.123 key level the will see if we get a bullish power as the DXY is forming a reversal pattern. But of course many factors plays part in this economy, for example, global news like Tariffs and other factors.
So when DXY is trading on the 95.123 key level additional confluence will give us the right to put on trades, as the 95.123 key level is significant for what will take place next.
Take you all.......


Dollar Reversal? Inverse Head & Shoulders Spotted!Is the Dollar Index bottoming out? I break down a potential Inverse Head and Shoulders pattern forming on the DXY chart — a classic reversal setup that could signal a major trend change. See as I analyze the key neckline breakout zone, potential upside targets and golden zone fib support defended confirming the pattern.
I hope you find this informative. Thank you for the boosts, comments and discussions of the idea. Cheers and best wishes on every trade
# USDCHF, #AUDUSD, #USDJPY, #EURUSD, #GBPUSD Forex pairs

USD Rallies into a Major Week - Fed, PCE, NFP on the WayReversals of long-term moves can be tough to work with, especially for shorter-term traders.
While fundamentals are important for shaping future price moves and technicals are key for explaining past moves, while also allowing for strategy and risk management, it's sentiment and positioning that probably matter more.
Because if any and everyone in the world that wants to be long already is, well it doesn't matter how positive the news is if there's simply nobody left to buy. And if there's no influx of fresh demand, and only incoming supply, well, then price can drop, even on good news. And at that point, a heavy one-sided market will take notice of falling prices even in the face of good news, when price should be going up, and they'll be disconcerted to hold long positions, which can lead to even more supply, more selling, and in-turn, lower prices.
As the old saying goes, if a market doesn't rally on good news, well then look out below.
This shows in various ways on varying time frames in numerous markets but from a longer-term perspective, that shifting trend is akin to turning a cruise ship in the middle of the ocean - it's not going to happen suddenly. It takes time, it takes shifting, and it takes the slow grind of late-to-the-trend bulls turning into ahead-of-the-curve sellers.
This is what allows for the build of wedges, just as I had looked at earlier in the month in both USD and EUR/USD. Bulls suddenly get shy as prices approaches highs, although they remain aggressive on pullbacks and tests of support. This leads to a weaker trendline atop the move and, eventually, unless buyers get motivated to punch up to higher-highs with a new breakout, that motive for profit taking can soon take over.
In the USD, the sell-off in the first half of this year was a grinding matter, and the polar opposite of the trend that had held in DXY as we came into 2025. But, now the question is whether resilient US data leads to profit taking from bears and as we saw again last week, sellers have been showing lacking motivation at tests of lows or around support.
The big question for this week is whether we see that shift take-hold on a larger basis. We've seen sellers getting shy around lows, but are buyers ready to punch up to fresh highs in the USD? There's certainly ample potential for motivation as given the economic calendar with FOMC, Core PCE and NFP in the final three days of this week. - js
DXY bullishDXY is in the early stage of a bull market, so no one want dollars but in my view but the trend is your friend.
This could be a impulsive 5 of 5 or a B of ABC but both are bullish, another view is that the EURO have been a bad day when the US and EU reach tariff agreement??
The lagging indicators are changing or I hope, but this bullish trend for the Dollar could continue for weeks...

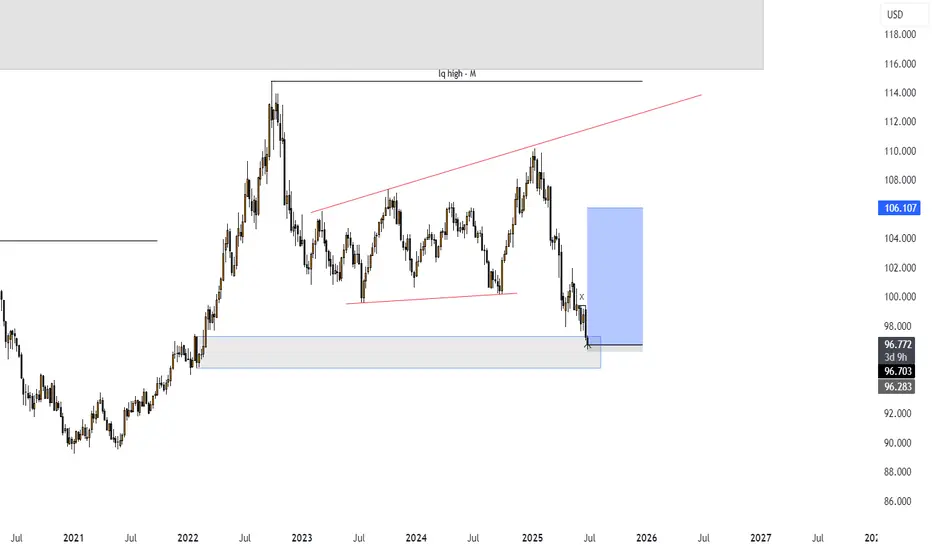
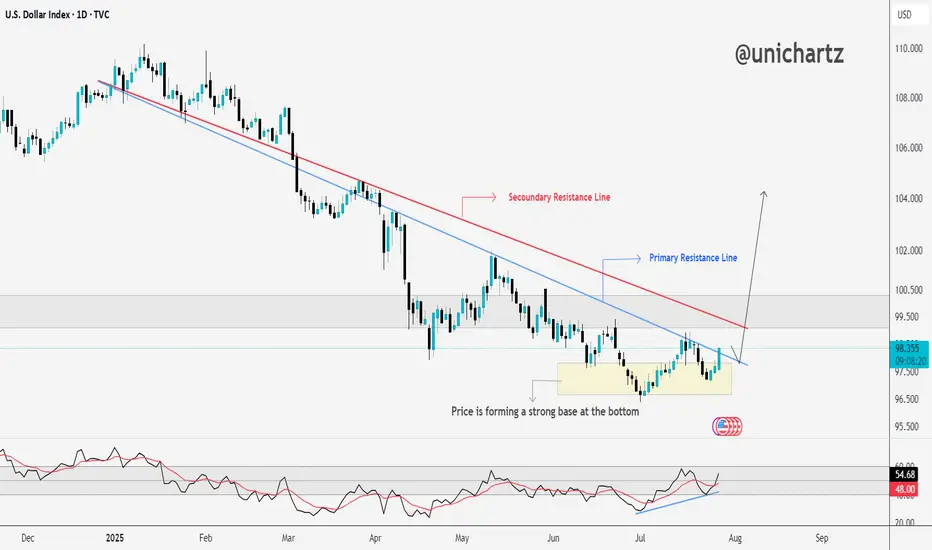
DXY Approaching Key Resistance — Trend Reversal Ahead?The DXY is forming a strong base at the bottom, showing clear signs of accumulation after a long downtrend.
Price has started pushing upward and is now approaching the secondary resistance line. A breakout here could open the path toward the primary resistance zone, which has capped rallies in the past.
The RSI is also trending higher, supporting this potential move.
If bulls clear the red resistance line, momentum could accelerate quickly.
DYOR, NFA

DXY Outlook: Can Fed Hold Spark a Move Toward 100?DXY Weekly Forecast – July Week 4
After reaching 96.50 early this month, DXY began showing bullish signs. Last week, price retested the extreme demand zone at 97.00 and closed with a bearish weekly candle that held some bullish pressure at the base.
This week, all eyes are on the Federal Reserve meeting. If the Fed holds rates steady, the dollar could strengthen further. A weekly close above 97.90 would confirm the breakout and open the door to a run toward 100.00 — a key psychological and technical level.
Bias: Bullish (if 97.90 breaks)
Key Zones:
• Demand: 97.00
• Breakout Level: 97.90
• Target: 100.00
This could be the beginning of a fresh bullish leg — especially if macro conditions align with technical structure.
—
Weekly forecast by Sphinx Trading
Let me know your bias in the comments.
#DXY #DollarIndex #ForexForecast #SphinxWeekly #SmartMoney #FOMC #USD #InterestRates

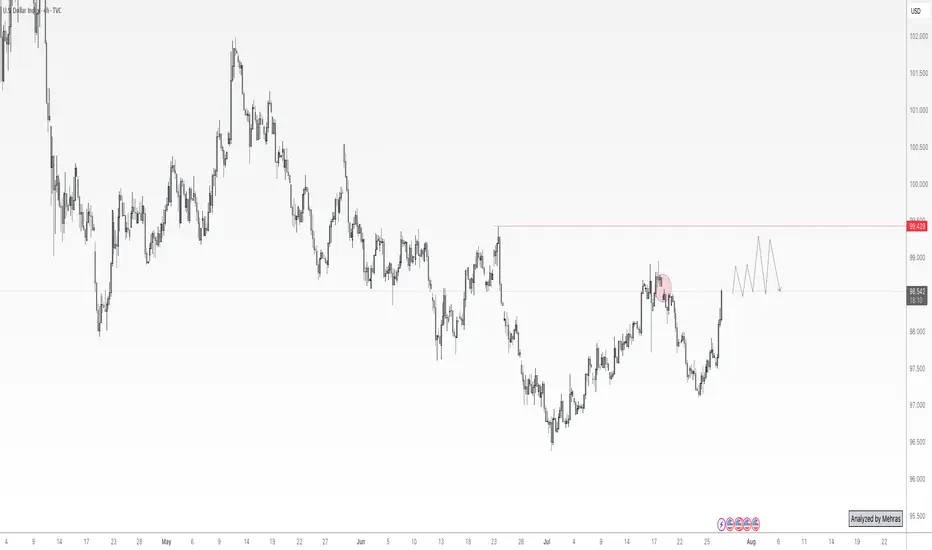
DXY 4Hour TF - July 27, 2025DXY 7/27/2025
DXY 4hour Bearish Idea
Monthly - Bearish
Weekly - Bearish
Dailly - Bearish
4hour - Bearish
**We analyze DXY as an indicator of USD strength on a week to week basis**
This week is looking like we can expect bearish momentum on USD but here are two scenarios breaking down the potential:
Bearish Continuation - USD pulled a strong bearish reversal all last week which pushed us below our major 98.000 support zone.
We are now testing that same 98.000 zone as resistance and are looking to see if it will hold. Ideally, we can confirm further bearish structure to gain confidence in a bearish USD for the week ahead.
Bullish Reversal- For us to consider DXY as bullish again we would need to see bullish structure above our 98.000 zone. This would include: A break back above 98.000 with an established HH and HL.

DXYDXY needs some more correction, if the correction is completed before Feds decision then a drop can follow otherwise Feds will push it up and NFP will drop it again.
Disclosure: We are part of Trade Nation's Influencer program and receive a monthly fee for using their TradingView charts in our analysis.