DXYTHE DOLLAR INDEX .
key data report ,22nd the fed chairman Powell speaks and on 24th we are expecting Unemployment Claims.
watch this data as they will shape the trade directional bias.
Key Factors Behind Today's Drop
1. Rising Global Risk Appetite and Strong Foreign Currencies
Investors are showing increased appetite for non-dollar assets today. The euro, yen, and pound have all strengthened—most notably, the dollar fell nearly 1% against the yen after political developments in Japan and a positive outlook in Europe.
European optimism was boosted by encouraging business survey results, while political clarity in Japan lifted the yen and added further selling pressure on the dollar.
2. Lower U.S. Treasury Yields
Softening U.S. yields contributed to the dollar’s weakness. Lower yields typically make the dollar less attractive relative to other currencies, further encouraging outflows.
Investors are reassessing Federal Reserve rate cut odds and show caution ahead of the July 31 Fed meeting.
3.Uncertainty Over Tariffs and U.S. Policy
Heightened anxiety around upcoming U.S. tariffs (with an August 1 deadline) and erratic policy signals are dampening confidence in the dollar as a safe haven.
Speculation over Fed independence, including market chatter about potential challenges to Chair Powell’s role, has hurt trust in U.S. monetary policy stability, fueling additional dollar selling.
Conclusion
The dollar index’s drop from its ascending trend line today is the result of a perfect storm of increased foreign currency strength, risk-seeking investor sentiment, declining U.S. yields, persistent policy and tariff uncertainty, All of these factors have combined to drive sellers selling momentum ,they will continue to push the index to its lowest levels and my structure is giving me 94-94.5 level.
trading is 100% probailty,trade with caution.
USDX trade ideas

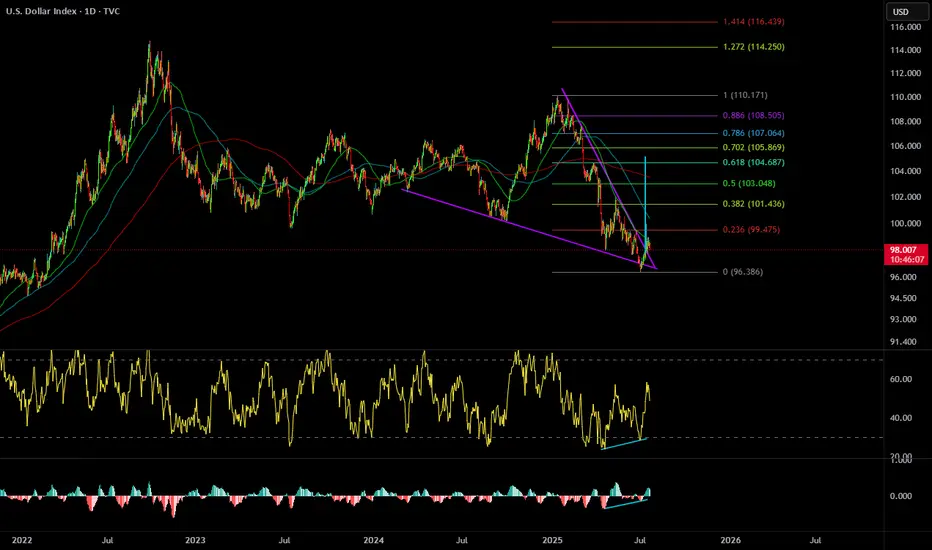
USD Snapback - Long-Term Trendline Back in-PlayThe trendline that originated in 2001 and connected to the 2020 high came in to hold the lows in July of 2023, and then again on Easter Monday. That level also held as support in June albeit temporarily, as bears grinded a sell-off into the Q2 close.
In early-Q3 trade, that trendline was resistance on a few different occasions, until buyers could eventually take it out. And then last week, on the heels of Trump's threat to fire Jerome Powell, price hurriedly pulled back until, eventually, support arrived via that same trendline projection, which is shown in black on the chart.
Now that trendline is back in-play as a test of today's lows. Given the persistent failure from USD bulls to fire anything more than a pullback, combined with the very clear push for USD-weakness from the current administration, it can be difficult to muster a bullish fundamental bias. But - this move had become very one-sided with that sell-off in the first-half of the year so the way that buyers respond to these support tests will be key for whether or not the currency can finally show a reversal theme for more than a couple of weeks. - js

U.S. Dollar (DXY) bearish?Will dollar continue its bearish momentum or will it reverse?
Technical Summary
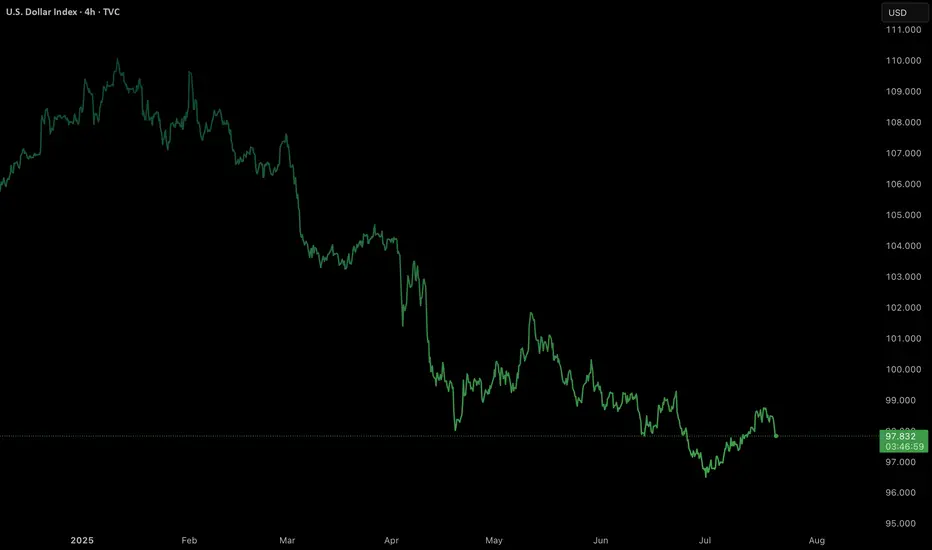
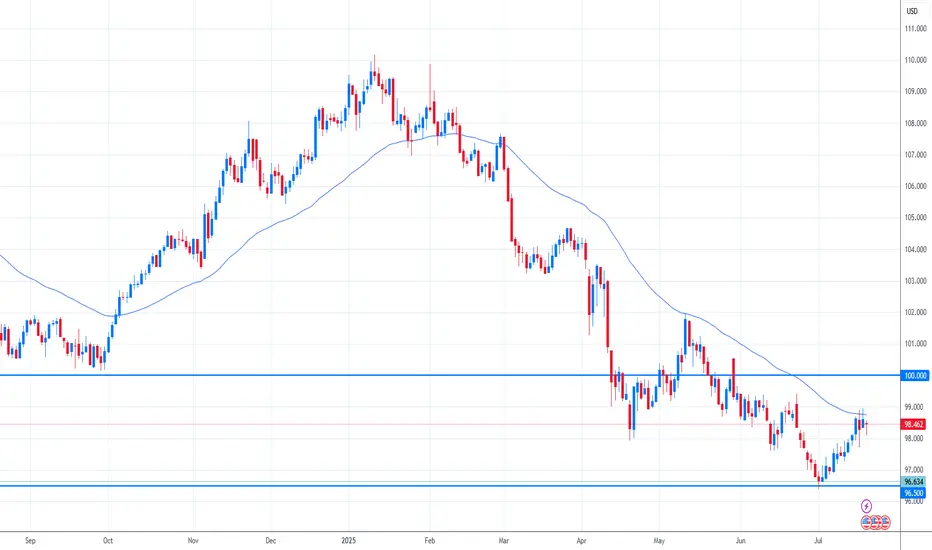
DXY remains in a firm bearish trend, having dropped around 11% this year. The setup is formed by a chain of lower highs and lower lows, confirming an unrelenting downtrend.
Support Level: ~97.70
Resistance Zone: 98.55–98.80
Long-Term Outlook: Bearish, unless a clear break and close over the resistance zone on the daily or weekly timeframe.
Technically, the momentum indicators remain weak, and the failure to sustain rallies above the 99.00 level also contributes to downward pressure further. The market is now consolidating within a narrow range after steep selling, which suggests probable continuation if macro catalysts are favourable.
Fundamental and Sentiment Drivers
Several macroeconomic and geopolitical drivers are underpinning the weakening of the U.S. dollar:
Federal Reserve Uncertainty:
Speculation over the ultimate fate of Federal Reserve Chairman Jerome Powell under political pressure from the executive branch has severely undermined investor confidence in the central bank’s independence. This has been manifested in increased volatility and bearish pressure on the dollar.
Trade Policy and Tariff Risks:
Ongoing trade tensions, including the possibility of sweeping tariffs (15–20%) on Chinese and European Union goods, have created a risk premium on valuations of the U.S. dollar. Market players still fear retaliation and its effects on trade stability in the world.
Fiscal Position and Credit Ratings:
The US fiscal deficit, which is approaching 7% of GDP, and recent credit rating downgrades to its outlook, have set alarms ringing regarding the structure. These fiscal developments have eroded the popularity of the US dollar as a safe-haven asset, particularly with foreign investors.
Global Monetary Landscape:
With European Central Bank and Bank of Japan maintaining policy guidance tight, and Federal Reserve already indicating that direction for a rate cut in Q4 2025 is being eyed, the falling rate differentials still maintain pressure on the dollar.
Market Outlook: Week of July 21–25, 2025
Major Geopolitical and Economic Events:
DATE : Ongoing
EVENT : U.S.- EU & U.S. — China Trade Negotiations.
MARKET RELEVANCE : High
Resolution or escalation will directly impact USD demand.
DATE : Mid-week
EVENT : Federal Reserve Speeches (including Powell)
MARKET RELEVANCE : High
Monetary policy guidance and institutional stability.
DATE : July 24–25
EVENT : Jobless Claims, Flash PMIs, New Home Sales, Durable Goods Orders
MARKET RELEVANCE : Medium–High
Labour market data, housing data, and production activity have the potential to shift rate expectations and dollar sentiment ahead of the FOMC and PCE releases.
Strategic Implications
Outlook: DXY remains structurally bearish in the short to medium term. Additional weakness below 98.80 and sustained closes below 97.70 would reassert downward momentum, risking a further retracement to the 96.00-95.50 region.
Possible Bullish Reversal Triggers:
A conclusive resolution to U.S. trade negotiations.
Unexpectedly solid economic data (particularly core inflation or employment).
Hawkish Fed commentary supporting policy tightening expectations.
Last thoughts
The U.S. Dollar Index is currently at structurally weak technical and fundamental foundations. Absent a sudden reversal of the monetary policy message or geopolitical resolution, the path of least resistance appears to remain to the lower side. Market participants need to pay special attention to upcoming economic data releases, central bank rhetoric, and trading news because any one of them could be a pivotal driver of near-term dollar behavior.
DXY Bearish Breakout! Sell!
Hello,Traders!
DXY is trading in a strong
Downtrend and the index
Made a bearish breakout
Out of the bearish flag pattern
So we are bearish biased
And we will be expecting
A further bearish move down
Sell!
Comment and subscribe to help us grow!
Check out other forecasts below too!
Disclosure: I am part of Trade Nation's Influencer program and receive a monthly fee for using their TradingView charts in my analysis.

DXY to establish weekly low then a run higher I'd like to see a weekly low form at the outlined level and find support then rally higher
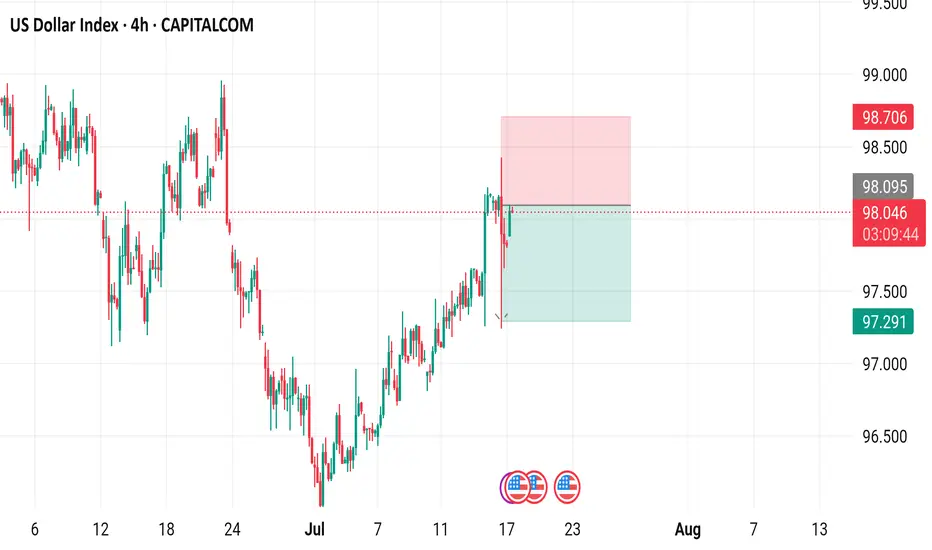
US Dollar Index (DXY) - 4 Hour Chart4-hour performance of the US Dollar Index (DXY) from CAPITALCOM, showing a current value of 98.040 with a 0.23% increase (+0.222). The chart includes recent buy and sell signals at 98.094 and 98.040, respectively, with a highlighted resistance zone around 98.706-99.000 and a support zone around 97.291-98.040. The timeframe covers data from early July to mid-August 2025.
what ifdxy view i just want to leave there for my lulz and see what happens in a couple years so i can lol at myself yet again

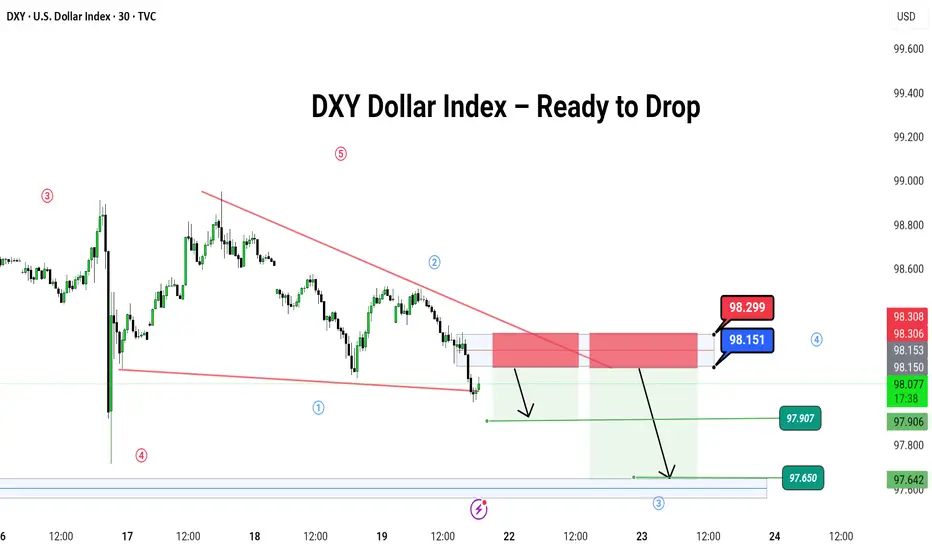
DXY Dollar Index – Ready to Drop
🌪️ DXY Dollar Index – Ready to Drop Like a Hot Potato? 💸
Hey traders! 🎯
The DXY (U.S. Dollar Index) is dancing inside a falling wedge 🔻, and it just hit the top of the party zone (red box 🎁).
📍 We're watching for a bounce up to this red zone near 98.151–98.299, then expecting a big slide down like a rollercoaster 🎢 toward:
🎯 Target 1: 97.907
🎯 Target 2: 97.650
🛑 Stop if it jumps over: 98.299
🌀 Pattern: Ending Diagonal / Wave 5 Setup
🧠 Logic: Smart money might be setting up the final wave before a major fall. Let it pop, then drop!
💡 It’s like the last spark before the fireworks go out 🎆
---
#DXY #USDIndex #ForexTrading #Wave5 #PriceAction #ChartPattern #SimpleTrading #DollarDrop
---
Let me know if you have ant suggestion ,
DXYThe current COT data shows a bullish bias for the U.S. Dollar, with institutional traders positioning net long. Although DXY is moving sideways, this positioning suggests a likely continuation of USD strength. If price breaks above key resistance levels, it would confirm the bullish sentiment reflected in the COT report.

Correction As long as the indicator does not stabilize above the green resistance area, there is a possibility of a trend change and the start of a downtrend.

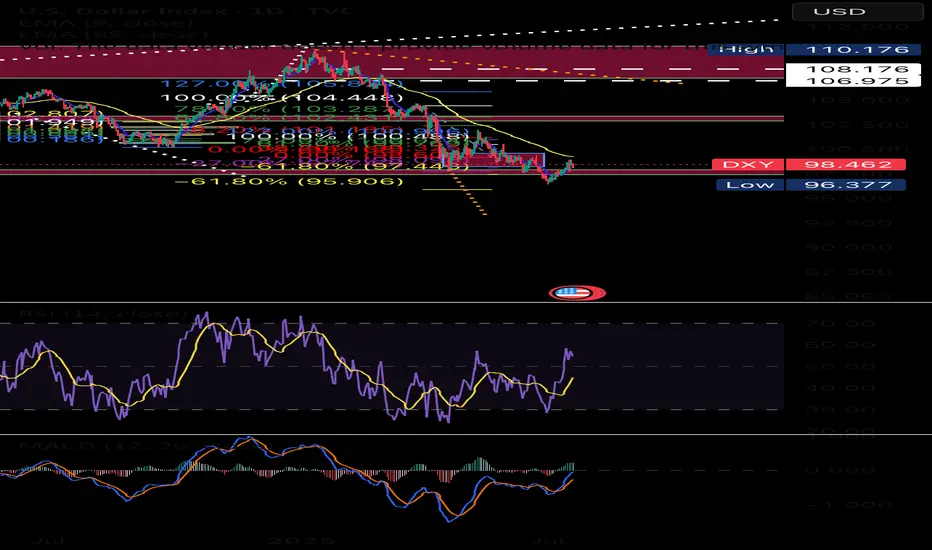
Dollar $DXY Bullish WedgePretty clean falling wedge with divergence. Aligns with a pullback to come on BTC and Stocks.
A move back to 104 area would do some damage to risk on assets.
Follow for updates.
Bearish drop off 50% Fibonacci resistance?The US Dollar Index (DXY) is rising towards the pivot which acts as a pullback resistance and could drop to the 1st support.
Pivot: 99..15
1st Support: 96.54
1st Resistance: 100.57
Risk Warning:
Trading Forex and CFDs carries a high level of risk to your capital and you should only trade with money you can afford to lose. Trading Forex and CFDs may not be suitable for all investors, so please ensure that you fully understand the risks involved and seek independent advice if necessary.
Disclaimer:
The above opinions given constitute general market commentary, and do not constitute the opinion or advice of IC Markets or any form of personal or investment advice.
Any opinions, news, research, analyses, prices, other information, or links to third-party sites contained on this website are provided on an "as-is" basis, are intended only to be informative, is not an advice nor a recommendation, nor research, or a record of our trading prices, or an offer of, or solicitation for a transaction in any financial instrument and thus should not be treated as such. The information provided does not involve any specific investment objectives, financial situation and needs of any specific person who may receive it. Please be aware, that past performance is not a reliable indicator of future performance and/or results. Past Performance or Forward-looking scenarios based upon the reasonable beliefs of the third-party provider are not a guarantee of future performance. Actual results may differ materially from those anticipated in forward-looking or past performance statements. IC Markets makes no representation or warranty and assumes no liability as to the accuracy or completeness of the information provided, nor any loss arising from any investment based on a recommendation, forecast or any information supplied by any third-party.

DXY Eyes Breakout – Dollar Strength Gaining GroundThe U.S. Dollar Index (DXY) is testing its 50-day moving average on the daily chart, with bulls eyeing a potential breakout. A move above 98.75 could confirm a short-term trend reversal and open the path for further gains.
Stronger-than-expected U.S. economic data continues to support the greenback. Recent inflation prints, job market resilience, and solid retail spending have pushed back expectations for imminent Fed rate cuts. This shift in rate outlook provides fundamental support for the dollar.
In addition, strong U.S. corporate earnings are bolstering equity markets, attracting capital flows into U.S. assets and indirectly supporting dollar demand. Rising Treasury yields, especially on the short end, also offer more attractive returns for dollar-based investments.
Geopolitical uncertainties and trade tensions in Asia and Europe are prompting a rotation into the dollar as a safe-haven currency.
Meanwhile, some emerging market currencies are under pressure, increasing global demand for dollar liquidity.
Technically, a close above 98.75 could confirm bullish momentum, with 99.80 as the next upside target. As long as macro and risk dynamics lean in the dollar’s favor, DXY may continue its rebound from recent lows.
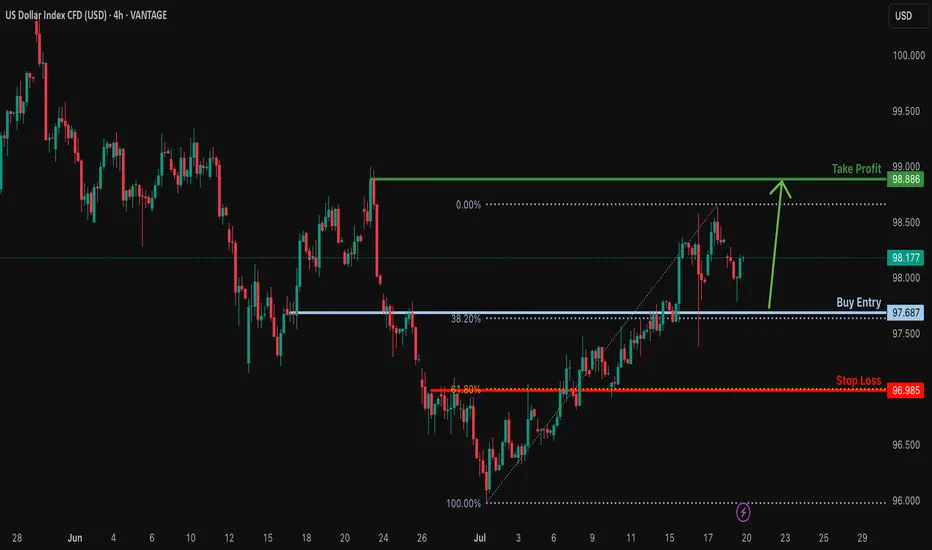
Bullish continuation for the Dollar?The price is falling towards the support level which is a pullback support that lines up with the 38.2% Fibonacci retracement and could bounce from this level to our take profit.
Entry: 97.68
Why we like it:
There is a pullback support that aligns with the 38.6% Fibonacci retracement.
Stop loss: 96.98
Why we lik eit:
There is an overlap support that aligns with the 61.8% Fibonacci retracement.
Take profit: 98.88
Why we like it:
There is a pullback resistance.
Enjoying your TradingView experience? Review us!
Please be advised that the information presented on TradingView is provided to Vantage (‘Vantage Global Limited’, ‘we’) by a third-party provider (‘Everest Fortune Group’). Please be reminded that you are solely responsible for the trading decisions on your account. There is a very high degree of risk involved in trading. Any information and/or content is intended entirely for research, educational and informational purposes only and does not constitute investment or consultation advice or investment strategy. The information is not tailored to the investment needs of any specific person and therefore does not involve a consideration of any of the investment objectives, financial situation or needs of any viewer that may receive it. Kindly also note that past performance is not a reliable indicator of future results. Actual results may differ materially from those anticipated in forward-looking or past performance statements. We assume no liability as to the accuracy or completeness of any of the information and/or content provided herein and the Company cannot be held responsible for any omission, mistake nor for any loss or damage including without limitation to any loss of profit which may arise from reliance on any information supplied by Everest Fortune Group.
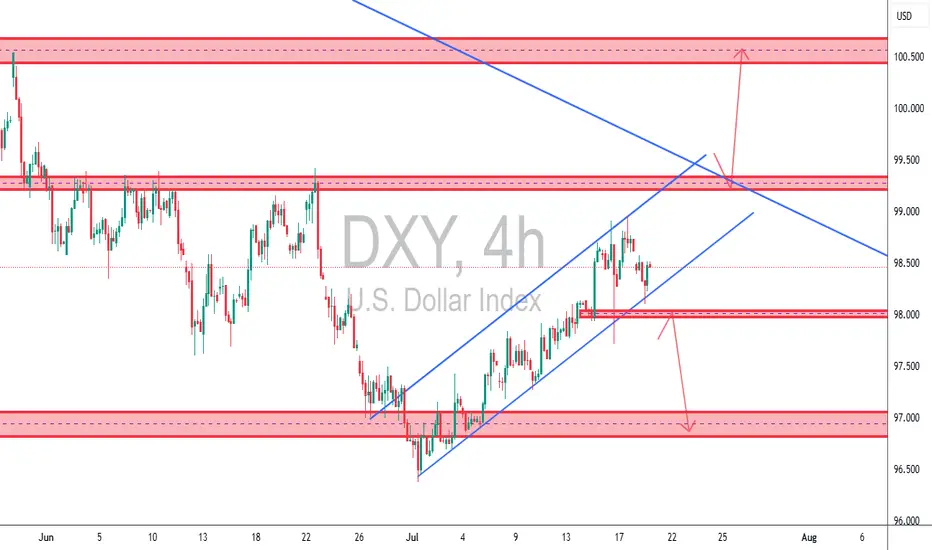
TCB Strategy Application on DXY 4H✅ TCB Strategy Application on DXY 4H
🔹 Trend → Countertrend → Breakout Structure:
• Trend: We’ve had a bullish recovery from the 97.00 zone (bottom demand), moving within an ascending channel.
• Countertrend Zone: Price has now pulled back from the 99.00–99.200 supply area.
• Breakout Watch:
o A break below the ascending channel (support line) + 98.00 zone would signal countertrend breakout → opens potential for 97.000 retest.
o A break above 99.200 would be a bullish breakout targeting the 100.500–101.000 macro supply zone.
________________________________________
🔄 What This Means for Dollar Pairs (Especially XAUUSD):
🟥 Scenario 1: Bearish DXY Breakout (98.00 loss)
• Expect XAUUSD bullish continuation, possibly reclaiming upside zones (especially if DXY targets 97.00).
• GBPUSD, EURUSD, etc., likely to gain against USD.
🟩 Scenario 2: Bullish DXY Breakout (Above 99.200)
• XAUUSD may reject from resistance or fall back toward support zones.
• USD strength will put pressure on GBPUSD, EURUSD, and other majors.
________________________________________
🧠 TCB Notes:
• Checklist Score (Pre-Breakout): ~75%
o ✔ Structure zones marked
o ✔ Channel support tested
o ✔ Reaction to supply zone
o ✖ Awaiting breakout candle + NY session confirmation
________________________________________
🔔 Suggested Alerts (Set in TradingView):
• DXY Breakout Alert: 98.00 (bearish trigger)
• DXY Bullish Trigger Alert: 99.20 or trendline breakout
• Match these alerts with corresponding TCB setups on XAUUSD, GBPUSD, etc.
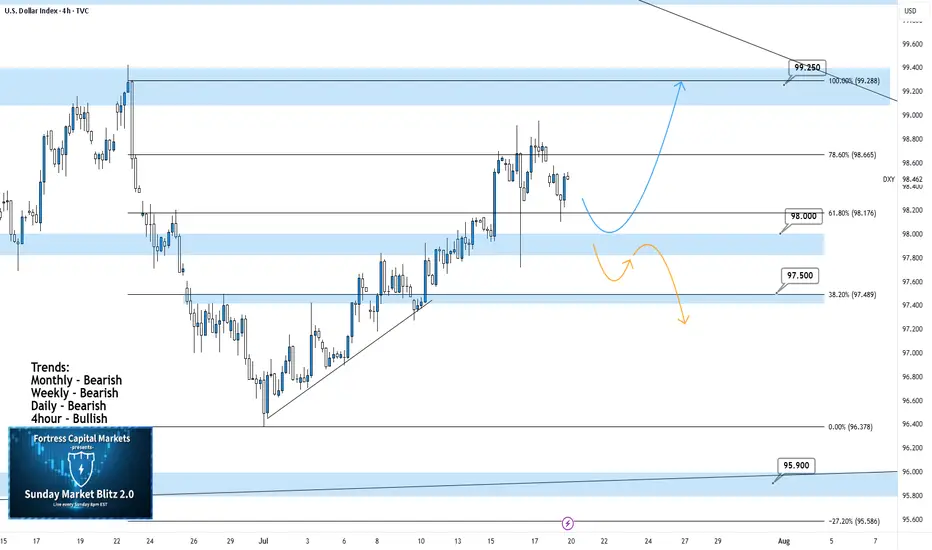
DXY 4Hour TF - July 20th, 2025DXY 7/20/2025
DXY 4hour Neutral Idea
Monthly - Bearish
Weekly - Bearish
Dailly - Bearish
4hour - Bullish
Higher timeframe trend analysis suggests that DXY is primarily bearish and is currently retracing to potential resistance.
Going into this week we are looking to see if our 98.000 zone will stay as support or transition into resistance. Here are two scenarios which highlight both a bullish and bearish outcome:
Bullish Continuation - Last week we saw a strong rally through our 98.000 zone which seems to still be holding. If this 4hour bullish trend is to continue we would like to see some sort of rejection off 98.000 support while also confirming a higher low. If this happens look to target higher toward major resistance levels like 99.250.
Bearish Reversal- If we are to consider DXY bearish again on the 4hour we would need to see a break below 98.000 support and confirm this level as new resistance.
There are a few major support levels to watch out for but DXY has the potential to fall dramatically if we see price get below 97.500.
$DXY🧠 What if the U.S. is intentionally slowing down the economy to weaken the dollar…
Letting the Chinese yuan strengthen so China is forced to shift from exports to consumption?
A stronger yuan means China imports more.
That’s a win for U.S. companies ready to sell.
DXY is on real powerful uptrend!hi all. for who wants to know the Long Term Direction of the market, DXY is the key. market end the retrace leg and will jump up. As you see the Tariffs effect Started and in quote of President Trump, MAGA. be happy and have a powerful trade (wink)

DXYDXY still have some more upside, let the market correct and push up further.
Disclosure: We are part of Trade Nation's Influencer program and receive a monthly fee for using their TradingView charts in our analysis.
DOLLAR INDEX TO COMPLETE WAVE 5 TARGET at 98.866In this short video I dive into the technical breakdown of the U.S. Dollar Index (DXY) as it approaches the anticipated Wave 5 surge, aiming for the key resistance level of 98.866. Using Elliott Wave Theory, this analysis maps out the market’s current structure on the 4 hours timeframe, highlights critical pivot zones, and projects the bullish momentum that could reshape short-term outlooks. Whether you're a seasoned trader or a curious observer, this chart-driven insight offers clarity in the wave progression and what might come next.

FX Matrix: DXY, EUR/USD, GBP/USD Weekly AnalysisWeekly Targets: (Gun to my head)
DXY: 99.957, 100.424, 100.689
GBPUSD: 1.31643, 1.31453,

USD Is Still Bullish! Wait For Buys!Welcome back to the Weekly Forex Forecast for the week of July 21-25th.
In this video, we will analyze the following FX market:
USD
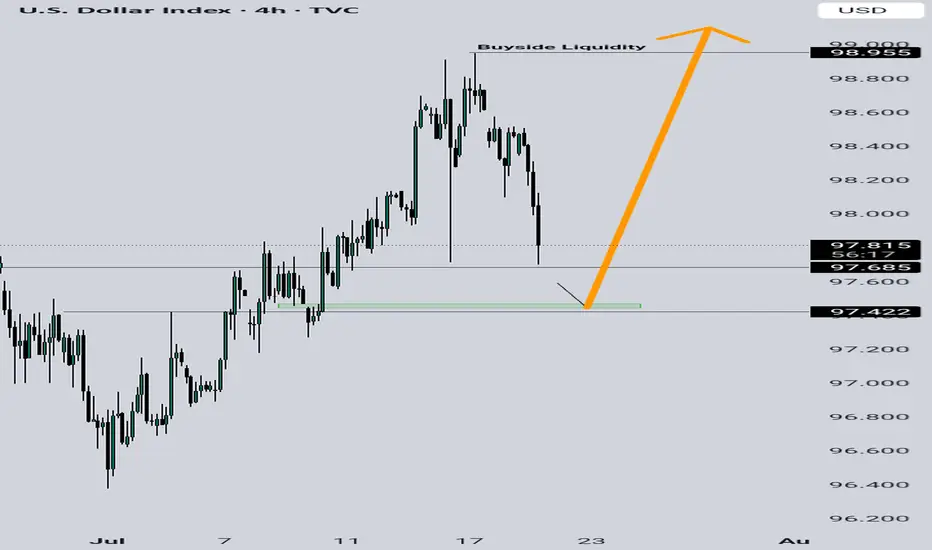
The DXY has run bullish last week, up into an area of Supply, where the momentum hesitates now. Next week may pull back a bit... before continuing higher to the buy side liquidity.
Look out for the short term pullback to the W +FVG for a high probability move higher!
Enjoy!
May profits be upon you.
Leave any questions or comments in the comment section.
I appreciate any feedback from my viewers!
Like and/or subscribe if you want more accurate analysis.
Thank you so much!
Disclaimer:
I do not provide personal investment advice and I am not a qualified licensed investment advisor.
All information found here, including any ideas, opinions, views, predictions, forecasts, commentaries, suggestions, expressed or implied herein, are for informational, entertainment or educational purposes only and should not be construed as personal investment advice. While the information provided is believed to be accurate, it may include errors or inaccuracies.
I will not and cannot be held liable for any actions you take as a result of anything you read here.
Conduct your own due diligence, or consult a licensed financial advisor or broker before making any and all investment decisions. Any investments, trades, speculations, or decisions made on the basis of any information found on this channel, expressed or implied herein, are committed at your own risk, financial or otherwise.

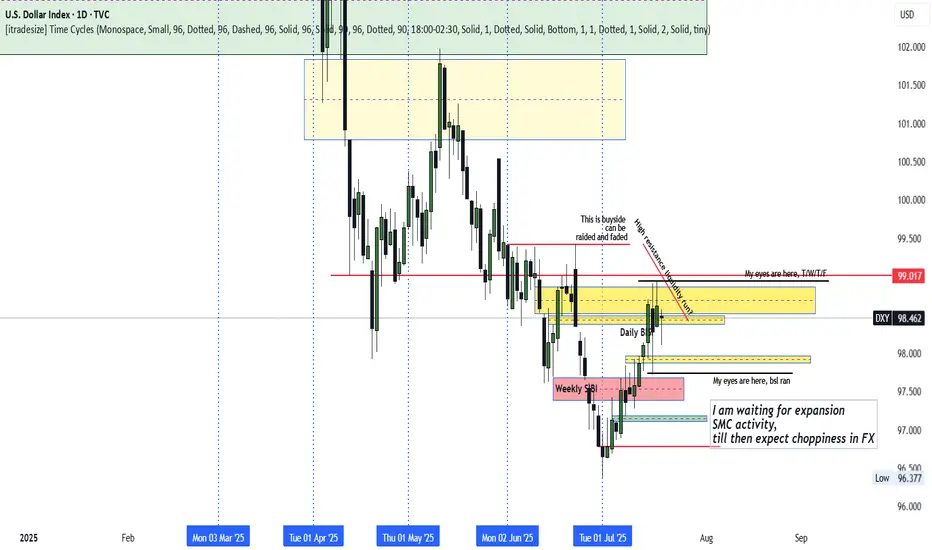
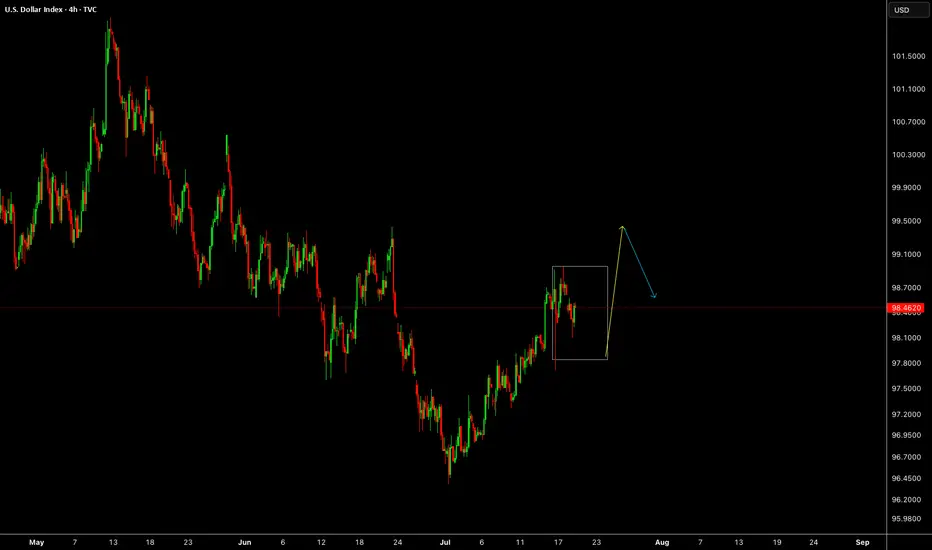
DXY Indecisive
DXY remains locked in its previous week's range, especially locked in Wednesday's range.
The Thursday rally above Wednesday's high appears to be a fake breakout aimed at trapping traders long.
With stops seemingly below Wednesday (Previous Week Low), how we trade past the previous week high or/and low should inform the unfolding direction.
With a run to the previous week's low and high possible, caution is recommended. Await expansion avoid the surge of new's release in the coming week and the choppiness that could unfold.