VIX Hits Key Level as S&P 500 Breaks Out – What’s Next?I keep a close eye on VIX levels that consistently matter — and one of those was just tagged:
📍 VIX levels I watch:
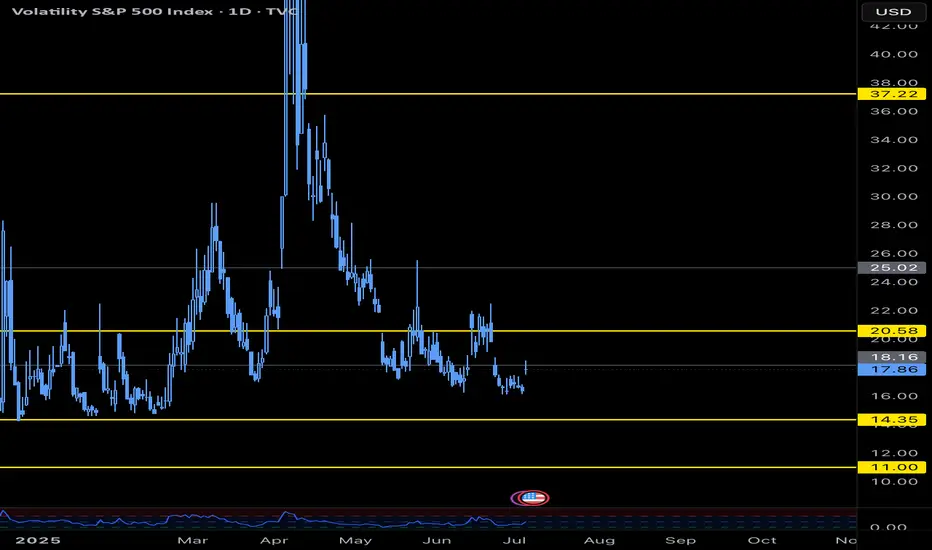
11.00 | 14.35 | 18.16 | 20.58 | 37.22
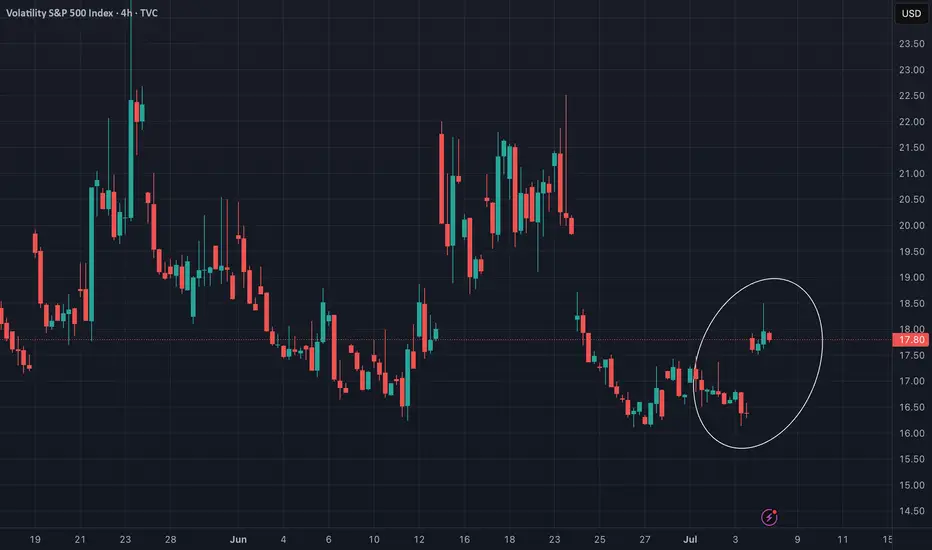
Today, we spiked up to 18.16 and stalled. This is my "in-between" level — not major, but notable — and we’re already seeing volatility slow ri
About Volatility Index
VIX is a trademarked ticker symbol for the CBOE Volatility Index, a popular measure of the implied volatility of S&P 500 index options; the VIX is calculated by the Chicago Board Options Exchange (CBOE). Often referred to as the fear index or the fear gauge, the VIX represents one measure of the market's expectation of stock market volatility over the next 30-day period.
How I Manage Risk (When Buying Options) If you’ve read my previous post — “How Much Risk Are You Really Taking?” — you already know my view on risk:
Treat every trade like watching your cash burn in front of you.
Ask yourself:
💭 “Would I be OK watching this much money disappear right now?”
If your answer is yes, take the trade and move on

Weekly Volatility SnapshotGood Evening -- Happy July 4th to everyone
Let us review last week as we look towards the next in anticipation of the trade deal deadline that looms. I had a target on the SP:SPX of $6,253.59 and the weekly high was $6,284.65. The candle on the short week opened at its low of $6,019.21 and closed

$VIX Volatility Extremes, Narratives, Booms & Busts!TVC:VIX volatility index extremes have always been an important factor when assessing the cyclical nature of financial markets.
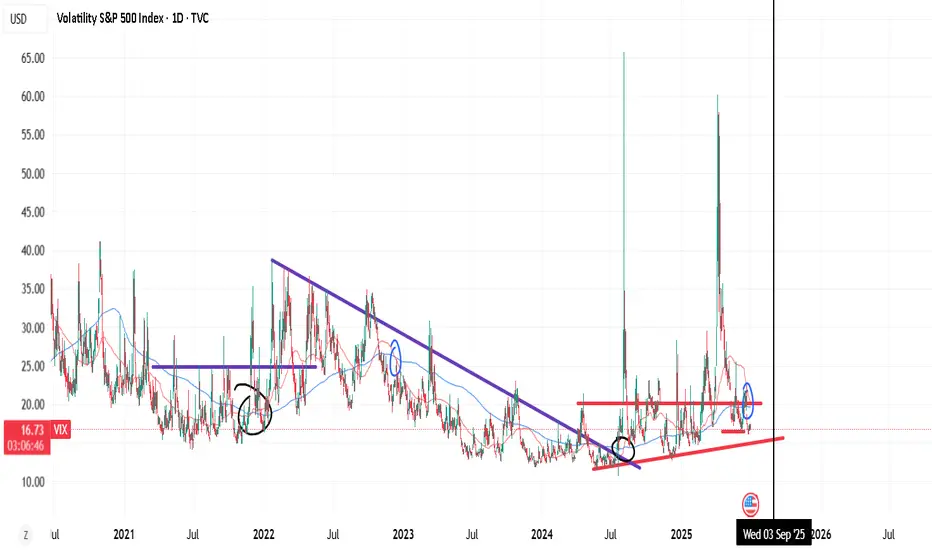
I demonstrate in this chart what values and narratives to look out for at these extremes. This can help ignore the noise when buying during low social mood / fearful even

VIX Breakout: Forex Traders, Buckle Up for Volatility!🚨 VIX Surge: What Currency Traders Need to Know Right Now 🌪️💱
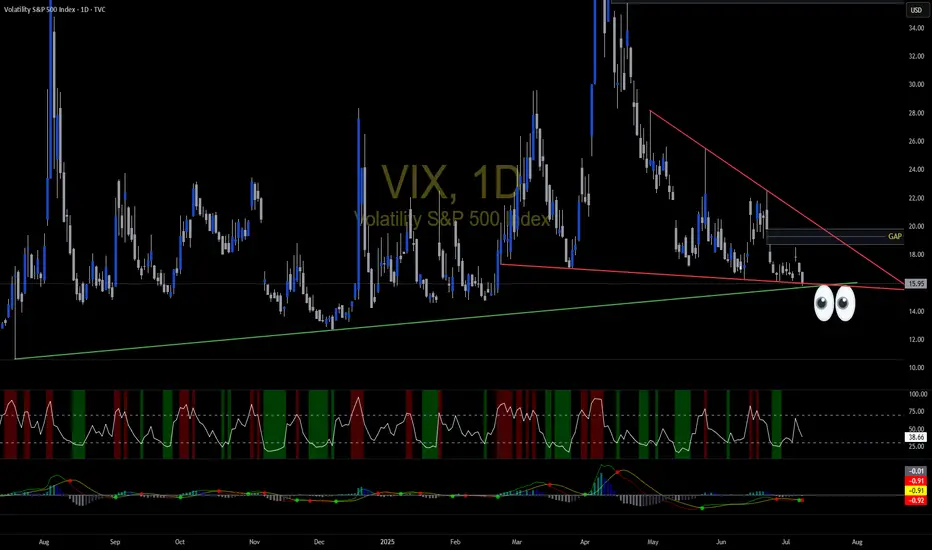
📊 Chart Context & Technicals:
The recent breakout in the VIX signals a major shift in global risk sentiment! 📈 The index has leapt off its base, showing markets are bracing for uncertainty. For forex traders, this is a flashing signal: v
Weekly Volatility Snapshot Good Evening --
I hope everyone is having a restful weekend and enjoying your time away from markets. Always appreciate it while you can, and spend that precious time with loved ones. Now, let us review the price action last week as we look towards our expectations for the coming trading sessio

If we close above last week low, this may prove a good entry This channel is not providing individualized trading or investment advice, nor is it a banking service, brokerage service, trading service, investment service or money management service

Weekly Volatility SnapshotGood Morning -- ☀️☀️☀️
What an amazing last full week of June that was as we pulled out of corrective territory and onto new ATHs with the SP:SPX body of its weekly candle moving +3.41% -- bottom to top. The weekly move open-to-close was +$98.40 as that is how I gauge my volatility metrics. This

VIX break-outs using GC, DC.VIX break-outs using a simplistic, effective approach, probabilities. Market themes or regimes based on markov chains?
keeping it simple.
See all ideas
Displays a symbol's price movements over previous years to identify recurring trends.
Frequently Asked Questions
Volatility Index reached its highest quote on Mar 18, 2020 — 80.210 USD. See more data on the Volatility Index chart.
The lowest ever quote of Volatility Index is 1.000 USD. It was reached on Jun 28, 2013. See more data on the Volatility Index chart.
Volatility Index is just a number that lets you track performance of the instruments comprising the index, so you can't invest in it directly. But you can buy Volatility Index futures or funds or invest in its components.