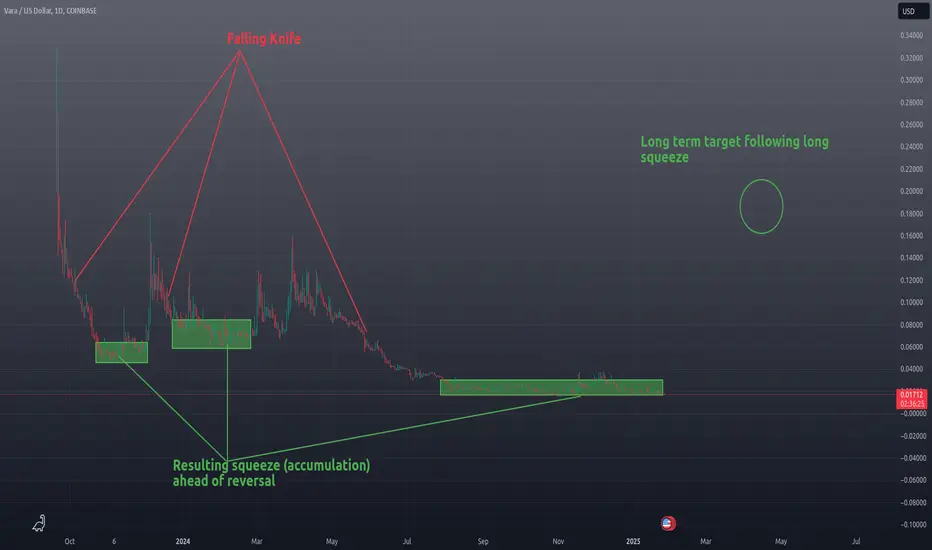
VARAUSD - Long Target - Additional AnalysisFollowing a very long squeeze an asset will tend to break out violently with high demand. This puts a long-term target at around $0.20 easily achievable. Expect a lot of volatility in this tight slowly squeeze, price action is going to become more erratic as investors begin to jump ship and others get onboard, those trades will be mostly a wash as smart money gets in and the fearful lose out. And while of course there are no guarantees what I can tell you is that statistically speaking, large breakouts happen right after these long squeezes. You can see on this very chart short tight squeezes which I have pointed at here that produced fairly strong pumps with massive pullback. There is a lot of money to be made in this coin just from the volatility alone.
VARAUSD trade ideas
VARAUSD - Levels, Bullish Squeeze Entry PointHere are my levels:
Bearish
.022
Bullish
.017
I tried to do a video to go over bookmap levels and demonstrate the squeeze live but I cannot speak well enough right now. I am tired and it still hurts to talk.
I have the 4-hour time frame on my screen which would be unusual for me usually but I want to show you before the breakout occurs, how a squeeze looks. Notice how the B-Bands have tightened very tightly at the far end. This is what it looks like before the price explodes.
In the video I was talking about how buying squeeze is more reliable than buying based upon wicks or 80/20 candles or hammers because in a falling knife pattern these candles can form there over and over, but with a squeeze, a tightening is an actual market event that precedes a price explosion.
You have heard the saying don't catch a falling knife, if you do it is a gamble. With trading everything is a gamble, but you can up your success rate by choosing signs that are more reliable statistically speaking. I have done a lot of my own statistics, some of the statistics others have already written about but with squeezes they are probably my most reliable indicator of a price explosion.
Alright, I am going back to bed, trade safe my friends.

VARAUSD - Bullish Squeeze - Consolidation Phase ChangingVARA has been trapped in this long bullish squeeze for a very long time and although the timing may differ from what is demonstrated on my chart, this asset is no doubt ready to pop at any moment. If you zoom in or out on any level there are constant tight squeezes, one after another that always result from a breakout, the only one that has not broken out yet is the squeeze that is visible on the higher timeframe. There remains substantial support by way of a massive order wall at around $0.018 with no real resistance until $0.025 of about 6.8 million coins, an amount that is really not substantial. I do realize that there has not been very high demand for this coin but make note of the squeeze and substantial support and technical indicators clearly show a bullish reversal is in the books. The consolidation phase has changed to a point where there is high volatility, high volume, and a massive increase in positive delta spiking. While it does not make sense for demand to spike at this time, aside from the recent, barely known listing of this asset on HitBTC, there are buyers. In this regard I remain long on this asset.
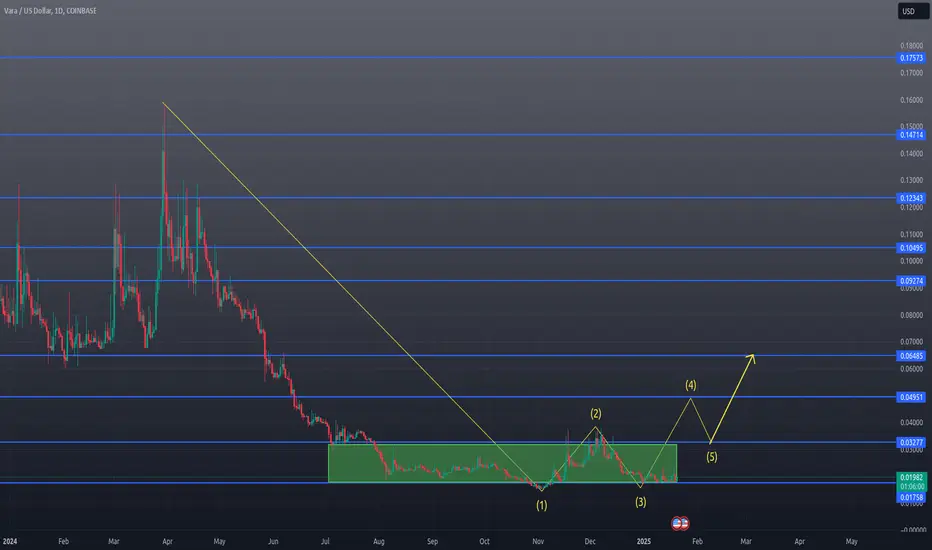
VARAUSD - Bullish Fan PatternThe purple lines are order block levels represented on the micro 4 hour chart; these are subsequently minor resistance and support levels however order flow data from BOOKMAP confirms an order block of over 6.3 million coins exists at $0.025 up to $0.03. So, someone is protecting that level and also $0.02. So, with this being said we VARA is still rangebound as it has been for several months, since at least August when it first came up on my radar.
The yellow line is a bullish fan pattern and represents diagonal support regions. Typically on the micro such as this the gradient is too steep to maintain so the asset will pull back to what is in this case the next area of support $0.02. The asset will likely move sideways for a little while however, I cannot stress this enough...
Trade the range till the range breaks.
In saying that, don't listen to anything other than the chart. If the chart says, as it does, that the asset is range bound then the asset has moved into an accumulation. If you see on the micro as I have demonstrated that the asset has continued to bounce around in the micro range, zoom out to the weekly and turn on the BBands and look for squeezes.
Now for the good news.
VARA is confirmed in a bullish squeeze on the weekly. What we want to happen here is that it stays flat for a long period of time not exiting $0.03 and not exiting the bottom of the range and just bouncing between the general area of these levels for as long as possible eventually tightening into a long period of very flat indecision candle that will show hopefully on the monthly. Once this occurs, breakout to the upside is very, very likely.
I am not a financial advisor, trade safely my friends. Make that money.

VARAUSD - Weekly Bullish Squeeze Continues to TightenThe bullish squeeze on the weekly chart continues to tighten as smaller moves are being achieved. To the untrained eye these small irritating moves will mean time to sell however patience, and experience teaches that the desired outcome is smaller moves, further tightening of the B-Bands. There is always a period of B-Band tightening preceding a large move. One would think that the last move was substantial enough however if you see my chart, it was a drop in the bucket. As it stands today VARA's volume is up 12X compared to the pre-HitBTC listing volume and while BTC experienced a pullback overnight the price is still well bullish even as ugly as the chart patterns are on the micro levels. Remember that squeezes often shake investors out and at the same time create whales.

VARAUSD Bullish SqueezeBuckle in for more volatility.
Vara is entering a consolidation phase on the daily. This consolidation is a bullish squeeze that has not yet confirmed. Expansion resulting in a breakout either up or down, other is fine, both should result in an eminent bullish breakout with target to top of the micro range, use the 1, 2, 3, or 4 hour and order flow data to accurately make order walls.
I am not a financial advisor. Trade safely well friends.

MATICUSD vs VARAUSD - Correlation ReviewAs of today VARA is very close to being perfectly correlated with MATIC finally. It took a lot of bouncing around within the range but after Polygon posted losses and VARA's posted gains it is very close to exactly correlated. This IS bullish by the way for both assets because both assets share one common theme and that is that those very large order blocks have moved up, for VARA to approximately $.018 from $.0158 so a massive gain in support. Not only that but the order wall that was at $0.02 has dissolved. Short term these things don't mean much but long term as whales continue to accumulate coin volatility will be the name of the game. There will be a lot of movement so the only thing I can tell you is trade the range, don't do anything else. Shorting at the bottom of a range is just a bad idea, unless you are just desparate to get out and need the money for food, I would say go long at the bottom, short TP1 at least at one of the resistance areas. If you need help finding resistance lines, please download Bookmap or a similar order flow application, it is the only way you can see order walls. And, while price action doesn't always bounce off of order walls, (sometimes they collapse) most of the time they are of some use. Now, a TP1 is not a massive percentage of your coin, that is an insurance short, insurance because you want to have some of your coins liquidated in case the price pulls back, because as you are aware most of the time there is some pull back, no always but most of the time, that is until it doesn't which is why I said TP1 is not a large share of the coin. You hang on to TP2, 3, 4, 5 , 6, however many TP orders you want just in case the price moons. How many times have you sold a coin only for it to go way up and you FOMO in? Yah, exactly. So, insurance my friends, always use insurance which in this case is your TP levels. Look at it this way, if you TP1, and the price goes up you still have 80-90% of your coin. Cut your losses on that one, but look for TP2. If it still goes up you still have a large amount of coin. I hope this helps.
I am not a financial advisor.

VARAUSD - Orderflow ReviewI present to you order flow data that shows clearly where order walls are present, why price action rejected off of $0.022 (I think I mistakenly said $0.22 in the video, I meant .022..)

VARAUSD Bullish Squeeze Pattern BreakoutAs you can see I have the 15 minute on, simply because when I used to day trade this pattern was fairly reliable. Obviously the shorter the squeeze pattern is the less likely it will break out, because longer squeezes build up more market tension. Now, as a day trader staring at a 5, 10, or 15 minute chart this one I am looking at on VARA is no doubt a buy signal and just wait for it to pop. Just remember, 20% of the time it will go down instead, so obviously set your stop losses. Now I'm not day trading anymore but most of the time if I see one I will go long. This is because from my experience most of the time these breakout to the upside, it will go up especially if we are at the very bottom of a range up against a huge order wall.

VARAUSD Bullish Squeeze - Bullish BreakoutHere is TP1 target for anyone who happened to take a long entry following my last post. TP2 should not be calculated until we see some kind of reaction, hopefully support will confirm above $0.02, if it doesn't I would not waste time taking profit because of the likleihood of further continuation.

VARAUSD Bullish SqueezeThis is a bullish squeeze pattern, bullish because it is at the bottom of a range. Breakout statistics is 80% to the upside. I always eyeball charts for assets I decide to trade for these little beautiful squeeze patterns, the longer the better. The B Bands will predict a squeeze pretty well by all of the lines squeezing together indicating real indecisive trade activity.

VARAUSD - Bullish Outlook This chart is not pretty and to the untrained eye looks scary. The thing to remember is that the Channel, even after BTC dumped quite a lot, is still not broken. Actually, not even BTC's channel is broken but more about that later.
These knee jerk reactions are all thanks to our friends at the Federal Reserve bank who like to pretend that the US Dollar is more valuable than it really is. While there is a lot of value left in the dollar it will diminish a little at least in the coming months (See my post earlier today regarding DXYUSD).
Why am I still bullish? Simply put we are near the bottom of a range and a lot of liquidity is available here, a very suspiciously large amount. What I know about order walls is they are meant to be filled. Even those large exchange walls are meant to be filled eventually since that is how exchange's buy coins that they lend out for leverage to enterprise members. While they do receive a lot of free tokens from projects the exchanges have to buy coins for a lot of their reward programs which makes the sell of these coins a wash i.e. break even since they take them out of the market, give them away and then they are sold.
I can tell you right now that there are no short traders placing bets at this price point and it wouldn't take very many to crash this market some. The reason why there are not short traders taking this trade is simply put that very order wall I just mentioned above. It is suspiciously large and wide and it speaks to future plans of this coin to take off and may even break all time highs at some point. At this time I remain long and patiently await the next move to the upside.

VARAUSD - Some additional notes and diagrams of my strategyWhen VARA was initially listed it pumped way beyond anything near its actual intrinsic value at the time. I do think that VARA could move well above a dollar given enough time but its current value is well below where it should be. See my chart showing initial speculation by investors and I explain how and why VARA is stuck within this range and why a breakout to the upside is more likely than an additional dump.

VARAUSD vs MATICUSD With BookMap Order Flow TutorialThis video briefly covers how to use bookmap at a really basic level and I also go over VARA vs MATIC correlation as well as the progress of our 80/20 candle.

VARAUSD - Bullish ReversalVARA is currently still quite behind in correlation so I believe a lot of catch up is going to occur within the next 24 hours. The weekly 80/20 candlestick that I've been eyeballing and expecting to turn green has flashed green multiple times as the red indecision hammer begins to signal a bullish Thor's hammer in which case would signal not only a bullish reversl but a substantial movement upward of the order wall below. This would mean, if backed by orderflow data within BookMap's heatmap that a drop below the current floor of this channel becomes very unlikely. Anytime price action taps a large order wall at the bottom of a channel something to watch for is absorption and breakage of the order wall. Some assets that tend to be bearish over a long period of time such as in the case of VARA whales who already own a massive bank of coin will buy the coin at discount prices creating a floor. This is not coordinated although in watching the market in these circumstances it feels as though the market is an Artificial Intelligence as similar minds think alike creating a group who is bullish at the bottom while also giving liquidity to the fearful or less experienced traders who focus way too much on assumptions, such as the assumption that unlocked coins would crash a coin further, even though there is no evidence of this and in fact the dump, if there was one, is actually over and happened upon initial listing of this coin on Coinbase. This is a similar story I have seen such as when I first bought SHIB when it was listed on Coinbase. Most coins that are listed now will crash because investors no longer see listings as bullish so don't believe for one second listing this coin on any number of platforms will be bullish, it is not necisarily true.
Trade the range until the range breaks...
When the range breaks, trade the new range...
Fud at the bottom is bullish...
Fud at the top is bearish...
This asset is bullish...
No news is good news for a new asset...
Unlocked funds will in large be staked...
This range is a whale accumulation range...
I am not a financial advisor, trade safely my friends...

VARAUSD - Remains Bullish - Range BoundThis hammer candle that has been in the process of forming over the past week should turn green. VARA is way behind it's correlated assets and from my experience, statistically speaking, assets catch up with one another in some way shape or form. The timing is never perfect thanks to the very low market cap VARA has but we are still somewhere around 20% behind the market correlation average in some cases and as low as 10% when compared to direct correlates.
Trade the range until the range breaks...
When the range breaks, trade the new range...
Fud at the bottom is bullish...
Fud at the top is bearish...
This asset is bullish...
No news is good news for a new assett...
Unlocked funds will in large be staked...
This range is a whale accumulation range...

VARAUSD - A Glance at The MonthlyAnother Troll So Another Update...
Looking at the Monthly, this asset remains VERY bullish and has obviously bottomed out. These are the order blocks that currently entrap price action within this range that we are trading.
I ignore all FUD and execute my trade strategy till death...
Trade the range until the range breaks...
If the range breaks, trade the new range...
If the range is unbroken, set targets accordingly...
Unless my stop loss has been hit, never short near the bottom...
Never long near the top unless my stop loss is hit on a short.
When there is FUD near the bottom, invest more into that asset.
FUD near the bottom is a buy signal, oddly.
FUD near the top is a short signal, very odd.
People are more likely to sell a top with FUD than they are to short the bottom (GREED RULES THE MARKET)
Outside of this strategy, for me there is nothing else to discuss. The range is not broken so the trade is active.

VARAUSD - Hunting for Order Blocks (Order Walls)I've circled (or boxed in rather) the chart patterns which along with order flow data confirm the presence of large order walls. Yes, it is true that I could rely only on order flow data from BookMap to tell me where these are at because the heatmap clearly shows them. But BookMap takes a long time to download data and you have to let it run for a long time before it will catch up with the market so what if I want to draw my strategy right now? Statistics my friends. Study and compare enough and you will be able to pinpoint order walls with good enough accuracy. I know, a lot of traders draw lines all over the place but those lines do not mean anything today if they are way up there or way down below. Price movement could go up or down really fast absorbing those regions with ease, thus I like to stick with the range that the asset is currently in. To me the only thing that matters about what is happening with this asset is what has happened within this range. I trade the range until the range breaks, if the range holds then we trade, if it breaks, we get a new range, higher, lower, whatever time frame, weekly, daily. It is all the same strategy to me. Sentiment doesn't matter and it won't matter in the long run. Look at MAKER, that asset is still trading for $1500 roughly. Why? Is it worth that or is it being propped up? I mean who knows, sentiment can mean something but all I am saying is MAKER isn't even called MAKER anymore, its some weird SKY coin with some end game project the creator has lost his mind. VARA is a young coin with promise and a fresh new approach to programming D Apps. Is it popular today? Will it be listed on other exhanges or is that in the works? See sentiment is BS because we don't have all of the answers and we don't have control but what we do have is a range to trade. So, with that being said, I don't care about unlocks and I don't want to hear another word about it.

VARAUSD - Cup and Handle Pattern ConfirmedEven though I typically disregard lower time frame patterns this cup and handle pattern that just formed and confirmed is so pretty I thought I would share it with everyone.

VARAUSD - Lets Talk About the Elusive 80/20 CandleI love the 80/20 candle...
I have a version of the fib retracement tool on my chart. In this case I am measuring the weekly candle VARA is in right now from top to bottom.
As you can see the wick of the candle is almost 80% of the entire candle and the stick is almost 20% of the candle. This bullish signal doesn't have to be perfect but when I am hunting for wicks on the weekly chart, this my friends is the candle I want the most and the longer that wick is the prettier the reversal can be.
I am not a financial advisor. Stay save my friends.

VARAUSD - Price PredictionNew rule. Every time a troll says something to me I will post an update reiterating my strategy.
As I have been saying for the past few months VARA like most assets is rangebound. Alt season, if there is such of a thing hasn't even entered its beginning stages with Bitcoin still dominating market trades. I may have also mentioned this accumulation zone which VARA is still sitting comfortably inside of is in fact also the range VARA is in. Price action will bounce around within this range rejecting off of some levels and breaking through others, ultimately breaking out above the $0.04 order block. This is because that order block consists mostly of whale traders who have absolutely no interest in allowing the price to go up until they are through accumulating. Traders who recognize these patterns can take advantage of the moment. It is true that the price could spike down further, and this would simply feed bargain traders who seek to buy in as close to a penny as possible. If you want to try and time the market more power to you but my approach is the same. Trade the range, average in, and most importantly don't long the top of the range and unless my stop loss is hit don't short the bottom of the range. I am surprised to see how many short contracts that opened up yesterday. I blamed this on year-end loss accumulation for tax purposes. I know a lot of people think I am insane disregarding all FUD regarding unlocks and emissions. My opinion on this is only about 30% of the token supply is locked right now and I believe much of that will become staked holdings. Staking numbers for the VARA network are quite low right now which I think will be resolved once the unlocks occur. Fearful traders believe that every investor or developer who receives their coins is just going to sell at this bottom price. This never happens and instead the opposite often happens. So don't feed into the FUD too deeply, it isn't that serious. VARA is a long-term investment in my opinion and similar to MATIC and any other layer one stakeable coin the rate of return is quite a bit more important than a small market pull back. Regardless, at this point we may have a few months at least before price action is able to absorb the upper order wall but don't forget once it is absorbed it will be quickly flipped to support. Yes, I know it hasn't happened yet but this is how the game is played, trade the range until the range breaks, if the range hasn't broken there is nothing to cry about. We are long at the bottom and short at the top but just be warned that the top of this range is a very low price tag. If you want 30% profit, go ahead but that is not going to be life changing money is it.
I am not a financial advisor. Stay safe my friends.

VARAUSD - Bullish Triangle Pattern ConfirmedWith newly formed bullish order blocks and yet another very odd change in market structure this afternoon, Immediate breakout is likely.

MATICUSD vs VARAUSD Correlation MapVARA dumped for literally no reason other than traders are taking losses and FUD. The upcoming correction estimate puts target price of rebound at roughly $0.024 right now, this could increase substantially if MATIC pumps, which honestly may happen overnight considering traders that took losses on VARA are not permitted to reinvest in VARA thus they will no doubt choose correlated assets and there are just so many to choose from with POLYGON being somewhere at the top of the list.
I am not a financial advisor. Trade the range. Ignore the FUD. Stay safe my friends.
