VET/BTC (Back at Previous Support)VET/BTC
-Vechain may have temporarily found support at previous trading zone
-the 50MA also coincides with this region
-VET must keep this level for the next 24 hours
-if it does, we may see a potential upside to test the resistance line
VETBTC trade ideas

Vechain fib analysisThis is not financial advice. Please make your own analysis and research before investing. Just my ideas.

VECHAIN Harmonic- Late but beautifulFrom a Massive Bearish Shark- to a Crab Harmonic ......VECHAIN paid off well!


VET/BTC daily outlook 7/5/2020Good evening everyone and welcome back to my analysis of Alt coins. Im trying something new and today Im looking at the VET/BTC pairing. I pulled this chart up this evening and thought I would throw a fib onto it and start my normal analysis. But I already drew a fib on this chart and I guess it saved all this time. The fib is still very active and the candles are still respecting it even though you could probably draw a more current Fib. But for now this will do.
We have seen a lot of upward momentum from VET as of late. From 37 sats back on March 13th. All the way up to 159 sats where we sit now. If you simply bought at 37 sats you would be up 4x at this point. I dont really mess with alts much lately but I may have to start back up and spend more time trading. Im missing out on some good pumps. The thing is I see a lot of pressure at this price. The wicks are high above us showing the pump wants to continue but the selling pressure is just to high at this level at this time.
Now after a few more days we may see some more fireworks if this is a continuation pattern but as most things are on the chart this is all subjective and we will just have to see the way the market goes. A continuation pattern would be a pennant forming here after the big pump which would be the pole. Very bullish formation. But I have seen strange things in crypto trading called bart simpson patterns and that could also sneak up on us. You should be prepared for anything with alts. The dumps can show up fast.
Im not saying its all over for VET. I havent been watching the charts on VET so I am still cautious to take a position until I study it further. For now the pump is seemingly stalled so I will probably decline on jumping in at the moment. Maybe find a place for reentry and set a buy there. But I make good profit off my BTC trading so I am in no rush to jump into things. I just need to make sure I have the time to devote to trading like that. Its a full time job at some point. Not that I wouldnt mind making it a full time job but at the moment I have a regular 9-5 and I just dont have time to trade like I want anyways.
VET/BTC is very bullish at the moment but the pump may be over. The golden cross is in full swing but I would be cautious on entering here. People are taking profit at this level and It will take some real volume to build that confidence to push above 160 sats. If I were to enter a position here I would set a stop loss fast. I always do but this is a case where chasing a pump may not end in glory. But WTFDIK right? I hope you like the alt analysis. I will try to do more. I am taking requests and if you have one leave it in the comments. Have a good night folks.


Here I go long on VeChain and VET will go upHere I go long on VeChain
and VeChain will go up.
The price is testing the major resistance so now I borrow some Bitcoins
and the bullish breakout will start
and VeChain will go up.
See you up there


VeChain VETBTC Long, Bullish, Inverse H&S, Ichimocku and moreI had fun with this one, the more I looked the more there was to find. This really does look very bullish…
Main points:
*Break of median line in a long term downward trending channel
*Break of neckline of massive inverted head and shoulders Pattern
*Breakout of 3D Ichimocku cloud
*Bullish weekly 3 white soldiers pattern forming
The chart above shows a break of the long term downward trending Channel Median line:
Targets: 150- 160sat in confluence with the 3rd wave (Orange) shown in the road map below and the 0.5 Fibonacci retrace level of the last major move down from 272sat to 34sat shown above.
Road Map:
Wave 1: 110sat
Wave 2: 37sat
Wave 3: 160- 180sat
Wave 4: 113- 126sat
Wave 5: 189- 203sat
Elliott wave count suggests that we are in the 3rd wave ( shown below in Purple) of the 1st wave (White) of the 3rd wave(Orange). The target for the high probability zone of the 3rd wave (Orange) is 160 sat but the count on the 4h time frame (Purple) shows it could overshoot this target. A retrace to the high probability zone for the 4th wave (Orange) would put the price at 113sat, close to retesting the prior resistance at 110sat. Note this count is invalid if wave 4 breaks the high of wave 1 at 110sat. The final projection for the 5th wave at a 1:1 projection from the first wave is 189-203sat. The 5th wave target is also in confluence with the golden zone (.0618- 0.65 Fibonacci) of the last major move down. You couldn't make this stuff up if you tried!
Short term shows heavy resistance at 88 89 & 91sat due to the 0.707 Fibonacci level from previous high and the projection for the 3rd wave (Purple); 1.618 - 1.75 Fibonacci level taken from the proposed wave 1 and projected from the low of wave 2. If this is a 3rd wave we can expect a retrace to the 0.382 level, and retest of the VPVR high volume node at 69- 71sat before a continuation. This would also be a retest the median line of the channel shown in the 3D macro chart.
4h (Purple) Roadmap:
Wave 1: 64sat
Wave 2: 44sat
Wave 3: 88sat
Wave 4: 71sat
Wave 5: 98sat
Support, resistance and VPVR high volume node:
A break above 92sat will clear the algos out as the price enters a low volume area, this should allow for the price to test the 110sat area (former support and resistance of previous high).
Head and shoulders:
There has been a break of the neckline of a massive head and shoulders pattern formed over 20 months. The projected target for this breakout is 160sat, in confluence with the 3rd wave (Orange) on the macro.
Bullish 3 White soldiers pattern forming on the Weekly:
Ichimocku Weekly
Resistance in confluence with Wave 1 (white) projection:
weekly
Ichimocku 3D
Confluence with wave 4 (Purple) retrace:
Never Trust. Verify.
DYOR . Not Financial Advice Just an Observation.
Always remember: Technical Analysis is not about being right, it's about increasing your odds.
Be prepared to be wrong. Risk management is key . Capital preservation above all else.

VeChain Bullish Long 160sat TargetBullish Break of long term downward trending channel's median line and break of neckline in 20 month Inverse H&S Pattern.
Target: 160sat
Never Trust. Verify.
DYOR . Not Financial Advice Just an Observation.
Always remember: Technical Analysis is not about being right, it's about increasing your odds.
Be prepared to be wrong. Risk management is key . Capital preservation above all else.

VET / BTC Trade Idea and Thoughts Over The Price ActionVeChain (VET) has now broken out of the symmetrical triandgle and now growing for more targets up above. The price action is moving above the major moving averages which is a very bullish sign and 21 MA is acting as a strong support indeed.

VET Resistance 153- 160 sat, H&S Target, Edge of Channel, Short Target for inverse H&S almost reached. Approaching edge of channel in confluence with the 0.5 FIB & the 3rd wave 1.618 projection (see linked ideas below)
Never Trust. Verify.
DYOR. Not Financial Advice Just an Observation.
Always remember: Technical Analysis is not about being right, it's about increasing your odds.
Be prepared to be wrong. Risk management is key. Capital preservation above all else.


VET/BTC (Approaching Weekly Major Resistance)VET/BTC
-the weekly candle is looking bullish
-if you are a Short trader
-I'm pretty sure you are waiting in this area
-if a reversal is confirmed
-entering a low leverage Short is ideal
-you will try to capture the large swing down
-it will take some time before it gets here
-so be sure to add it in your watch list


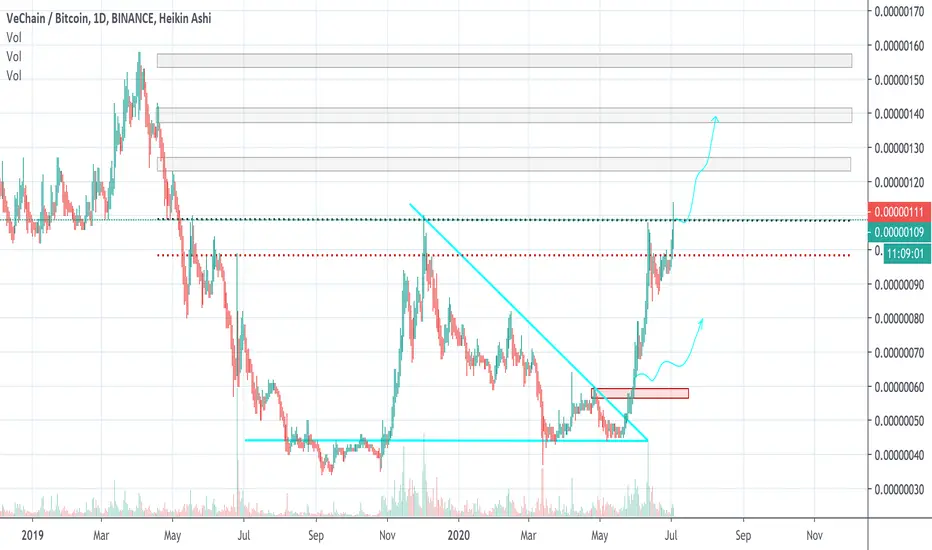
VET/BTC *UPDATE*After a recent break out of a long downtrend - VET has taken quite the run.
Originally posted May 26th - VET is already up over 100%
We are facing some resistance here but today saw a big break of that resistance, VET may take another powerful run, I see three targets to keep in mind - as shown on the chart.

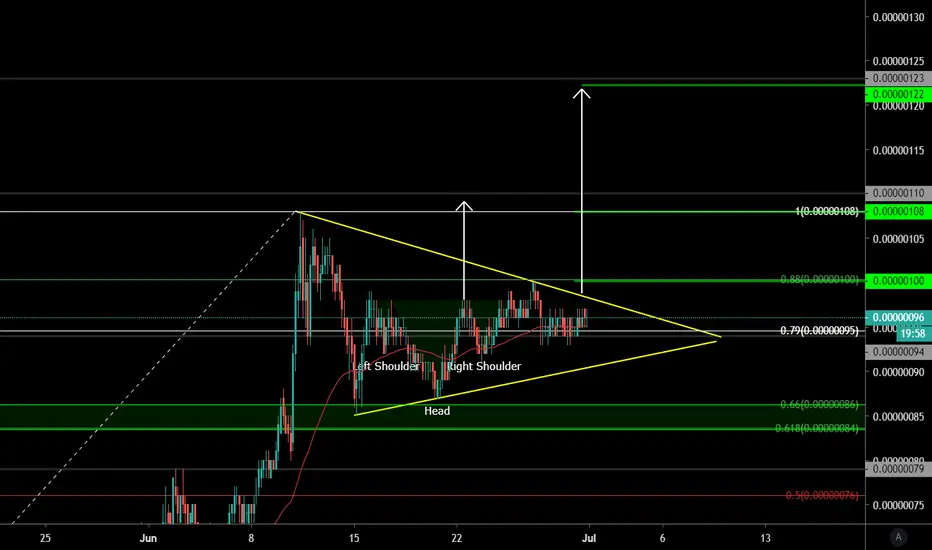
#VET scalp long againsupport held on 4 hr & triangle broken on the upside, scalping a small long based on Triangle target for approx 20%
possible also that Bull-pennant has broken if that's the case possible targets are approx 50% from here


vet double top classic weekly charthere's my take:
vet has made a double top on the weekly chart and ichimoku cloud has also turned green. there is a possiblity to bounce between 0.00000079 and 0.00000088 as this is a critical level for support. if 79 holds well then vet will have smooth way up to 158 against btc.
for the short term, the 4 hour chart seems to be bouncing between 94 and 99 which indicates 94 as buying power and 99 sellers. bollinger bands show upper and lower limit as 94 and 99. i sense 94 will break soon and bounce back at 79. fingers crossed.
