VETBTC BINANCE 1DSignalyze AI Alert
#Binance 2019-11-20
#stoch_rsi3d ** Possible MOON Alert - Check Chart **
#VET/BTC
Indicator : {'stoch_rsi': '81.84'}
Chart VETBTC BINANCE 1D BB RSI MACD
Prices:
Advised Buy Levels
BUY: 0.00000076
SL: 0.00000058
TP: 0.00000101 0.00000124
Who are we?
Signalyze Market Metrics.
Signalyze.co.uk is your swiss army knife of trading tools which takes market data, trend data from social media and utilizes advanced algorithmic A.I to initiate trades to your advantage as well as you receiving advanced analysis on signals and information around cryptocurrency and prices that will help you make the best decision when trading at the most important times.
With custom in-browser alerts and advanced telegram alert system you will have access to custom alerts to ensure you never miss a market movement.
Join us today!
—Links—
Website : signalyze.co.uk
Discord : discord.gg
Telegram : t.me
Twitter : twitter.com
VETBTC trade ideas

VETBTC - DAILY CHARTHi, today we are going to talk about VETBTC and its current landscape.
ENTRY - Exclusive to Traders Heaven members
TARGET - Exclusive to Traders Heaven members
STOP - Exclusive to Traders Heaven members
Thank you for reading and leave your comments if you like.
To have access to our exclusive contents, and see more of our work join the Traders Heaven today! Link Below.
Disclaimer: All content of Golden Dragon has only educational and informational purposes, and never should be used or take it as financial advice.

VET/BTC at the support now vet/btc support at : 76-78sts and 60-62sts you can long vet here for taget 123sts

$VET - Heed The Warning? The Correction Is HereLooks like it is uppon us. Huge RSI Divergence, I got out at 88% profit and I was early to that but profit is profit. This looks set to go down. Revised targets will be up in a day or so.
But honestly. Looking to invest? Wait.
Looking to take profit? Start thinking that now.


$VET - I Hope YOU ARE Ready For The Pull BackThe big pump, caught 88% of this which was awesome, but like anything. What goes up. Must also come back down.
Got profits? Bag them.

VET/BTC cup & handle pattern break out ?!The cup does look ugly but if this shows a cup & handle pattern , this can get very interesting ;)

VET/BTC ..here we go again?!VET/BTC bounced perfectly of the 20 EMA on the 4 hour chart like it did before in this run. It looks like VET is preparing to lift up again.
*no financial advise :)

VET´s travel trough novemverThis is VETS prediction for November - Descember.200 sats in reach.
Some turbulens on the 100sats. 160 and 200 says area.

VET/BTC - target perspectiveHello guys, thanks for reading this analysis!
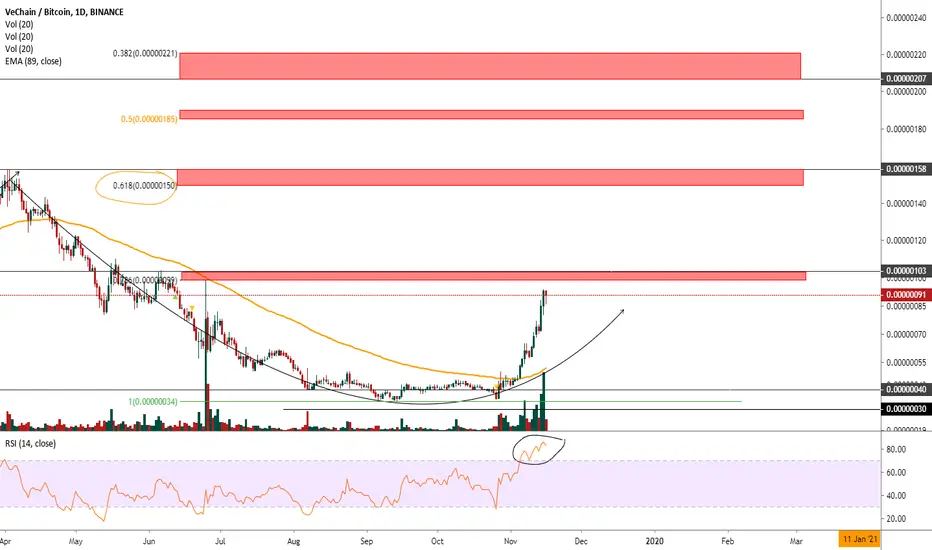
VET/BTC is a beautiful chart currently. We broke out with heavy volume and ripped all the way up right below the 0.786 Fibonacci
Yet it seems we are consolidating for the next test to the upside. Why?
1. The RSI (14) is completely overbought, yet it seems like it won't cooling off, it looks more like the opposite at the moment.
2. We have support from the 89 MA which is a good indicator for changing trade directions.
3. The Volume is amazing: High green volume candles and low red volume candles. This means that many people are interested to buy at the moment, but not many people that want to sell for now.
IF we can get above the 0.786 Fib (99 Sats) we can see this as our confirmation to test the 0.618 Fib (150 Sats) which is the most important one, because we failed the last rally there so this means it has the most confluence in it.
Once we broke the 0.618 and consolidate above we can say the bear market is over!
Take this chart as your help to find entries and exits. All Fibonacci's will play an important role and you should take my red boxes as places to sell or to re-enter.
Be safe, be happy, be healthy,
Kami
VETBTC Consolidation aheadPattern: Parabolic bullish leg on 1D.
Signal: Neutral within the consolidation zone. Bullish if the support is held.
Target: 0.00000150 (below the 1W Resistance).

MOON TARGET 840 sats. 2.618 fibMy guess :) Vet havent had its bullrun yet. Take alok at XRP. ETH, MATIC. They had some crazy runs:) Buy and hold.

VET/BTCKeep it simple!
Looking at VET on the daily, there has been an unbelievable pump from the buy range (green box), making many of you over 175% profit! Hitting all three profit targets (Orange boxes).
From here I would like to see a pull back to the 63 Sat's range, and find a solid support, before the next rally. If VET does continue the rise, I have set two higher profit targets at the 193 and 235 range, as these are the next heavy resistance levels. Rejecting these levels would be likely, so take lots of profit.
So on the short term i'm bearish as I would like to see VET to retrace to a support level, forming a higher low, and long term see a nice continue of the rally.

VET/BTCVechain is onme of the most undervalued chinese cryptos at the moment It has huge fundamentals and countless partnerchips with the biggest chinese companies.

VET/BTC - Vechain $VET is on the way to the moonIf VET can keep up the momentum against BTC, it will go much higher. Vechain has huge and countless partnerchips with the biggest companies in china. It is toatally unervalued.

VET- another ascending trianle.VETBTC appears to be forming an ascending triangle on 4hr chart. The chart is making lower highs. Resistance at 94 will eventually be broken. Support of the triangle is at 85 sats. RSI is an upward trend on 4-hr showing bullish divergence. Lower highs are a good buying opportunity with tight stop loss. Expecting a test of 100 sats soon.

#VET: 40% Profit Potential in short term!!!VeChain (#VET) is an up and coming blockchain platform aimed at serving the logistics sector and the Internet of Things (IoT). The new blockchain was launched in July 2018, offering a swap of the older VEN token for the VET digital asset. VeChain is a dual-asset platform, with an elaborate system of staking nodes paying out rewards in VeThor (VTHO).
In a short to midterm, VET is currently on reversal trend which already started to go up. Currently on short term pullback. It has major support at 86.
Critical areas to watch if buying pressure is strong at 88, 89, 90.
Short term Target at 123.

VETBTCVETBTC update
Entonnoir : W/D/H4 (swing)
Ca fait toujours plaisir quand une AT postée en août se réalise.
Nous sommes donc en tendance haussière weekly qui nous place sur un biais haussier. Le daily est en uptrend mais la tendance est extrêmement vieille avec déjà 4 impulsions (découpage jaune). De plus, on approche du niveau psychologique des ~100 et de la grosse zone de S/R des ~110.
Au vu de cette situation critique, je préconise de ne rien faire avant la prochaine sortie de compression daily.
—————
Funnel : W/D/H4 (swing)
Shout out to my TA from August, it feels good.
We are on a bullish bias because of this uptrend on weekly. The daily uptrend is already old with 4 impulsion waves (yellow drawing). Moreover, the price is getting close to the psychological level at ~100 and the zone of S/R at ~110.
Seeing this tricky zone, I would not recommend to do anything before the next daily compression breakout.


VET BULLISH$VET
PA looks bullish to me, 50 is the level where where I'd shave off most of my position, if it breaks north I think the 57 level would be the next resistance to focus on.

About Vet.The best news of your day is called $VET.
- Volume has grown absurdly in recent days
- MacD crossing up
- Breaking downtrend that lasted over a year
Just warning.

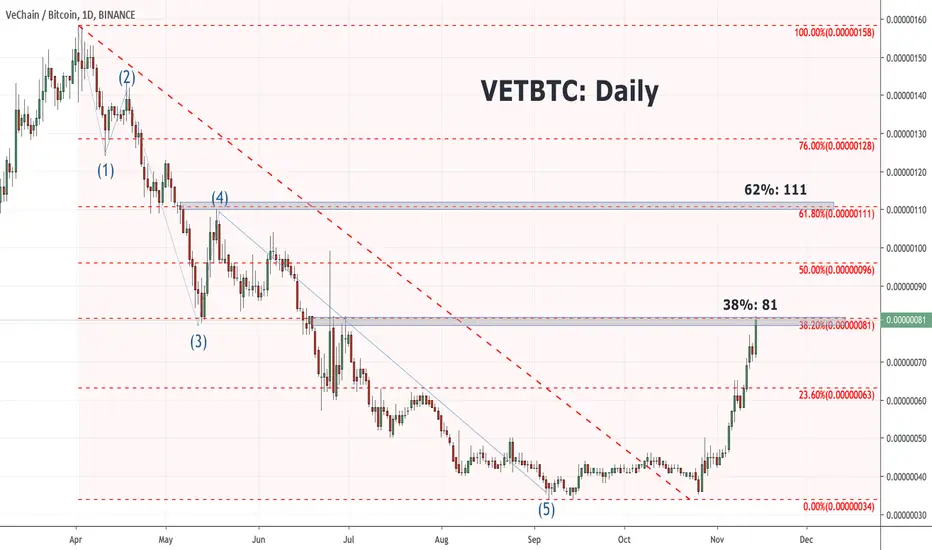
VeChain (VET): Really Interesting ChartLooking at VeChain, technical developments are exciting. First, we see that VeChain (VET) is right up against horizontal resistance that the 38% retracement of its recent move down. That level should create a pause and allow for profit-taking.
In the event VeChain blows through the 38% level near 81, the next upside target could be 111. The 111 level is the possible location for a "previous 4th." A previous 4th is Elliot Wave jargon for the point where the final significant decline began. It is typical for bear markets to correct by rallying to this level and even beyond it.
Bottom Line : VeChain (VET) is up a lot in percentage terms. If VeChain (VET) continues to rally from here, it could sign of both a fundamental turn around in this coin and possibly the start of a full-on alt season.
Huge PotentialA breakout from a falling wedge coupled with big news and rumors coming out of China can only mean a huge ROI potential!
This is an amazing project with huge potential - Do not miss the boat!
