Vechain Buy Signal Part 2Vechain is back in the buy zone following BTC as it took a little dip.
This is just a continuation of the original buy signal chart zoomed out.
VETUSD trade ideas


BTC & VET - up or down, that is the question...Yo guys, welcome to the channel Hawkeye Charting.
Market Makers are doing a great job, by principle there are confluences for both directions.
We have to be patient and must wait for the hand of the market makers to appear.
Watch the video to understand, which zones I'm paying attention to.
Todays altcoin: VET
Enjoy watching the video :)
No BS like bullflags. No Asking: when moon?
Always referring to the current state of psychology and what the market maker aims to do next.
Pointing out the major trend on Elliott Waves.
Peace
Disclaimer:
No financial advice!
All content is for information and entertainment purposes only and only reflects our personal opinions or market steps. Viewers are expressly requested to form their own opinion on the content and the statements as well as, if necessary, to seek professional advice.

Belt and road initiative? Blockchains? Intel super factories?these are some of the biggest bets you can make this century. Do not miss this prices, this correlation is of no coincidence.

Vechain Daily uptrend will begin appearing now aiming 300% as soon as possible.
under the M.A RSI SYS vision, the price must explode any time
Enjoy 💪💪💪

VET/USDVeChain update:
As with most cryptos, downwards pressure is still dominant.
VET is still in a Descending Channel, VET broke above the Descending Channel on the 3rd of March but quickly came back down and closed back inside the Descending Channel so the Descending Channel is still valid.
VET is still below its Bollinger Bands Middle Band Basis 20 Period SMA on this 1d timeframe. Note that we have expansion of the Lower Bollinger Band and this expansion is for negative momentum.
VET is getting very close to its Least squares Moving Average (LSMA) indicator, a close below the LSMA will be considered a sell signal on this 1 day timeframe for this indicator.
VET is still below its Volume Profile Visible Range Point of Control (VPVR POC) for this charts Visible Range.
VET is still below its Volume Profile Fixed Range Point of Control (VPFR POC) for the Fixed Range of 11x daily candles that i have selected.
I have added various Support and Resistance areas s highlighted by the Horizontal Blue Line with Yellow Shading.
Looking at the Moving Average Convergence Divergence (MACD), we can see that the MACD Line (Blue Line) is sideways at the moment and still under the 0.0 Base Line in the Negative Zone. If the MACD Line (Blue Line) crosses back under the Signal Line (Orange Line) then that will be considered a sell signal for this indicator on this 1 day timeframe. Not that the last 3 Green Histograms have lightened and lessoned in size indication a weakening of positive momentum. Note that the MACD Line (Blue Line) has not been in the Positive Zone above the 0.0 Base Line since the 21st Nov 2021 on this 1 day timeframe.
Looking at the Stochastic Indicator (STOCH) we can see that momentum is downwards at the moment and note that the %K Line (Bluer Line) is still below its %D Line (Orange Line) on this 1 day timeframe. Important to note that the %K (Blue Line) still has plenty of room to drop much more before becoming Oversold on this 1 day timeframe.
Looking at the Average Directional Index (ADX DI) we can see that the trend strength is very weak with the ADX (Orange Line) under its 20 Threshold at 19.23 and still under its 9 Period EMA (Black line) which is at 21.60. Note that Positive Momentum has dropped its the +DI (Green Line) dropping to 19.26. Negative Momentum is still dominant but has dropped to 23.63.
Here is a wider look at this VET/USD 1 day chart so you can see the previous VPVR POC area:
I still think that BTC will hit $24k this year, if that is the case & if downwards pressure continues and VET breaks below its $0.0389 support then i think we will see VET hit around $0.0293 - $0.0282 as that area is VET’s previous very strong VPVR POC area.
At the moment, the Market Makers have decided that the path of least resistance to profit is still downwards, this goes for most stocks, Indices and Cryptos. As we know BTC is following the downwards momentum of the stock market and all alts are following BTC.
I closed all my crypto trades back in Dec 2021, luckily still in profit. I have only had 1 crypto trade on since which i closed at a 10% profit, that was a VTHO/USDT trade. I am positioning myself to fully be able to buy back in on my various cryptos of choice when the time arises because bear markets do not last forever.
I hope this is helpful with your trading and hodl-ing.

Next Breakout: Now or NeverLooking at the MACD and CCI with almost any chart including BTC on a daily and weekly timeframe shows the massive run ups in Oct 2020 and Jul 2021. Looking at recent MACD over past few years shows MACD dipped below zero preceding these run ups. The MACD is below Zero just as it was in Jul 2021. Current long term strategy is bullish. Additionally using "Pivot Points Standard" I have noted the times the price crosses up through the Pivot it will cross up through R1 and R2 stopping at R3. BTC is near the pivot point on the Daily and Weekly timeframe if price climbed to R3 it would hit ~60K in the next few months.

VET.USDT (Y22.P1.E1).Macro levels of importanceHi All,
Similar to BTC, we have this level , the fib ext of 1 for the ABC.
However if BTC loses the 30 k or 34 k level, we will likely lose this level.
We can time it at the time.
I think the Alts will also give us a feeling as to BTC doing a reaccumulation or continue on the correction.
Time will tell.
All the best,
S.SAri

short VETWe are shorting on the breakout of the m15 timframe channel that has been created.
Entry: 0.05130 - 0.05140
SL: 0.05356
TP1: 0.05015
TP2: 0.04953
TP3: 0.04774

VETUSD READY FOR RALLY TO $0.60After Vechain has broken below its long term down trend line channel,I am not bearish on this pair in the short term. VET is currently trading on support Level as its retesting again on the zone I don’t see this pair recovering until BTC performs better.
VET has formed double bottom something that is bullish but lets wait for bullish confirmation candle on the second leg
Comment below to see whats your idea on ve-chain

VET/USD: Vechain to the bear marketIn this special analysis, I analyze the cryptocurrency Vechain, and also, becuase I'm very interesting to study this cryptocurrency to starting to save money and find down the exactly point to buy cheap and accumulating a lot about this cryptocurrency by medium to long term.
Vechain it's another cryptocurrency that I admire a lot and has a good fundamental analysis that I heard about it. But I just want to share my idea where Vechain going to this bear market
Vechain worth $0.04 cents and I have my perspective that Vechain it's leading to $0.01 cents approx. But also, I have another point that Vechain could to reach include to $0.009 cents approx. And also, we could to see a price of 0.023 cents approx. But I proyect that Vechain it's leading to the exactly $0.01 cents.

vechain usdpump it up , good looking retest on the trendline
hope its hodlssss like we do ;)
target is 1.618 fibo level
0.40 usd +-

Vet Vechain broke downtrend;BIG MOVES comingVechain in this daily chart holding steady just above the ema 5, 10 & 20 lines.
It also holds the strong lower horizontal support zone.
Bollinger Band also squeezing signaling a very strong move soon.
First thing bulls have to do is to break above the ema 50 green line resistance to get inside the Ichimuko Cloud. Breaking above the cloud will commence a bull run.
Pls check but I think there is a slight divergence in the RSI.
Not trading advice

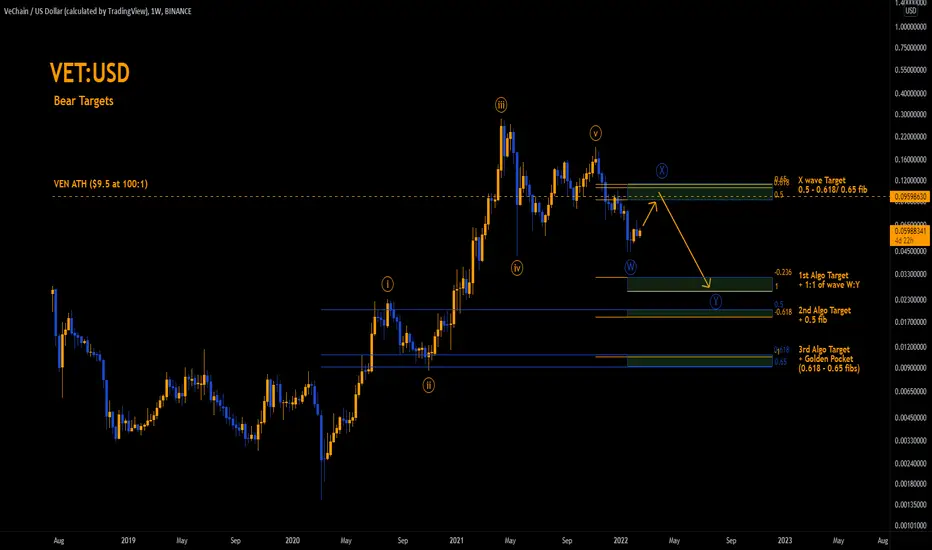
VET:USD Bear Targets $0.009 - $0.03I thought this was going to be a quick and easy analysis but it's latterly taken days! I got bogged way down in the Elliott count and in the end had to strip the chart bare and start again. What you see here is as simple as I could make it. I still prefer the bull count but it's always good to have a roadmap for when you're wrong. But there are a couple of reasons to lean into this bear count over the bullish one; the 144, 169 & 244 EMAs have now crossed bearish on the Daily. Combine that with the amount of time this correction has taken and now the case for this bear count is starting to stack up.
Key Points:
1st full impulse potentially complete
looking for a rally to put in the X wave before continuing lower
There are 3 high probability zones for the Y wave in this bear count
If the X wave only makes it to the 0.5 fib, the target for the 1:1 of X:Y moves lower and becomes part of the 2nd cluster near the 0.5 fib
If this count is correct I would love it to stop at the first target! But keep in mind if this is a completed 1 wave and we are now looking for a 2nd wave low on the higher degree; the high probability zone is between the 0.5 - 0.618 fibs.
The Trade: Short:
Entry 1: $0.0911
Stop 1: $0.0969 -6.3%
Entry 2: $.1083
Stop 2: $0.1149 -6%
Cluster 1
Target 1: $0.0312 1st algo -0.236
Target 2a: $0.0253 1:1 wave X:Y (projected from the 0.618)
Cluster 2
Target 2b: $0.0253 1:1 wave X:Y (projected from the 0.5)
Target 3: $0.0203 0.5 fib
Target 4: $0.0178 0.618 2nd algo -0.618
Cluster 3
Target 5 $0.0109 0.618 fib
Target 6: $0.0102 3rd algo -1
D.Y.O.R. DO NOT BLINDLY TAKE THESE TRADES.
Never Trust. Verify. DO NOT TRUST THIS ANALYSIS.
This is not financial advice. These are just my observations.
Technical Analysis is not about being right, it's about increasing your odds.
Be prepared to be wrong. Risk management is key . Capital preservation above all else.
These analysis take a considerable amount of time, consequently, I'm not taking any analysis requests.
Please respect my time and don't ask; because I dislike having to reject you
VET/USDVeChain Update
VeChain had broke out of its previous Falling Wedge Pattern but is still in a downwards channel.
VeChain failed 4x to close above its sideways Pitchfork Median Line (A,B,C).
VeChain has closed below its Least Squares Moving Average (LSMA) on this 1 day timeframe. Note that a close below the LSMA is considered a sell signal.
At the moment, VeChain has found support from its Bollinger Bands Middle Band Basis 20 Period SMA. A close below the BB Basis and re-test as resistance will be further confirmation of continued downwards momentum on this 1 day timeframe.
Note that VeChain is still below its Volume Profile Fixed Range Point of Control (VPFR POC) for the fixed range of 10x daily candles that i have selected.
Note that VeChain is still below its Volume Profile Visible Range Point of Control (VPVR POC) fro this charts visible range.
Volume is still low on this Binance chart and the last 4x daily Volume Bars have closed below its Volume 20 Period MA.
I have added some areas of potential support as highlighted by the horizontal Black Lines with Yellow Shading.
Looking at the Average Directional Index (ADX DI) we can see that Negative Momentum has overtaken Positive Momentum on this 1 day timeframe because the -DI (Red Line) has crossed back above the +DI (Green Line). The -DI (Red Line) has risen to 22.81 and the +DI (Green Line) has dropped to 18.72. The trend strength is weakening with the ADX (Orange Line) dropping to 24.14 an it is still below its 9 Period EMA (Black Line) which is at 28.46 and is a further sign of weakening trend strength.
Looking at the Elders Force Index (EFI) we can see that the bulls have lost a lot of strength but is sideways at the moment, note that the EFI Line (Red Line) is still above the 0 Base Line. Note that the EFI Line (Red Line) has dropped below its 9 Period EMA (Cyan Line) which is a further sign of weakening bull strength. If the EFI (Red Line) crosses below the 0 Base Line then that means that the Bears have taken full control on this 1 day timeframe.
Looking at the STOCHASIC indicator (STOCH) we can see that momentum is downwards at the moment and note that the %K Line (Blue Line) is still below its %D Line (Orange Line). Note that the %K Line (Blue Line) is indicating that VeChain still has room to drop before becoming Oversold on this 1d timeframe.
Looking at the Moving Average Convergence Divergence (MACD), we can see that the MACD Line (Blue Line) is point downwards and is still under the 0.0 Base Line in the Negative Zone. The MACD Line (Blue LIne) is still above its Signal Line (Orange Line) so we need to keep an eye on this as if the MACD Line (Blue Line) crosses back below the Signal Line (Orange Line), as this will be a sell signal for this indicator on this 1 day timeframe.
There are a few things to look out for if you are uncertain if or when to go long, be on the lookout for a successful daily close above the LSMA, the Bollinger Bands Middle Band Basis and The Pitchfork Median Line as well as keeping an eye out for any successful retest of those levels as support. With any rise, you need to also keep an eye on the volume as ideally you want any sustainable rise to be supported by increasing volume strength. Also be on the lookout for if/when VeChain crosses back above the upper descending trend-line of the descending channel as well as any successful retest of that previous resistance as support.
So at the moment, it looks like there will be some really good opportunities coming up to acquire more VeChain or your crypto of choice at a much cheaper price.
I hope this is helpful with your trading and hodl-ing.

VET : USD New Bull Targets $0.64c - $0.71 Like almost everything else in the crypto space, the proposed wave 4 for Vechain is deeper and has taken longer than I would like to see. Worth noting is that wave 3 didn't hit the full 1.618 extension either. Above is the bullish case but I also have a bearish case in mind that I will post early next week.
Key Points:
Wave 2: Hit high probability zone (0.618 fib)
Wave 3: Hit 2nd most likely extension (1.272 fib)
Wave 4: Retraced deep (0.5 fib)
Wave 5: Target $0.64 - $0.71
Wave C of the 4th wave correction only extended to 0.786 of A wave projected from the end of wave B.
Median line trade in play
The Trade:
Entry 1: Retest of the 1h 244 EMA
Entry 2: Breakout and retest of the 4h EMA once it had crossed bullish
Target 1: Median line ~$0.20 (80% probability trade as long as wave 4 pivot holds)
Target 2: 0.236 fib of wave 3 $0.64
Target 3: 1:1 of wave 1 projected from end of wave 4 $0.71
Stop 1: Break and close below 1h 244 EMA (Can re enter on any bullish break above the EMAs or any retrace to significant fib zones, but a break below the wave 4 low had me out of this trade to re assess)
Stop 2: Once the 4h 244, 169, 144 EMAs have crossed bullish and price is above, Exit position on the break close and test from below the 4h 244 EMA
*Note:
After looking at this again I realize the 4th wave correction should be labeled as a WXY correction instead of ABC- I also realize labeling as an WXY without putting it on the chart itself might confuse new traders and either way it doesn't change the outcome of the projections so I'll leave it as is for now!
Never Trust. Verify.
D.Y.O.R. Not Financial Advice Just an Observation.
Technical Analysis is not about being right, it's about increasing your odds.
Be prepared to be wrong. Risk management is key . Capital preservation above all else.
Please be aware: these analysis take a considerable amount of time, consequently, I'm not taking any analysis requests.
Please respect my time and don't ask; because I feel bad when I have to reject you!

VETUSD for new ATH use fibonacci levelsVetusd its in the down trend channel,lets keep buying as the market structure its creating a bullish reversal pattern,that bulls are back in the market
If Vet hitts previous ATH,make proper use of fibonacci retracement for exit positions

VET LongRSI is in the buy area, MACD is showing that buyers are in control and consolidation is forming at the support for the past few days. Looks like this is a great entry point. Exit at $0.08 and $0.10. Let's see how this works. Do your own planning. Not trading advice.

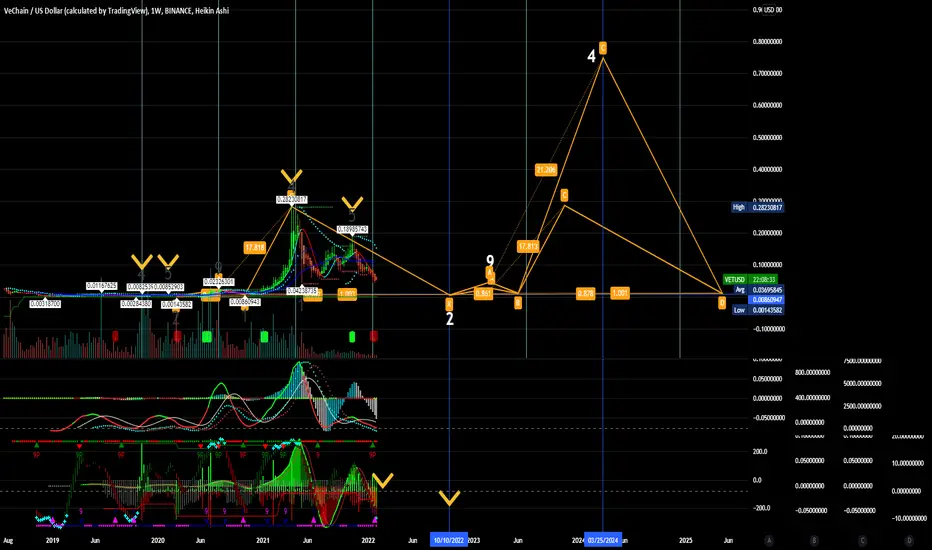
$VETUSD DBL Bottom$VETUSD entry PTs .001435-.008609 Target PTs .7628-1 and higher (Buy on 10/10/2022)
Possibly .00143582 to .75 Returns 522X Possible returns +19,561% to +52,134%
Prior run .00143582 to .2823 Returns was 196X +19,561%
Sequence 5; 1 bar .00541018 X 6
Sequence 9; 6 bars .00541018 X 6 = .032
Sequence 4; 8 bars .032 X 8 = .2596
VeChain Coin Price & Market Data
VeChain price today is $0.060368 with a 24-hour trading volume of $271,235,528. VET price is up 3.2% in the last 24 hours. It has a circulating supply of 67 Billion VET coins and a total supply of 86.7 Billion. If you are looking to buy or sell VeChain, HitBTC is currently the most active exchange.
What is Vechain?
VeChain is a blockchain-enabled platform that is designed to enhance supply chain management processes. By utilizing tamper-proof and distributed ledger technology, VeChain provides retailers and consumers with the ability to determine the quality and authenticity of products that are bought. From product source materials, to servicing history, and spare part replacements, every single piece of information about the supply chain movement of a product can be recorded and verified to bring about a supply chain management ecosystem that is secure for all participants. VeChain plans to achieve this secure supply chain management ecosystem via the method of asset digitization. VeChain enables manufactures to assign products with unique identities to the platform. This will allow manufacturers, supply chain partners, and even consumers, to track the movement of products through their supply chain.
Vechain Foundation
There is also the VeChain Foundation. The Vechain Foundation is a non - profit entity established in Singapore in July 2017 and is responsible for the construction of the network, and technological research and development. The Foundation also plays an important role in business development. The Foundation encourages and supports partnerships with enterprises that may be interested in utilizing blockchain technology as a service. This includes payment services, private key management, smart contract development, and wallet development. There is no doubt that blockchain technology can be an important innovation to supply chain management. With a growing list of business partnerships and technological developments, VeChain is positioning itself to be THE disruptive, and innovative force that reshapes the way we think about supply chain management.
VeChain team
Sunny Lu is the CEO of the VeChain Foundation and has already become an important figure in the blockchain space. Before he established VeChain, he co-founded the Chinese Internet start-up which developed Qtum, a very important digital asset in the crypto space. He was previously the CIO and COO of Louis Vuitton China.The team behind VeChain consists of over 90+ employees, most of them being developers. Chief Technology Officer, Gu Jianliang, has over 18 years of experience in areas such as mobile devices and the IoT field, and has created over a 100 patents in several technological fields. Kevin Feng serves as the Chief Operations Officer of the VeChain Foundation. Feng has been actively involved in many technology projects in his 12 years working for VeChain’s partner, PWC, as a consultant and assurance advisor.


VET updateAfter Vechain has broken below its long term trend line, I am not bearish on this pair in the short term. VET is currently trading a support level established back in February of 2021, a year ago. If VET breaks below support at .053, price can drop until .03 before a short rebounding. I don’t see this pair recovering until BTC performs better.
