$VET USD 1HR INCOMING PUMP?Structure & Zones
Price is trading between a clear supply zone above and a demand zone below, offering defined areas for reaction.
Two unfilled FVGs on the 1D timeframe above current price could act as magnet zones for price continuation.
A 4H FVG just beneath current price is nearly filled — potential area for a bullish bounce.
Three psychological price levels are marked and align with Fibonacci and FVG targets, likely to act as resistance zones if price pushes higher.
Trend & Pattern
High timeframe (HTF) remains bullish, supported by the formation of a rounding bottom — a strong reversal structure suggesting accumulation.
Lower timeframe (LTF) is showing short-term bearishness as price pulls back and retests key support/trendline.
Price is holding above a bullish trendline, maintaining structure unless a breakdown occurs.
Volume & Momentum
The OBV indicator shows a broken rising wedge, signaling a possible momentum slowdown or short-term correction.
Anchored volume profile reveals high volume beneath price — indicating that previous trading activity supports current levels and adds bullish confluence.
Outlook & Trade Consideration
Bias remains bullish overall, supported by HTF structure and unfilled FVG targets above.
A potential pullback into the 0.5–0.618 fib retracement zone or into the 4H FVG could present long entry opportunities.
On continuation, price may target the daily FVGs and psychological levels as resistance or take-profit zones.
Watch for a rejection at fib/psych levels or breakdown below the bullish trendline to reassess bias.
VETUSDT trade ideas

#VET/USDT#VET
The price is moving within a descending channel on the 1-hour frame, adhering well to it, and is heading towards a strong breakout and retest.
We are experiencing a rebound from the lower boundary of the descending channel. This support is at 0.02086.
We are experiencing a downtrend on the RSI indicator, which is about to break and retest, supporting the upward trend.
We are heading towards stability above the 100 Moving Average.
Entry price: 0.02160
First target: 0.02226
Second target: 0.02274
Third target: 0.02344

VET 28X Next Bull RunVeChain
''VeChain is the world's leading enterprise-grade L1 smart contract platform, with an ultra-low carbon & highly scalable blockchain architecture''.
The price is moving within a price channel, respecting an upward trend despite all the current negativity. Any positive market movement will see the currency rise significantly.
I wish everyone abundant profits.
Like and follow
for more.

VETUSDT Cryptocurrency Futures Market Disclaimer 🚨🚨🚨
Trading cryptocurrency futures involves high risks and is not suitable for all investors.
Cryptocurrency prices are highly volatile, which can lead to significant gains or losses in a short period.
Before engaging in crypto futures trading, consider your risk tolerance, experience, and financial situation.
Risk of Loss: You may lose more than your initial capital due to the leveraged nature of futures. You are fully responsible for any losses incurred.
Market Volatility: Crypto prices can fluctuate significantly due to factors such as market sentiment, regulations, or unforeseen events.
Leverage Risk: The use of leverage can amplify profits but also increases the risk of total loss.
Regulatory Uncertainty: Regulations related to cryptocurrencies vary by jurisdiction and may change, affecting the value or legality of trading.
Technical Risks: Platform disruptions, hacking, or technical issues may result in losses.
This information is not financial, investment, or trading advice. Consult a professional financial advisor before making decisions. We are not liable for any losses or damages arising from cryptocurrency futures trading.
Note: Ensure compliance with local regulations regarding cryptocurrency trading in your region.
thanks for like and follow @ydnldn to have more information outlook and free signal.
About me :
"I am a passionate swing trader focused on analyzing financial markets to capture profit opportunities from medium-term price movements. With a disciplined approach and in-depth technical analysis, I concentrate on identifying trends, support-resistance levels, and price patterns to make informed trading decisions. I prioritize strict risk management to protect capital while maximizing profit potential. Always learning and adapting to market dynamics, I enjoy the process of refining strategies to achieve consistency in trading."

VETUSDT 1W AnalysisVET ~ 1W Analysis
#VET Buy back gradually from here if you still have confidence in this coin with a short term target of at least 20%+ from here.
VeChain (VET): Huge CME Gap Near $5,60 | Bullish MovementAs markets are showing strong buyside dominance, so does the VET coin, where we seem to have established some sort of local bottom. If we keep similar buyside dominance, we will be seeing a good upward movement where, firstly, we will be targeting the $0.333, after which we will be targeting the bullish CME.
Swallow Academy

Vechain, Pick Your Own All-Time HighA mirror image from 2020-2021 would put a new all-time high for VETUSDT (Vechain) around mid-May 2026. Starts late ends late, right?
This is a great chart. Vechain hit bottom June 2023 and has been consolidating within a rising channel. A rising channel as in higher highs and higher lows. Now, this is bullish but still not a bull market but bullish consolidation.
Consolidation can happens in three different ways:
1) Purely sideways. When the action happens within a range.
2) Bearish consolidation. When consolidation produces lower highs and lower lows.
3) Bullish consolidation. As we see here, with higher highs and higher lows.
Now, this is bullish but still only part of the transition period. Bull market action is what you see on the left between March 2020 and April 2021. Notice the huge difference.
Some other projects have been producing lower lows but this isn't a bear market more like bearish consolidation. We are about to enter the bull market phase. And this phase tends to end in a bull run.
If the same pattern from 2020-2021 repeats, we can see a new all-time high in May 2026. I have four new ATH projections on this chart, pick your own.
Thank you for reading.
Namaste.

$VET sell side liquidity swept, buy side liquidity in sight!NYSE:VET has formed a classic double bottom pattern. The second leg has swept sell side liquidity and is heading towards the nearest area of interest.
Good luck traders!
Kieza Tradez

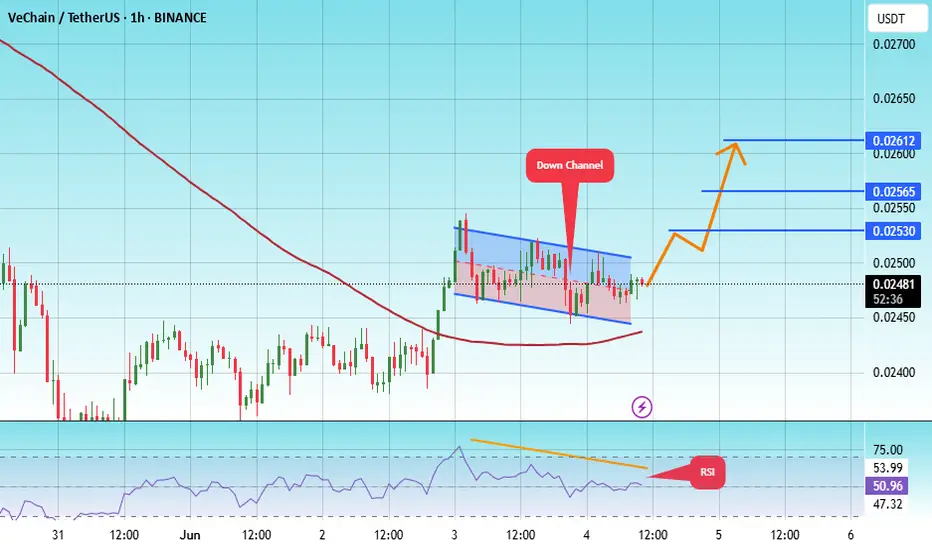
#VET/USDT#VET
The price is moving within a descending channel on the 1-hour frame, adhering well to it, and is heading towards a strong breakout and retest.
We are experiencing a rebound from the lower boundary of the descending channel. This support is at 0.02456.
We are experiencing a downtrend on the RSI indicator, which is about to break and retest, supporting the upward trend.
We are heading towards stability above the 100 Moving Average.
Entry price: 0.02480
First target: 0.02530
Second target: 0.02565
Third target: 0.02612
VETUSDT 1D Analysis VET ~ 1D Analysis
#VET This support block might be something you can start considering to start buying back from here with a short-term target of at least 10%++
VeChain (VET): Aiming For 200EMA on Daily TimeframeVeChain has bounced well from the local bottom, where price might be heading now towards the 200EMA line once we see a proper breakout from the current resistance zone where price is at right now.
Swallow Academy

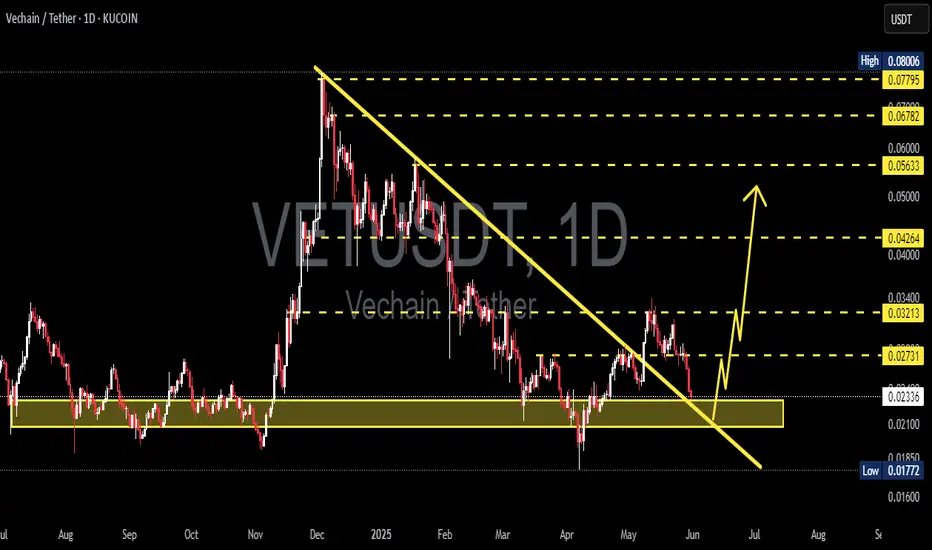
#VET/USDT#VET
The price is moving within a descending channel on the 1-hour frame and is expected to break and continue upward.
We have a trend to stabilize above the 100 moving average once again.
We have a downtrend on the RSI indicator that supports the upward move with a breakout.
We have a support area at the lower boundary of the channel at 0.02750, which acts as strong support from which the price can rebound.
Entry price: 0.02936
First target: 0.03070
Second target: 0.03200
Third target: 0.03391

TradeCityPro | VETUSDT The Best Entry Opportunity Awaits👋 Welcome to TradeCityPro Channel!
Let’s dive in and analyze one of the veteran coins in the cryptocurrency space, VET, which has a high potential for movement. Together, we’ll identify its entry triggers.
🌐 Overview Bitcoin
Before starting the analysis, I want to remind you again that we moved the Bitcoin analysis section from the analysis section to a separate analysis at your request, so that we can discuss the status of Bitcoin in more detail every day and analyze its charts and dominances together.
This is the general analysis of Bitcoin dominance, which we promised you in the analysis to analyze separately and analyze it for you in longer time frames.
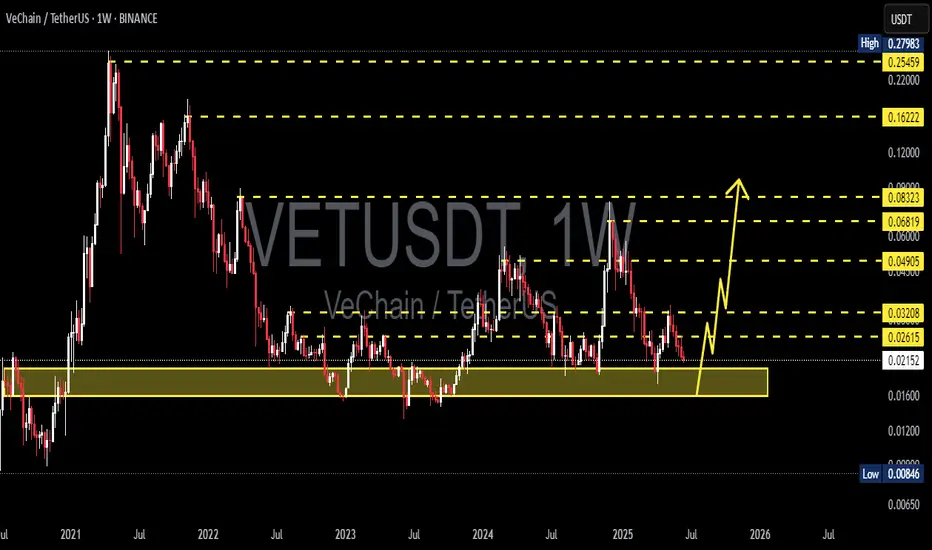
📊 Weekly Time Frame
In the weekly time frame, VET is one of the coins that’s in a relatively good position compared to other altcoins. While most altcoins have recorded new lows, VET has never lost the 0.01430 level!
After being supported at 0.01922 and closing a green weekly candle, we experienced an upward move. Currently, we’re stuck at the resistance of 0.03176, and it seems we’re pulling back to this resistance.
📉 Daily Time Frame
In the daily time frame, after an upward wave that didn’t quite reach the 0.09 resistance, a fake candle occurred, and we entered a box between 0.04197 and 0.05253. Seller presence and a rejection from the middle of the box led to losing the 0.04197 support.
After breaking this support, we experienced a sharp decline. When we reached the 0.01925 support, the bearish momentum hit its lowest point, and we saw reactions from buyers, leading to an upward move.
Currently, we’re below the key resistance at **0.03233**. After breaking this level, we can expect a sharp upward move. You can take a position in both **futures and spot**, with the safest stop loss for your buy at 0.01925
✍️ Final Thoughts
Stay level headed, trade with precision, and let’s capitalize on the market’s top opportunities!
This is our analysis, not financial advice always do your own research.
What do you think? Share your ideas below and pass this along to friends! ❤️

Check if it can break through 0.03779-0.04757 at once
Hello, traders.
If you "Follow", you can always get new information quickly.
Have a nice day today.
-------------------------------------
(VETUSDT 1W chart)
Support zone: 0.00440-0.101741
Resistance zone: 0.03779-0.04757
If it breaks through the resistance zone upward and maintains the price, it is expected that a step-by-step uptrend will begin.
Therefore, it is important to check whether there is support around 0.03779-0.04757.
-
(1D chart)
The key is whether it can maintain the price by receiving support near the M-Signal indicator on the 1M chart and rising to around 0.03779.
If it fails to rise, you should check for support near 0.02778.
If it falls below the 0.01741-0.2135 range, you should stop trading and watch the situation.
Therefore, the 0.01741-0.2135 range is an important support range from a short-term perspective.
-
The 0.03779, 0.04757, and 0.06603 points are important points as HA-High indicator points on the 1W, 1M, and 1D charts.
It is expected that a breakout trade will be possible when it breaks through the 0.03779 point, but since an important point is located before it rises much, the point to watch is whether it can maintain the price by rising above 0.04757 at once.
Therefore, when making a breakout trade, check if it rises above 0.04757, and if not, respond.
-
Thank you for reading to the end.
I hope you have a successful trade.
--------------------------------------------------
- This is an explanation of the big picture.
I used TradingView's INDEX chart to check the entire range of BTC.
I rewrote the previous chart to update it by touching the Fibonacci ratio range of 1.902 (101875.70) ~ 2 (106275.10).
(Previous BTCUSD 12M chart)
Looking at the big picture, it seems to have been following a pattern since 2015.
In other words, it is a pattern that maintains a 3-year bull market and faces a 1-year bear market.
Accordingly, the bull market is expected to continue until 2025.
-
(Current BTCUSD 12M chart)
Based on the currently written Fibonacci ratio, it is displayed up to 3.618 (178910.15).
It is expected that it will not fall again below the Fibonacci ratio of 0.618 (44234.54).
(BTCUSDT 12M chart)
I think it is around 42283.58 when looking at the BTCUSDT chart.
-
I will explain it again with the BTCUSD chart.
The Fibonacci ratio ranges marked in the light green boxes, 1.902 (101875.70) ~ 2 (106275.10) and 3 (151166.97) ~ 3.14 (157451.83), are expected to be important support and resistance ranges.
In other words, it seems likely to act as a volume profile range.
Therefore, in order to break through this section upward, I think the point to watch is whether it can rise with support near the Fibonacci ratios of 1.618 (89126.41) and 2.618 (134018.28).
Therefore, the maximum rising section in 2025 is expected to be the 3 (151166.97) ~ 3.14 (157451.83) section.
To do that, we need to look at whether it can rise with support near 2.618 (134018.28).
If it falls after the bull market in 2025, we don't know how far it will fall, but considering the previous decline, we expect it to fall by about -60% to -70%.
So, if the decline starts near the Fibonacci ratio 3.14 (157451.83), it seems likely that it will fall to around Fibonacci 0.618 (44234.54).
I will explain more details when the downtrend starts.
------------------------------------------------------

VETUSDT: trend in daily time framesThe color levels are very accurate levels of support and resistance in different time frames, and we have to wait for their reaction in these areas.
So, Please pay special attention to the very accurate trend, colored levels, and you must know that SETUP is very sensitive.
Be careful
BEST
MT

#VET/USDT#VET
The price is moving within a descending channel on the 1-hour frame, adhering well to it, and is on its way to breaking it strongly upwards and retesting it.
We are seeing a bounce from the lower boundary of the descending channel, which is support at 0.02600.
We have a downtrend on the RSI indicator that is about to break and retest, supporting the upward trend.
We are looking for stability above the 100 moving average.
Entry price: 0.02750
First target: 0.02838
Second target: 0.02908
Third target: 0.03000

VETUSDT 1D#VET has broken above the descending resistance and the neckline of the inverse head & shoulders pattern on the daily chart. Looks promising. Targets are:
🎯 $0.03306
🎯 $0.03780
🎯 $0.04254
⚠️ Use a tight stop-loss.

Vet VeChain forming an expanded triangle patternLooks like a triangle to me! i think we have 2 possibility's when we move up. i think we could break At E or we have to hit the bottom trend line one more time. what others think?

VET Successfully breakout this resistant lineSuccessfully breakout this resistant line with a short -term target of at least 10%+.

VETUSDT 1D AnalysisVET ~ 1D Analysis
#VET Buy after successfully penetrating this resistant line with a short -term target of at least 10%+ from here.

April 2025 cycle top for $VET?Using a fractal from the 2021 NYSE:VET bullrun a cycle top in mid-April 2025 is possible. This would coincide with a 4-year cycle model.
If NYSE:VET does exceed its ATH then Fib extension targets are as follows:
1.272 Fib = $0.64
1.414 Fib = $0.98
1.618 Fib = $1.82

Vechain is at a good RRVET is at a major support level. If the price can give us more indications of a reversal, this could be the bottom. Momentum and trend oscillators are trending up. Market structure needs a bit of work, but it could be the beginning.
Full TA: Link in the Bio

VeChain Range & Structure AnalysisBINANCE:VETUSDT has been range-bound since November 2023, with very clear levels.
Key Zones
• Weekly Demand Zone: $0.019–$0.022 — major support with multiple rebounds.
• Weekly Supply Zone: $0.045–$0.055 — strong resistance dating back to early 2024.
• Midrange / HVN: ~$0.037 — heavy volume area and likely resistance if tested.
• Local Resistance: $0.027 — recent swing high + S/R since December 2023. A daily close above could mark a change of character and a shift to a bullish bias.
Possible Scenario
• With a daily close above $0.027, VET may revisit the $0.055 range high — with potential resistance at the midline along the way.
• If $0.055 is reached and followed by a sharp rejection, we might start seeing the formation of a macro Head & Shoulders — with $0.019 as a key neckline.
• Breakdown below $0.019 would activate a target near $0.0045.*
• Break above $0.055 would invalidate the H&S idea and could open the door toward $0.1150.*
* H&S scenario is purely hypothetical and would require structure confirmation.
