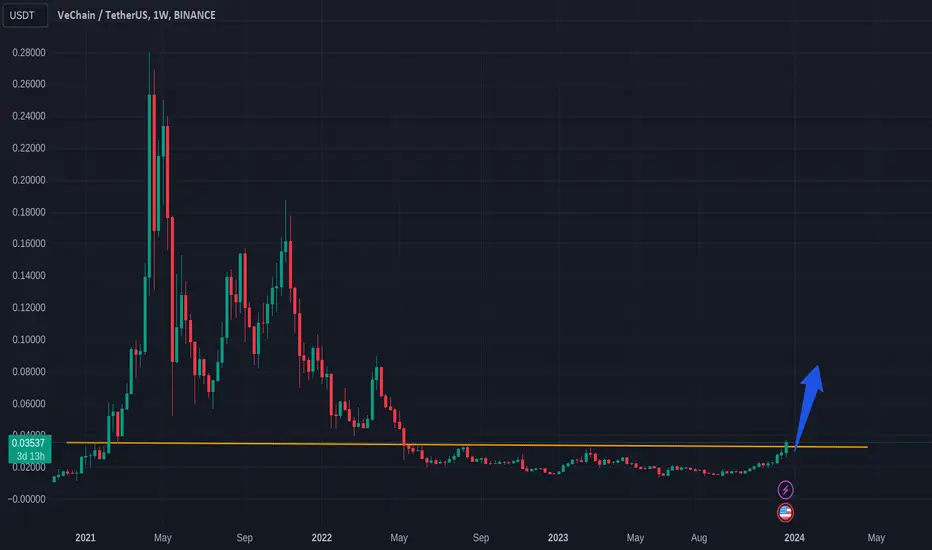
VET/USDT | Vechain | 1W 👀Certainly, I hold this token in my portfolio, comprising no more than 2% of the total balance. I find the $0.025 and $0.017 levels intriguing for accumulation, where I've positioned my limit buy orders. Consequently, I'm prepared for potential further market downturns, which remain a possibility.
- Not financial advice, trade with caution.
✅ Stay updated on market news and developments that may influence the price of Vechain. Positive or negative news can significantly impact the cryptocurrency's value.
✅ Exercise patience and discipline when executing your trading plan. Avoid making impulsive decisions driven by emotions, and adhere to your strategy even during periods of market volatility.
✅ Remember that trading always involves risk, and there are no guarantees of profit. Conduct thorough research, analyze market conditions, and be prepared for various scenarios. Trade only with funds you can afford to lose and avoid excessive risk-taking.
#Crypto #Vechain #Investment #VET
VETUSDT trade ideas

VET ANALYSIS (4H)On the chart, from where we entered "START", we seem to see a correction.
This correction seems to be a diametric.
There was a suitable place for the termination of the D wave on the chart, which we marked with red color.
If the price reaches this range, you can enter a sell/short position.
We have specified the targets on the chart. We also specified the invalidation level. Closing a daily candle above this level will violate the analysis
For risk management, please don't forget stop loss and capital management
When we reach the first target, save some profit and then change the stop to entry
Comment if you have any questions
Thank You

Vet vs USD - abandon shipThis weekly chart shows price action is overbought and starting to correct. The candle stick patterns 'spinning top' represent buyer / seller indecision/ This tells us neither buyers or sellers are knowing which direction to go. The bears have clearly taken control following this overbought period.

VECHAIN - Massive Drop Inbound!In our last analysis we identified that we were in wave 4 correction and were looking for one more move lower.
We successfully remained below the wave 4 invalidation level, making our current scenario valid.
We are expecting price to move lower to 0.013 to complete subwave 5 of wave C.
Trade Idea:
- look for shorting opportunities with stops above the wave 4 invalidation level (stops above 0.04)
- Target: 0.013 and then taper as we move lower
Goodluck and trade safe!

VET longReclaimed long 2022 range. Back to top of the range. Playing long narrative after long downtrend. Keep it simple.

it's time to going down for VETUSDTbefore buying, please check for being sure about your opinion about this CRYPTOCURRENCY!!!
(in every target you want, closed the position but our target is the third one)
*Guy's the entry place is importance things in enter in a position and be careful do not going up your leverage over 7x ,all things it's about risk management*
*************************************************
if you want to enter in this position:
Enter Price: here
Target1: 0.03010
Target2: 0.02964
Target3(Final Target): 0.02889
Stoploss: 0.03184
*************************************************
Guy's if this idea was useful and it was intresting for you please follow for more
please do comment and like my idea
If you like my idea show me in comment section
doing and living in the best quality
thanks of all of you dear's ;)

VET's Epic Accumulation : Bracing for a BreakoutVeChain (VET) has been immersed in a monumental horizontal accumulation since May 2022, an extended gathering of bullish energy. Recent attempts to explosively breach the upper boundaries faced a swift rejection, potentially fueled by Bitcoin's overstretched conditions. As the crypto giant takes a breather, VET might aim for a retest around 0.02, revisiting an older trendline, before catapulting into a new era of growth.
Key Phases of VET's Accumulation Odyssey:
The Grand Accumulation (May 2022 - Present):
VET embarked on an extensive period of horizontal accumulation, fortifying its foundations for a potential bullish escapade.
The length of this accumulation suggests the potential for a substantial breakout when the time is ripe.
Explosive Attempts and the Swift Rejection:
Recent endeavors to explosively breach the upper boundary of the accumulation zone were met with a rapid retreat.
Bitcoin's overbought conditions might have influenced this pullback, creating an opportunity for a strategic retest.
The Unfolding Drama - What Lies Ahead:
Potential Retest at 0.02:
As Bitcoin exhibits signs of exhaustion, VET may strategically plan a retest around the 0.02 mark.
This maneuver serves a dual purpose, aligning with a historical trendline and providing a robust foundation for the next ascent.
Building Momentum for a Breakout:
The extended accumulation, combined with a meticulous retest, sets the stage for a formidable breakout.
Traders and investors should keep a watchful eye on the evolution of this accumulation drama, anticipating signs of a pending surge.
Strategies for Traders:
Patience and Vigilance:
Traders should exercise patience during accumulation phases, waiting for optimal entry points.
Vigilantly monitor price movements, recognizing potential signals for a breakout or retest.
Adapting to Bitcoin's Influence:
Given Bitcoin's influence on the market, traders must adapt their strategies to align with its prevailing conditions.
Utilize indicators and market signals to gauge Bitcoin's impact on VET's movements.
Conclusion: VET's Symphony of Accumulation and Breakout Anticipation
VET's prolonged accumulation period, coupled with a strategic retest, paints an intriguing picture. As the drama unfolds, traders brace for a symphony of accumulation and breakout, positioning themselves strategically for the crescendo.
📈 The Grand Accumulation | 🔄 Bitcoin's Influence | 🚀 Anticipating the Breakout Symphony
💬 Share your insights: How do you interpret VET's accumulation and what strategies are you employing during this crucial phase? 🌐✨

VETUSDT Bearish sequences have been formed on the daily frame. Activating these sequences and proving the corrective decline will extend to levels between 0.02261/0.1868 and then move to higher levels. We follow.

🐮💹🚀 Vet/Usdt Trading Idea 🚀💹🐮
Vet/Usdt is currently showing bullish signs 📈. The market structure has turned into a bullish pattern, and the price is retracing to test a new demand area 🔄. This could signify a potential upward movement. I anticipate a rise in price from this point, potentially ranging between 15-30% 📈🔥.
Remember, this analysis is not financial advice ❌📉. Always conduct your own research (DYOR) and make informed decisions. Happy trading! 💪💰📊

Vechain (VETUSDT) (1W)Below the technical analysis of BINANCE:VETUSDT
Timeframe: 1 week
The main supports and resistances are indicated in the idea: the down green one is the most important; if we lost it, the project is almost done.
Today marketcap: 2.4B

#VETUSDT 4H Chart
Price had tapped into the 4h demand at $0.288 where it moved up from leaving another 4h demand zone around $0.3 and it is currently retesting the resistance around $0.34. MACD is bullish, RSI is bought and EMAs are turning bullish. Price needs to break and close above this resistance in order to aim towards the next area of resistance at $0.038.

$VET ROAD TO 0.11Vechain has just confirmed it's previous breakout very nicely.
The next impulsive wave will be very powerful and should see VET reach 0.077 at the end of Jan before retracing.
Godspeed.

VET is bullish on the daily chartIn the daily chart, VET is moving to the target of $0.073 after breaking its trend lines and main resistances.

#VET/USDT LONG#VET
Since July 2022 the price has been moving in a bearish flag
Support was adopted on the bottom border of the flag
Now the price is about to increase this model
And the moving of the Moving Average 100was broken.
Price Now 0.02571
First Goal 0.03265
Second Goal 0.03969
Representing 170% of the current price
You must pay attention to the rebound points to be used.

#VeChain, THE FORGOTTEN CHINESE ETHEREUM, APPEARS TO MIRROR THE DYOR
If so, NYSE:VET could break through the $0.033 resistance barrier within the next some days. The upswing could send #VET to $0.077 by late January. That's a 150% price increase!

🚀VeChain (VET) Re-Accumulation Potential and Range Confirmation
#VET rallied +43% to Range High, confirmed to remain inside the range with new Monthly Close.
Potential re-accumulation range above major white breakout structure.
Possible move to tag Range Low as support for affirmation. 🚀📈
#VeChain #CryptoAnalysis

Mock Up Price Action for VET | Near-Mid Term (12HR)Mock Up Price Action for BINANCE:VETUSDT | Near-Mid Term (12HR)
- Watching and waiting for opportunities to enter short
Personal Approach & Base Chart Setup
- Stacked Parallel Channels for Grid of Confluence Points
- High Time Frame (HTF) Fib Extensions, Retracements, & Time Cycles
- Red Filled Horizontal Rectangles between areas of major Fib level from Extensions and Retracements
- Price Label Callout with Red Circle highlighting points of interest where I'd consider making a trade
- I will consistently monitor and adjust taking into consideration long/mid/near term price action and market conditions/news
Additional Remarks
Still watching and waiting for a movement like this before I consider entry into short. My most likely scenario to play out will be continued BTC ETF approval speculation and hype driven bullish pump for market leading into SEC decision, then upon the news dropping good or bad (IMO likely good and green light ETF approvals), a "buy the rumor sell the news" short term healthy pullback for the market. BTC has run for the past couple months and so in January my anticipated small/normal pullback correction and people taking profits playing to the buy the rumor sell the news.. Which this in my observation would initially present like a panic sell off of everything, but once folks realize BTC isn't going into the dirt and things stabilize out, range and accumulate, then ETH to take a turn in February next, before then the ALTs February into March. Money flowing from Large to Mid to Small to Micro cap as is the natural progression of things. And in March with the market having confirmed recovered and run bullish for all this time, some kind of bullish recovery top and then massive cascading dump leading into the BTC Halving event March through April, pulling back hard recovering, then May the beginning of a steady climb up and true bull cycle. I'm not chasing anything right now, as I believe its too risky to assume one way or the other. I Entered the market and made my trades October through November and essentially pulled out of all short term speculative positions/trading. I am now taking the opportunity to observe the market, watchlist and monitor the winners and price actions, map out potential bullish and bearish targets, and simply patiently wait for whatever this correction / crash / rug pull moment before cherry picking re-entering the market in earnest. Until then I will simply take advantage of quick trades in and out, in parallel to just accumulating my mid to long term bags of things I actually believe in like OKX:CSPRUSDT and BINANCE:XRPUSDT

VET on the moveWe see a multiple buy prints and our first target is the red line and there beyond the target print. DYOR

✴️ VeChain Double Cup (Fast 125%-175% Bullish Jump)I have to mention this because we have to look at both sides... The short-term bearish trade idea I shared recently for VETUSDT failed miserably... And that's good to be honest because we prefer to see prices going up rather than down.
Here we have a giant cup and another one even bigger.
VeChain is set for a massive explosion, a move that can develop within days and last only a few days to complete... That's my belief. It can happen really fast once it starts.
With that said, there is always room for retraces and corrections once the action is already on-going, allow for this in your planning.
✔️ Wishing you success.
✔️ Happy 2024.
Namaste.

VET another breakoutVET breaks above 0.030-0.0338, which is new high since May 2022.
as long as price above 0.003. we are seeing more upside to next resistance 0.055
DYODD


Vetusdt Trading opportunityBased on the recent bullish trend in VET, the price has undergone a correction and is currently exhibiting a structure resembling a typical round bottom formation.
If this pattern materializes as expected, it could lead to the formation of a small cup before a potential breakout.
The chart indicates the presence of a buyback zone and an important external demand zone, both of which are acting as strong support levels. Additionally, there is an internal supply zone and established resistance targets.
Your insights and engagement through comments and likes are appreciated. Thank you.

vet bullish on weekly !BINANCE:VETUSDT weekly reg broken. now it will pump very soon.
expecting a pullback.
you can buy and hold now or wait for a pullback