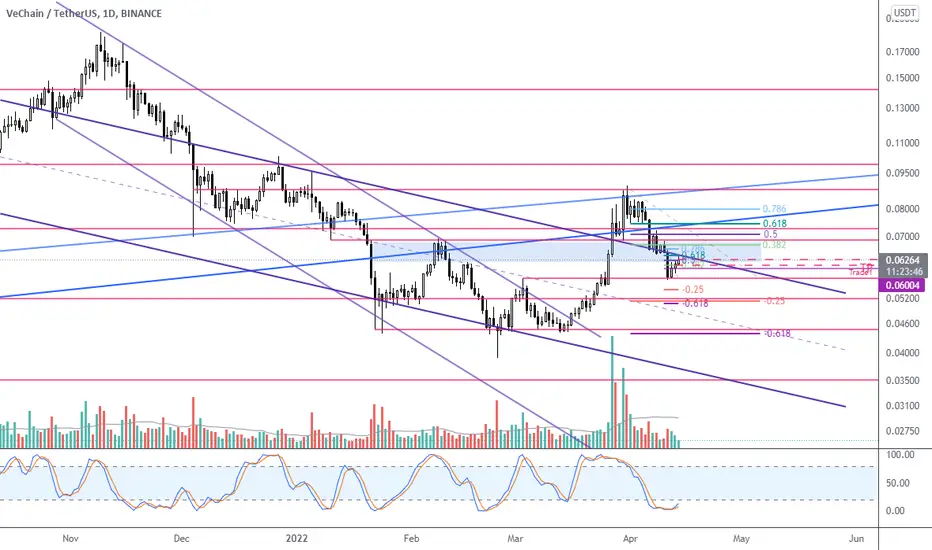
VECHAIN - Breakout Coming 🚨Vechain has completed the higher timeframe ABC correction and now we simply need to look for bullish corrections to enter.
We currently have a really nice bull flag with a solid trendline which we can monitor for a break. It's possible that we may revisit the double bottom before moving up so just bare that in mind and have it marked out on your charts incase we do get that scenario.
Trade Idea:
- Enter on breakout of corrective bullflag (red trendline)
- Stops below the correction
- Targets: 0.17, 0.28, 0.35, 0.45
Let us know your thoughts below.
Goodluck and trade safe!
VETUSDT trade ideas

VET WeeklyVET is one of the strongest projects in the realm of "the internet of things" aka IoT.
These levels are where I'm gonna invest. If BTC reaches 30K again, these buy levels will be touched, hopefully! :)

vet usd in buy situationhello to guys
vetusdt i think in a buy situation because we have a harmonic pattern and rsi is below 30 percent this mean may we have a short long
therefor wait and see or make a trade as own risk

Vet/usdt in the making of wave5vet/usdt is currently in the making of wave5 of expanding diagonal pattern which must be longer than wave 3.

A couple of different options for VET to take next week.I think both these options could easily play out, option 1 would take our 4th wave higher before we move down in our 5th. (if option 1 plays out then we would Need to adjust our lower end targets for wave 5.
Option 2 we go straight down to target levels to complete wave 5 and move on ups from there.
Option 3 would be that we just blast off to the moon and all my counts are wrong.

VETUSDTDISCLAIMER:
This is not financial advice! This is an opinion-based show. I am not a financial adviser. Please only invest what you can afford to lose, and we encourage you to do your own research before investing.
everyone should buy and sell according to their own strategy.
Everything you need to know is outlined in the chart and keep in mind that we are moving forward with probabilities and the analysis may be wrong so take capital management seriously.

VETUSDTThat's the idea the cross is dangerous i will do dca when comes to 0.4 zones. Might takes around 15 days.

vet can buy hold x2-5VeChainThor
The public blockchain that derives its value from activities created by members within the ecosystem solving real world economic problems
stl line red tg x2 x3 x5

V chain (VET) pice analysis with target buy area Possible price action for vet in the short term, a move down to this area would complete the final 5th wave structure, at this point i will expect a market reversal and some really nice gains in the coming weeks. GL trade safe

$VETUSDT UPDATE!!!!Hi Snipers,
Please refer to the recording for the next price levels and scenarios.
Thanks
MS

VETSalaam
VET return back inside the channel and retest the resistance line
also, go below the support area and retest it.
4h rejected from 61 Fibo that coincide with the resistance trend line (channel line)
But there is also the possibility that the weekly candle close above the channel.
(In this case, VET could continue rising.)
Don't forget to manage your risk.
Good luck
🔥 VET is in the wedge pattern 🔥Hello traders 🐺 .
1_pattern :
In the chart above we can see that VET is inside of the very big wedge pattern also you can call this as a bull flag because this pattern was formed after a bull run , the important fact about this pattern is that the this one formed in the higher time frame and as you might know the higher time frame you analysis the more your accurate become .
let's goes into the daily chart to look for the other patterns :
In the daily chart we can see that price tries to found a support from the weekly support and if price success to reverse from here , the next target is around the 0.618 which is alignment with the daily resistance structure ( blue box ) , but you can also take some profit above it around the 1.0 and after that at the top of the wedge .
2_EMA Ribbon :
after price break above the EMA Ribbon but after touching the daily resistance , price started to retracement and goes below the EMA Ribbon again but as you can see , EMA Ribbon is flipping bullish right now and in my opinion still there is good chance to goes above it again .
3_RSI & TSI :
TSI is still bullish and above the zero line and there is chance to find support from the zero line , but RIS is below the 50 however it's not bearish or bullish .
4_ price targets :
about the price targets I was talked about in the section 1 ( pattern ) .
This is not a Financial advice and always trade based on your trading strategy ; have nice day my dear friends .

VET/USDT If VET can stabilize above $0.062, it can reach $ 0.064 and $ 0.066
Support: $0.0586 & 0.0568
Like and comment please ❤

VETUSDT H16: 200% gains XABCD BEST LEVEL TO BUY(SL/TP)(UPDATED)Why get subbed to me on Tradingview?
-TOP author on TradingView
-2000+ ideas published
-15+ years experience in markets
-Professional chart break downs
-Supply/Demand Zones
-TD9 counts / combo review
-Key S/R levels
-No junk on my charts
-Frequent updates
-Covering FX/crypto/US stocks
-before/after analysis
-24/7 uptime so constant updates
🎁Please hit the like button and
🎁Leave a comment to support our team!
VETUSDT H16: 200% gains XABCD BEST LEVEL TO BUY(SL/TP)(UPDATED)
IMPORTANT NOTE: speculative setup. do your own
due dill. use STOP LOSS. don't overleverage.
IMPORTANT NOTE: always do your own due dill.
not financial advice.
🔸 Summary and potential trade setup
::: VETUSDT 16hour/candle chart review
::: new setup based on XABCD patter
::: still great setup for 200% gains
::: updated / revised / more realistic scenario
::: break below current cycle low at 0.046
::: expect actual low point C at 0.0388
::: at point C / so it's cycle low soon
::: speculative XABCD setup in progress
::: BULLS BUY DIPS / market BUY at 0.0388
::: from my level TP +200% gains
::: this is BUY/HOLD setup
::: patient traders only
::: not for gamblers
::: SPECULATIVE SETUP
::: do your own due dill
::: and use proper risk management
::: TP bulls is +200% gains USD
::: details: see chart
::: FINAL TP +200% gains point D
::: recommended strategy: BUY/HOLD
::: SWING TRADE: BUY/HOLD IT 0.05
::: final TP BULLS is 0.115 cents
::: bull run not over yet
::: good luck traders!
::: BUY/HOLD and get paid. period.
🔸 Supply/Demand Zones
::: N/A
::: N/A
🔸 Other noteworthy technicals/fundies
::: TD9 /Combo update: N/A
::: Sentiment mid-term: BULLS/PUMP/point D
::: Sentiment short-term: BEARS/PULLBACK/point C
RISK DISCLAIMER:
Trading Crypto, Futures , Forex, CFDs and Stocks involves a risk of loss.
Please consider carefully if such trading is appropriate for you.
Past performance is not indicative of future results.
Always limit your leverage and use tight stop loss.

Vetusdt / harmonic pattern / Elliotte 1-VETUSDT is in a long-term downtrend. We have identified the major points and it includes two downward waves and one upward correction wave, and it seems that the upward correction wave is similar to what has happened in the past. We think this wave should be ABC. To confirm this speculation, a harmonic pattern has also been identified.
2-We expect vetusdt to be able to touch the channel ceiling

VetBINANCE:VETUSDTPERP
stoploss for the trade is 0.05300$ and profit to taken from target 0.06050$_0.08000$

VETUSDT H2: 135% gains XABCD BEST LEVEL TO BUY(SL/TP)(NEW)Why get subbed to me on Tradingview?
-TOP author on TradingView
-2000+ ideas published
-15+ years experience in markets
-Professional chart break downs
-Supply/Demand Zones
-TD9 counts / combo review
-Key S/R levels
-No junk on my charts
-Frequent updates
-Covering FX/crypto/US stocks
-before/after analysis
-24/7 uptime so constant updates
🎁Please hit the like button and
🎁Leave a comment to support our team!
VETUSDT H2: 135% gains XABCD BEST LEVEL TO BUY(SL/TP)(NEW)
IMPORTANT NOTE: speculative setup. do your own
due dill. use STOP LOSS. don't overleverage.
IMPORTANT NOTE: always do your own due dill.
not financial advice.
🔸 Summary and potential trade setup
::: VETUSDT 2hour/candle chart review
::: new setup based on XABCD patter
::: still great setup for 135% gains
::: we are almost already for valid reversal
::: at point C / so it's cycle low soon
::: speculative XABCD setup in progress
::: BULLS BUY DIPS / market BUY NOW
::: from my level TP +135% gains
::: this is BUY/HOLD setup
::: patient traders only
::: not for gamblers
::: SPECULATIVE SETUP
::: do your own due dill
::: and use proper risk management
::: TP bulls is +135% gains USD
::: details: see chart
::: FINAL TP +135% gains point D
::: recommended strategy: BUY/HOLD
::: SWING TRADE: BUY/HOLD IT 0.05
::: final TP BULLS is 0.11 cents
::: bull run not over yet
::: good luck traders!
::: BUY/HOLD and get paid. period.
🔸 Supply/Demand Zones
::: N/A
::: N/A
🔸 Other noteworthy technicals/fundies
::: TD9 /Combo update: N/A
::: Sentiment mid-term: BULLS/PUMP/point D
::: Sentiment short-term: BEARS/PULLBACK/point C
RISK DISCLAIMER:
Trading Crypto, Futures , Forex, CFDs and Stocks involves a risk of loss.
Please consider carefully if such trading is appropriate for you.
Past performance is not indicative of future results.
Always limit your leverage and use tight stop loss.

VETSalaam
VET seems very good atm
Breaking the descending channel and retest.
Cup and handle pattern.
Key level as support.
Good Risk Reward
I'll also add if today's candle closes bullish.
The possible targets are 10c and 14c.
Good luck,

VeChain (VET) - April 11hello?
Traders, welcome.
If you "follow", you can always get new information quickly.
Please also click "Like".
Have a nice day.
-------------------------------------
(VETUSDT 1W Chart)
Support: 0.06032-0.07967
If it falls from the support zone, there is a possibility of entering the mid- to long-term investment area, so careful trading is required.
(buy)
- After confirming the support near 0.07967
(Stop Loss)
- When it falls below 0.06032 and receives resistance
(Sell)
- When receiving resistance near 0.11838
- When resistance is received in the range 0.15708-0.17643
There is a possibility that it will swing up and down in the 0.09134-0.10130 section, so you need to trade carefully.
A move towards the 0.11838 level is expected to lead to a surge.
------------------------------------------------------------ -------------------------------------------
** All indicators are lagging indicators.
Therefore, it is important to be aware that the indicator will move accordingly as price and volume move.
However, for convenience, we are talking in reverse for the interpretation of the indicator.
** The MRHAB-O and MRHAB-B indicators used in the chart are indicators of our channel that have not been released yet.
(Since it was not disclosed, you can use this chart without any restrictions by sharing this chart and copying and pasting the indicators.)
** The wRSI_SR indicator is an indicator created by adding settings and options to the existing Stochastic RSI indicator.
Therefore, the interpretation is the same as the traditional Stochastic RSI indicator. (K, D line -> R, S line)
** The OBV indicator was re-created by applying a formula to the DepthHouse Trading indicator, an indicator disclosed by oh92. (Thanks for this.)
** Support or resistance is based on the closing price of the 1D chart.
** All descriptions are for reference only and do not guarantee a profit or loss in investment.
(Short-term Stop Loss can be said to be a point where profit and loss can be preserved or additional entry can be made through split trading. It is a short-term investment perspective.)
---------------------------------

#VETUSDT At big support.Vet/usdt at big support expect some uptrend from tomorrow. My level of taking profit is set at 0.09$. Long the dip at support prices of 0.065$. Currently I'm 5x long. Also manage your risk.
#vet #vechain #usdt #btc

VETUSDT / D1A good trend is taking shape. It has been 8 months since a flag pattern was made in the middle of the process, and after completing this pattern, it can grow to the size of a flag handle and have a return of 1000 to 2000 percent. The next 1 year is very important for this digital currency

VET/USDT 43% Up from our entry and still Upward Potential#VET/USDT TA Update:-
$VET currently trading at $0.07
And went upto $0.090
#VET Gave almost 43% fromOur entry.
Hope you followed and enjoyed.
Now..?
Now Trading at support level $0.069
And If hold then we can see $0.123 Next Target.
Otherwise Good Re-Entry entry around $0.05
Support:- $0.05
Resistance:- $0.123

VETSalaam
VET makes a rising wedge in 1h below the 0.072 ky level.
The targets are 0.065, and 0.057.
Manage the risk,
Good luck
