VET/USDT 1HOUR UPDATE BY CRYPTOSANDERSWelcome to this quick VET/USDT analysis.
I have tried my best to bring the best possible outcome in this chart.
Reason of trade:- VET/USDT is a bullish falling wedge pattern conform and retest and buy the green zone
Entry:-CMP and green zone
Traget:-25% to 30%
Stoploss:- $0.04600
Remember:-This is not a piece of financial advice. All investment made by me is under my own risk and I am held responsible for my own profit and losses. So, do your own research before investing in this trade.
Happy trading.
Sorry for my English it is not my native language.
Do hit the like button if you like it and share your charts in the comments section.
Thank you...
VETUSDT trade ideas

Falling wedge on the Weekly VECHAINWe have this beautiful falling wedge on the weekly chart.
As we all know Vechain has great fundamentals but the price is falling like rain, but i think we are at the bottom, because of this falling wedge on the weekly.
I have missed the train and bull run for vechain and now i am happy to have this opportunity to buy that great project so cheap.
The price target should be at the top of the wedge which is 25 cents but i think we can go way above that if the bitcoin goes up which i think it will.
What do you think about this falling wedge?
Feel free to leave a comment.
If you like my ideas please follow me and like the post because i am posting every day and you can find always something interesting on my profile, i am new to Treadingview but i have 6 years expirience in trading.
VET TO THE MOON!

INVERSE:head & shoulderCould this be a potential inverse head and shoulders on the breakout of the short-term downtrend? Maybe time for a swing play or two?

🆓VeChain (VET) Feb-26 #VET $VET
VET is still holding the $0.045 zone in the past few days, if it doesn't lose this zone, in the near future VET can rebound strongly to the $0.065 zone.
📈RED PLAN
♻️Condition : If 1-Day closes ABOVE 0.045$ zone
🔴Buy : 0.045
🔴Sell : 0.055 - 0.065
📉BLUE PLAN
♻️Condition : If 1-Day closes BELOW 0.045$ zone
🔵Sell : 0.045
🔵Buy : 0.04 - 0.035
❓Details
🚫Stoploss for Long : 10%
🚫Stoploss for Short : 5%
📈Red Arrow : Main Direction as RED PLAN
📉Blue Arrow : Back-Up Direction as BLUE PLAN
🟩Green zone : Support zone as BUY section
🟥Red zone : Resistance zone as SELL section

VETUSDT- Trading oppotunityThere is a trading opportunity for Long in the VETUSDT and you can long now according our trading setup.
We hope it is profitable for you ❤️
📊 VETUSDT
🔵 Long Now 0.04650
🧯 Stop loss 0.04285
🏹 Target 1 0.04970
🏹 Target 2 0.05650
🏹 Target 3 0.06800
💸Capital : 1%
Please support our activity with your likes 👍 and comments 📝


VETUSDT Buy timeHello traders!
We can see a channel breakout but it looks like the market is forming a reversal pattern after a breakout. It will push up to form new Higher highs.
Stoploss 0.04588(-1.8%)
Target 0.04905(+5%)
Suggested leverage is 10x
Don't forget to hit the like button and follow to stay connected.

VETUSDT - A move up to $0.049XXHi,
This is iJustCoin, the one lucky trader who puts money where his mouth is!
We have a nice opportunity for a high timeframe SCALPING trade on VETUSDT .
Based on the indicators we are having White/Aqua Lower as our support and Yellow Basis/White Upper as resistance.
Based on that data i am executing a LONG trade:
SL: $0.04266
Entry 1: $0.046XX
Entry 2: $0.045XX
Take Profit 1: $0.04989
Take Profit 2: $0.04788
If you didn't click Like - you should do that right now.
Feel free to ask me any question related to the idea in the comment section - i'll be glad to reply.
And make sure you smashed that SUBSCRIBE button!
Bye-bye!
Good Luck!
***
Chart Code:
Blue Bold Dotted Line - Decreasing of Selling Volume
Purple Bold Dotted Line - Decreasing of Buying Volume
Green Bold Dotted Line - Increasing of Buying Volume
Red Bold Dotted Line - Increasing of Selling Volume
Red Dashed Lines - Downwards Reversal Momentum
Green Dashed Lines - Upwards Reversal Momentum
Green Rectangle - Buying Area
Red Rectangle - Selling Area
Yellow Dotted Lines - Estimate Timerange of the price target might be getting hit
***

Vechain Will Have The Next Big Pump Cycle From Here. 0.1 TargetWe are at the end of the bear cycle for Vechain.
Support at 0.51 looks promosing. Keeping a SL at 0.49 should be a good opportunity to go long.

VETUSDT is testing an important supportThe price is testing an important support at 0.05$. if you check on the left you can see how the price respected that area, it means that this area is very strong.
The seller's pressure is strong, and if the price is going to lose the support we could see a new retest of 0.046$
How to approach?
IF the price is going to lose the support and retest as new resistance, According to Plancton's strategy , we can set a nice order
Don't forget, a simple breakdown is not enough
–––––
Keep in mind.
🟣 Purple structure -> Monthly structure.
🔴 Red structure -> Weekly structure.
🔵 Blue structure -> Daily structure.
🟡 Yellow structure -> 4h structure.
–––––
Follow the Shrimp 🦐

VETSalaam
I bought here at the support line.
and because of the good risk-reward ratio.
Let's see if it could hold this time or not!
Good luck!

VETSalaam
good entry IMO.
but 1h candle should return back above the channel.
close below the support also invalidate the setup.
Good luck

VET USDTVET good chart to make butterfly pattern and falling wedge. you can open long at good moment

VETSalaam
The total crypto market doesn't seem good at all!
VET broke important key levels clearly and most probably going to test the next support.
I open a short position below the level at about 0.05
Manage your risks and don't fear to close trades in loss!
If you are sure about breaking a level!

Update For VET/USDT Analysis 📈📉What's up guys !?
In the Last time that I had an analysis for vet/usdt it exactly hitted all of my Tps and even went beyound(<600%💰)
But actually i expected more growth for vet !
anyway so lets go a little bit deeper now
-----------------------------------------------------------------------------------------------------------------------
📈📉 TECNICAL ANALYSIS
As you can see on the weekly timeframe for pair of VETUSDT , Its trading about $0.052 right now .
since ATH ,VET has been declining in a descending channel , and as we can see ,
already lost an important key levels as support which is now pivot range .
so in this situation of crypto market it can go down more likely ,
and drop to the next supports and Fibo levels respectively even
to the bottom of channel on demand zone.but otherwise if it be able to jump
above the pivot zone and be closed with enough volume as confirmation it can reach
the red resistance zone in this case and then if it be able to break out the descending channel it can reach tps
🛑resistance level: 0.084$-0.094$/ 0.111$-0.123$ /trendline of channel
❇️support level: $(0.25-0.3) / fibo levels 0.0396///0.019-0.028
--------------------------------------------------------------------------------------------------------------------
👉This analysis is my personal opinion ,not a financial advice ,so do your own research.
💜 if you're a fan of my analyses PLZ follow me and give a big thumbs 👍 OR drop comment 🗯💭
🙏with Best Regards

Sniper entry en VET , éducationnal onlyKeep it simple and follow the institutionnal move , they don't use trendline or any indicator . ONLY Liquidity Chase = SL retail trader

VETSalaam
Good day
VET makes a descending channel that is also considered a bull flag or reversal sign.
now VET broke the rising wedge that coincidence to the channel resistance and returned.
I focus on the 0.05 area which is a long-term's key level and target of the rising wedge.
Do your analysis first before entering any trade.
You should have enough confidence to hold a trade open!
Good luck!

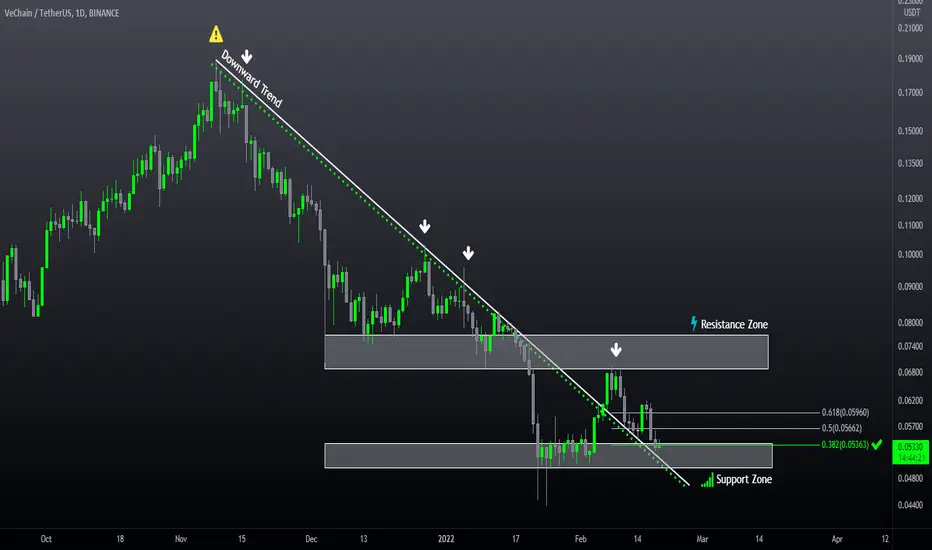
VECHAIN DAILY ANALYSIS🟢 #VET has broken the bearish trend line and is maintaining this range and re-testing the trend line. Price has reacted positively to the 0.382 Fibonacci level and is expected to be moving towards the resistance shown in the chart. Otherwise, the process will fall to the support level and it will be decided again to continue the process. Use the appropriate loss limit for your trades, which has a very high possibility of emotional movement in the market.
⚠ This Analysis will be updated.
🟢Amir Hossein
📅 02.19.2022
⚠️ (DYOR)
VETUSDT - A run up to $0.7XXX levelHi,
This is iJustCoin, the one lucky trader who puts money where his mouth is!
According to the indicators VETUSDT may run up to $0.072 - $0.078 price range.
The upward momentum is happening now.
I expect the price to reach the target about 22 - 28 February.
You will find the rest details in the video.
If you didn't click Like - you should do that right now.
Feel free to ask me any question related to the idea in the comment section - i'll be glad to reply.
And make sure you smashed that SUBSCRIBE button!
Bye-bye!
Good Luck!
***
Chart Code:
Blue Bold Dotted Line - Decreasing of Selling Volume
Purple Bold Dotted Line - Decreasing of Buying Volume
Green Bold Dotted Line - Increasing of Buying Volume
Red Bold Dotted Line - Increasing of Selling Volume
Red Dashed Lines - Downwards Reversal Momentum
Green Dashed Lines - Upwards Reversal Momentum
Green Rectangle - Buying Area
Red Rectangle - Selling Area
Yellow Dotted Lines - Estimate Timerange of the price target might be getting hit
***

VECHAINHello mates, Vechain price analysis shows a strong uptrend in the last 24 hours. The price is approaching the resistance of $ 0.061 with its upward movement. Although the market direction is declining, this coin is growing. Today, the price has decreased slightly, and its trading volume has exceeded $ 243599616. This digital currency is in the 41st position among the top 100 coins, and its market value is 3861240184 dollars.
In daily timeframes, the market is squeezing as volatility has decreased. This means that the probability of price change is directly related to the direction of fluctuation. Less volatility means a lower probability of price change in either direction.
The Bollinger Bands are at $ 0.067 as the strongest resistance, and the Bottom Bands are at $ 0.048 as the strongest support.
The price of Vichin has reached below the moving average, which shows a downward trend. In addition, the price is moving upwards, which indicates the possibility of a bullish momentum recovery.
The RSI is at level 47, which indicates market stability. The downward movement of this indicator indicates a gradual decline in the market and the oversupply of sales activities over the number of purchases.
Conclusion:
Price analysis shows that this digital currency has momentum downtrends and uptrends. Although the bears have gained relative control, buyers have shown positive signs, and the situation is likely to change.

VETVET broke below yhe support and trendline too but ended being pushed up as #BTC plays it move. Now price reached the good resistance zone around $0.061 - $0.062 where price may reject or start a new range between these zones.

VETSalaam
We have broken rising wedge just below the resistance but not falling enough?!
I think it may top off the last local high and then begin falling.
It could be a good idea to scale out your longs.
Note that this is only a possible scenario and there is no certainty.
Good luck,

VET/USDT 2 HOURS UPDATE Welcome to this quick Update, everyone.
If you are reading my updates for the first time do follow me to get more complex charts in a very simplified way.
I also post altcoin setups on Spot, Margin, and Futures.
I have tried my best to bring the best possible outcome in this chart.
VET/USDT broker out the bullish falling wedge pattern and retesting it.
Entry: CMP and upside the 21 ma
Targets 20% TO 25%
Stop Loss: $0.053
What's your thought on this?
Do hit the like button if you like this update and share your views in the comment section.
Thank you
#PEACE
