$ABBV 4HR Update, Looking StorngThe trend is your friend here, looks strong and increased institutional ownership. Has open gap, strong momentum. On the radar
ABBV trade ideas

Time Triggered Alert There might be a better way to do this but...
I wanted to be reminded to check a stock on a certain day, and couldn't figure out how!
Let me explain.
While doing research on VALUE stocks... Fundamentally Underpriced equities. i.e. Not TSLA! :D
ABBV caught my attention...
A quick review, showed that it has earnings coming up on Monday the 29th of March.
Further analysis revealed that more often than not, the stock dropped into the release then rose after.
As such, I want to be reminded to check ABBV on the 22nd of March.
(The Thursday before the Monday earnings announcement!)
The available alerts are all price movement alerts, and not a simple:
CHECK ABBV @ 9am 210322
Trend Line Alerts however are a thing!
Made a vertical line on date to be reminded
Right Click on Line - Set Trend Line Alert
Alert when Crossing Trendline (Reminder message optional)
Disclaimer: I am not even sure this will do what I hope... Guess I will find out on the 22nd!
If there is an easier way to do Time Based Alerts ;) Please let me know in the comments!


ABBV - BUY AND MAKE PROFITABBV - A stock worth buying the next time I bought it.
Everything is in favor of this stock, from the charts, the business plan, the accounting sheet and the hedge funds that bought it.
Good luck with ABBV.


**TA Practice**Keeping an eye on ABBV. Riding a massive rising wedge into all-time highs. From what I understand, rising wedges are a bearish formation. I am being even more cautious with the possibility of a potential rising wedge into a double top at all-time high psychological resistance.

ABBV Rebound WaveABBV has recently had a higher low and now remounted over the moving averages showing bullishness again. I suspect this will make a slightly higher high to the 112 area.

$ABBV HAS BEEN CONSOLIDATING AND SHOULD POP SOONI've been focusing on abbv for awhile now, but abbv has been consolidating and should b popping this week of February 22, 2021

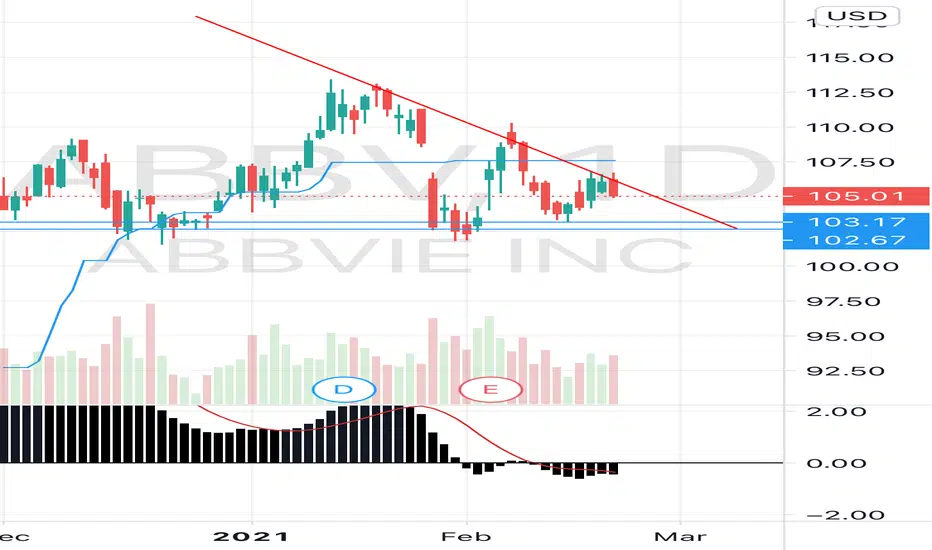
Wedge breakout soon?Looking for a drop the the lower blue horizontal line 102 - 103 and possibly and quick power break through.


ABBV Swing IdeaARK fund just bought this today. Potential breakout over short term descending resistance for its next leg up.


$ABBV has strong potential to run north this week.What I like here, is the bullish price action. You can see the buying pressure ends in the last 2 candles, where it seems to have found support at that 103.74 level. Of course this stock still has a bit of resistance to break through with the 50, 21, & 9 day EMA, I do like the pattern on the daily TF which is forming a double bottom, also another bullish indicator. & Although this will be the 2nd test of that trend line, I like that its at the Bottom of the daily trend line and the postures of oscillators the RSI and seems to have a slight bullish posture which is showing strong upside potential however that stochastic is in a bullish/neutral position. Last time price on this stock fell below the 50 EMA on the daily TF it ran for 8.13%. With likelihood of positive news in the health sector which can serve as a catalyst, its possible to see this one on the moon.


$ABBV with a bullish outlook following its earnings #BeststocksThe PEAD projected a slight bullish outlook for $ABBV after a positive under reaction following its earnings release placing the stock in drift A
If you would like to see the Drift for another stock please message us. Also click on the Like Button if this was useful and follow us or join us.

$108 By Wednesday Resistance is being tested as shown by the Kurotoga Cloud. RSI is a low 37.01 indicating that the stock is under bought ahead of earnings.
MACD shows weakening bullish divergence on the 45min candlestick chart, but the 3x confirm shows room for growth.
This is another publication where technicals are thrown out the window due to earnings, but with ABBV being a big pharma company and a history of beating earnings, I feel comfortable with my call for $104 by the end of February.
With an earnings beat, expect to see the stock price hit a minimum of $108 by Wednesday and possibly $112 by the end of the week based off of previous candlestick trends.


ABBV ENTRY LEVELS LONGABBV is on the KEY SUPPORT. If we break it, we are going lower.
ENTRY LEVELS LONG:
$101.95 BE AWARE
$95.91
$91.82
$82.47 STRONG BUY

A Lot To Analyze There is a lot to this chart and I decided to go super long on ABBV as I saw a buy in opportunity on the 45min chart. However let us look at the daily chart for long term growth.
Some indicators are in our favor and some are against. Let us focus on the indicators and not the trend lines.
MACD shows what may be our peak bear strength which means the bears will run out of gas and the bulls will start fo have control again bringing the stock price up.
RSI is a low 47.71 where ABBV usually runs in the 50s. This means investors can see ABBV as a good buying opportunity as it is underbought.
Guth 3x confirm initiated a strong and very accurate sell signal but if you look at the green line you can see the price is near bottom while the red line ( volume ) is still high meaning price should stay steady.
Earnings are less than a week away and I believe ABBV will do well being a pharmaceutical company in times like today. I do not believe earnings will have much of an impact on stock price.

ABBV Wave 5 Continuation Breakout level for wave 5 is $112.70. Wave 4 held the 0.382 level for a shallow retracement.

