DisciplineNASDAQ:AKAM and NYSE:THO I took three weeks ago.
I have checked my signals in thinkorswim every morning diligently at 10:00am. That's my job. I have not found a single trade that fit my rules to take bullish since September 17th! My two that I took on that date were NASDAQ:AKAM and NYSE:THO . AKAM and THO both pulled a 3:1 on 75% of my positions, AKAM's remainder I closed when it got below a key level, THO continues to run.
Every day that I do not find an opportunity comes with a little bit of trepidation. "Is thinkorswim's scanner code broken this morning?" "Has the strategy lost some edge?" OR... "Is my strategy just performing as intended and keeping my trades long and short in sync with the market?" I like to believe the latter and based on the timing of the two longs I did take it did help me capture this last bullish run up to resistance on the AMEX:SPY and market as a whole.
So I wait... and reserve my capital for OPPORTUNITY and FOLLOW MY RULES!
AKAM trade ideas

DAILY ANALYSI OF AKAMAI TECHNOLOGIES Hi friends
the daily chart of this market shows that it will experience with a high probability an uptrend in the coming days but also we must be vigilant of the change of direction towards the opposite
please subscribe to receive more analysis

TARI CONDORHi guys!
According to Tari Condor strategy I set an iron condor with 3 weeks exp and 10% Strike.
The short put is @100, and the short call @122.
With a 78% of success our Reward/Risk is (100-78)/78 = 22/78 = 0.28
I'm in the trade with 1$ spread ( long put@99 and lon call@123), colletting 0.30$
Max win= 30$
Max loss= 70$
RR= 30/70 = 0.42 much higher than 0.28
This is a good edge!
Enjoy your wallet!

AKAM breaking outIBD composite rating: 98
IBD RS rating 81
Broke out on Friday in more than double volume
Long @ 117.06

AKAM: Trading inside the big patternTrading inside the big pattern
Please don't forget to FOLLOW , LIKE and COMMENT ...
If you like my analysis:)
Thank you and Good Luck!


daily analysis of AKAMAI TECHNOLOGIES Hi friends
the daily chart of this market shows that it will experience an uptrend in the next few days but it is better to be vigilant of the change of this market towards the opposite direction
please subscribe to receive more analyzes


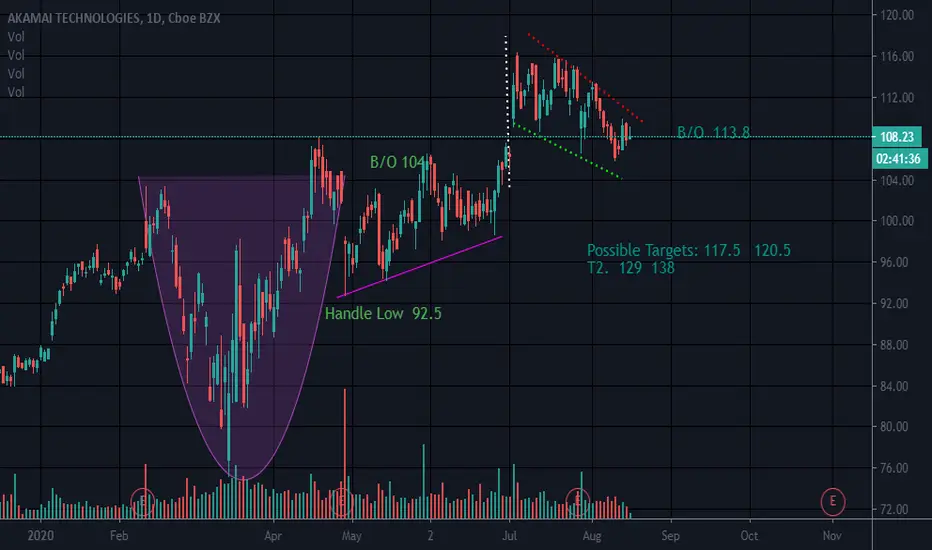
Cup and Handle345.5 is all time high if you look back to 1999
See a cup and handle pattern
Earnings 7-28
Im looking at this one longer term
Not a recommendation


Akamai Technologies... about to breakout to new highsRisk/reward is very attractive. Stops could be tight.


AKAMAI TECHNOLOGIES CHARTHey people, AKAMAI TECHNOLOGIES is on a bullish slant, bullish exit which is confirmed but it may be that its fall given the large number of purchase volume traded.
Please LIKE & FOLLOW, thank you!


Excelente entrada en Akam!! Canal ascendente para buscar nuevos precios. (ajustar stop loss por si el mercado juega en contra.

AKAM BounceAKAM has been consolidating in a pennant range. It has recently seen a low in that range. Looking for a bounce upward here back to the top of range to the $106 area.

AKAM is in uptrend and our system showed a buy trigger signalIt is in uptrend and a buy trigger was showed.

AKAM - Ascending Triangle Today I am going to discuss Akamai Technologies (AKAM). AKAM has had a great recovery since the COVID Pandemic, reaching prices higher than pre-pandemic.
However, AKAM seems to be on the verge of a breakthrough. AKAM seems to represent a very familiar pattern in trading: Ascending Triangles.
An ascending triangle is a continuation pattern consisting of a horizontal line (representing the highs) and a rising trendline (representing the lows). Both of these lines form a triangle.
Generally the coming trend follows the trend that preceded the triangle. As AKAM was in an uptrend before, there is good reason that this uptrend will continue after the breakthrough.
The trend lines seem to indicate that we are coming close to the breakout point. However, it does not seem to be within this week, or maybe even the week after. There is still some time before the breakthrough.
However, now is a good time to long. AKAM is currently touching the lower trendline and historically has rebounded the past three times this happened (within the last three months).
Furthermore, if the triangle were to turn into a downtrend (a possible yet unlikely situation), then buying at a low can help counter any sudden drops after AKAM rebounds up to touch the horizontal line (an approximately 7% gain). This can offset any unforeseen losses.
Please let me know if you have any feedback or if there is anything I missed out. I appreciate the feedback.


Long Idea Monthly13/Jan/2020 08:08 PM AUTHOR: Brandon Gum
--
No position.
Wide stop below $76. 1% of acct at risk once RSI trendline is breached and closes above on the monthly.
======================

