VZ: Verizon stock update after earningsVerizon jumped on positive results, which aligned with my bullish view on it.
Tomorrow will have its competitors T-Mobile & AT&T earnings result, this will update us on the industry as well. Most probably that I will go long on it in the next 24Hr.
Disclaimer: This content is NOT a financial advise,
Next report date
—
Report period
—
EPS estimate
—
Revenue estimate
—
13.70 EUR
4.51 B EUR
61.93 B EUR
263.40 M
About Allstate Corporation (The)
Sector
Industry
CEO
Thomas Joseph Wilson
Website
Headquarters
Northbrook
Founded
1931
FIGI
BBG011RJBT27
The Allstate Corp. engages in the property and casualty insurance business and the provision of protection solutions. It operates through the following segments: Allstate Protection, Protection Services, Allstate Health and Benefits, Run-off Property-Liability, and Corporate and Other. The Allstate Protection segment offers private passenger auto, homeowners, other personal lines, and commercial insurance marketed under the Allstate, National General, and Answer Financial brand names. The Protection Services segment provides a range of solutions and services that expand and enhance customer value propositions including Allstate Protection Plans, Allstate Dealer Services, Allstate Roadside, Arity, and Allstate Identity Protection. The Allstate Health and Benefits segment focuses on voluntary benefits and individual life and health products, including life, accident, critical illness, short term disability, and other health insurance products sold through independent agents, benefit brokers, and Allstate exclusive agencies. The Run-off Property-Liability segment relates to property and casualty insurance policies with exposure to asbestos, environmental, and other claims in run-off. The Corporate and Other segment is involved in debt service, holding company activities, and certain non-insurance operations. The company was founded on April 17, 1931 and is headquartered in Northbrook, IL.
Related stocks

ALL AnalysisALL has shown a strong support around 103-106 range. Neckline is around the 116-119 consolidation range. RSI showing a consistent patter also for these levels on the weekly chart. Past RSI oversold 7 times in 7 years almost once every year except 2022.
Anticipating a retest to the 103 area if we fal

$ALL with a neutral outlook following its earnings #Stocks The PEAD projected a Neutral outlook for $ALL after a Negative over reaction following its earnings release placing the stock in drift C with an expected accuracy of 75%.

MTCH - Swing TradeR/R trend with 3 propulsion dots.
Vscore = -1 resistance and RAF is at lower extreme.
Prices hit 21 propulsion today - could've entered short. Look for entry tomorrow.
Heavy downtrend.

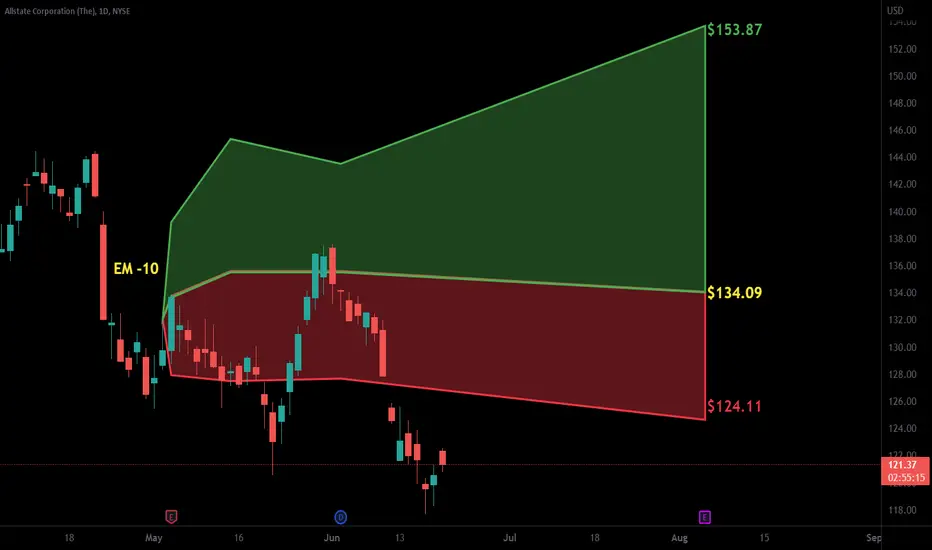
ALL daily bullish hammerALL daily bullish hammer quick countertrend moved stop loss to $125.55 after this day candle weak volume.

ALL - Above Up ChannelPrice has poised itself within an expanding wedge above an up channel that it has successfully broken out of
This is a bullish sign
The breakout can be distinguished by looking at the previous rejections at the top of the green channel ( double top in red)
Bullish

$ALL with a Neutral outlook following its earnings #Stocks The PEAD projected a Neutral outlook for $ALL after a Negative over reaction following its earnings release placing the stock in drift C with an expected accuracy of 100%.
ALL - Trend Line Reclamation Price has moved above the dominant green uptrend which was previously seen as resistance, now support
Price will move up within this up channel I have drawn, continuing the green trend line

Allstate Corporation - 25% Shorting Opportunity?Following the crash in 2008 Allstate has enjoyed explosive rally with circa 800% gains.
Is is over and are we observing a global correction?
Fundamental indicators:
Revenue and Profits - demonstrated consistent long-term earnings growth over the past 10 years
Profit margin - quite low wi

Not So Fast..Allstate Corp. has been on a tear over the past month breaking out of the $127 level and taking the express lane up 15% for the month of March. However the next road block will require alot more strength to move throgh as this will be the 3rd time in a little over a year that we attempt to break thr

See all ideas
Summarizing what the indicators are suggesting.
Neutral
SellBuy
Strong sellStrong buy
Strong sellSellNeutralBuyStrong buy
Neutral
SellBuy
Strong sellStrong buy
Strong sellSellNeutralBuyStrong buy
Neutral
SellBuy
Strong sellStrong buy
Strong sellSellNeutralBuyStrong buy
An aggregate view of professional's ratings.
Neutral
SellBuy
Strong sellStrong buy
Strong sellSellNeutralBuyStrong buy
Neutral
SellBuy
Strong sellStrong buy
Strong sellSellNeutralBuyStrong buy
Neutral
SellBuy
Strong sellStrong buy
Strong sellSellNeutralBuyStrong buy
Displays a symbol's price movements over previous years to identify recurring trends.
ALL4037296
Allstate Corporation 7.52481% 15-AUG-2053Yield to maturity
7.46%
Maturity date
Aug 15, 2053
US20002AU5
ALLSTATE 2067 FLRYield to maturity
6.51%
Maturity date
May 15, 2057
ALL4843255
Allstate Corporation 3.85% 10-AUG-2049Yield to maturity
6.51%
Maturity date
Aug 10, 2049
US20002BC4
ALLSTATE 2046Yield to maturity
6.41%
Maturity date
Dec 15, 2046
ALL.AA
Allstate Corporation 5.2% 15-JAN-2042Yield to maturity
6.25%
Maturity date
Jan 15, 2042
ALL4015209
Allstate Corporation 4.5% 15-JUN-2043Yield to maturity
6.09%
Maturity date
Jun 15, 2043
ALL.GD
Allstate Corporation 6.9% 15-MAY-2038Yield to maturity
5.30%
Maturity date
May 15, 2038
ALL.HX
Allstate Corporation 5.55% 09-MAY-2035Yield to maturity
5.10%
Maturity date
May 9, 2035
ALL.IF
Allstate Corporation 5.95% 01-APR-2036Yield to maturity
5.00%
Maturity date
Apr 1, 2036
ALL5083324
Allstate Corporation 1.45% 15-DEC-2030Yield to maturity
4.98%
Maturity date
Dec 15, 2030
ALL.GS
Allstate Corporation 5.35% 01-JUN-2033Yield to maturity
4.88%
Maturity date
Jun 1, 2033
See all ALLS bonds
Curated watchlists where ALLS is featured.

Frequently Asked Questions
The current price of ALLS is 167.00 EUR — it has increased by 0.30% in the past 24 hours. Watch ALLSTATE CORP stock price performance more closely on the chart.
Depending on the exchange, the stock ticker may vary. For instance, on VIE exchange ALLSTATE CORP stocks are traded under the ticker ALLS.
ALLS stock has risen by 0.39% compared to the previous week, the month change is a −1.24% fall, over the last year ALLSTATE CORP has showed a 4.87% increase.
We've gathered analysts' opinions on ALLSTATE CORP future price: according to them, ALLS price has a max estimate of 243.42 EUR and a min estimate of 160.01 EUR. Watch ALLS chart and read a more detailed ALLSTATE CORP stock forecast: see what analysts think of ALLSTATE CORP and suggest that you do with its stocks.
ALLS reached its all-time high on Dec 2, 2024 with the price of 199.35 EUR, and its all-time low was 90.00 EUR and was reached on Jul 17, 2023. View more price dynamics on ALLS chart.
See other stocks reaching their highest and lowest prices.
See other stocks reaching their highest and lowest prices.
ALLS stock is 1.12% volatile and has beta coefficient of 0.17. Track ALLSTATE CORP stock price on the chart and check out the list of the most volatile stocks — is ALLSTATE CORP there?
Today ALLSTATE CORP has the market capitalization of 44.12 B, it has increased by 1.07% over the last week.
Yes, you can track ALLSTATE CORP financials in yearly and quarterly reports right on TradingView.
ALLSTATE CORP is going to release the next earnings report on Jul 30, 2025. Keep track of upcoming events with our Earnings Calendar.
ALLS earnings for the last quarter are 3.26 EUR per share, whereas the estimation was 2.33 EUR resulting in a 39.98% surprise. The estimated earnings for the next quarter are 2.76 EUR per share. See more details about ALLSTATE CORP earnings.
ALLSTATE CORP revenue for the last quarter amounts to 13.22 B EUR, despite the estimated figure of 12.99 B EUR. In the next quarter, revenue is expected to reach 12.91 B EUR.
ALLS net income for the last quarter is 549.98 M EUR, while the quarter before that showed 1.86 B EUR of net income which accounts for −70.47% change. Track more ALLSTATE CORP financial stats to get the full picture.
Yes, ALLS dividends are paid quarterly. The last dividend per share was 0.88 EUR. As of today, Dividend Yield (TTM)% is 1.96%. Tracking ALLSTATE CORP dividends might help you take more informed decisions.
As of Jul 27, 2025, the company has 55.4 K employees. See our rating of the largest employees — is ALLSTATE CORP on this list?
Like other stocks, ALLS shares are traded on stock exchanges, e.g. Nasdaq, Nyse, Euronext, and the easiest way to buy them is through an online stock broker. To do this, you need to open an account and follow a broker's procedures, then start trading. You can trade ALLSTATE CORP stock right from TradingView charts — choose your broker and connect to your account.
Investing in stocks requires a comprehensive research: you should carefully study all the available data, e.g. company's financials, related news, and its technical analysis. So ALLSTATE CORP technincal analysis shows the sell today, and its 1 week rating is sell. Since market conditions are prone to changes, it's worth looking a bit further into the future — according to the 1 month rating ALLSTATE CORP stock shows the sell signal. See more of ALLSTATE CORP technicals for a more comprehensive analysis.
If you're still not sure, try looking for inspiration in our curated watchlists.
If you're still not sure, try looking for inspiration in our curated watchlists.