VZ: Verizon stock update after earningsVerizon jumped on positive results, which aligned with my bullish view on it.
Tomorrow will have its competitors T-Mobile & AT&T earnings result, this will update us on the industry as well. Most probably that I will go long on it in the next 24Hr.
Disclaimer: This content is NOT a financial advise, it is for educational purpose only.
ALLS trade ideas
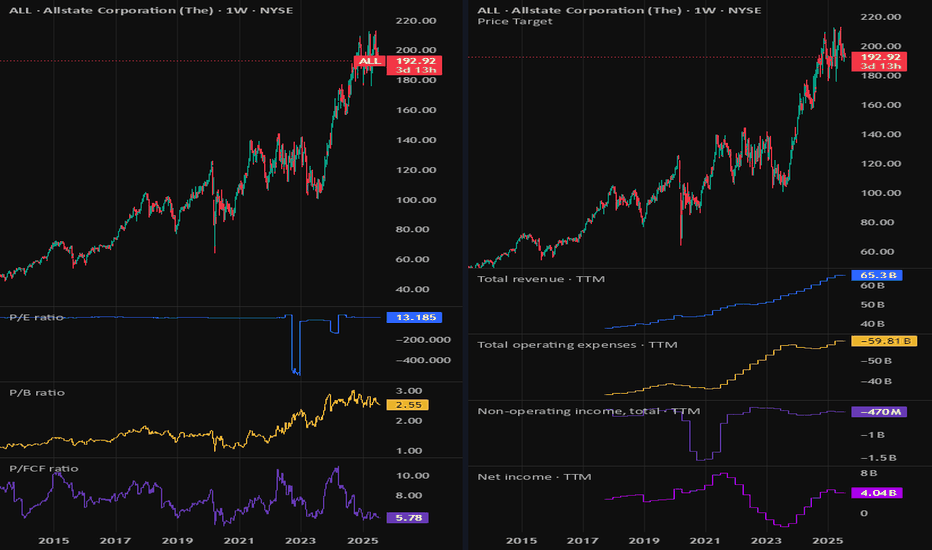
ALL AnalysisALL has shown a strong support around 103-106 range. Neckline is around the 116-119 consolidation range. RSI showing a consistent patter also for these levels on the weekly chart. Past RSI oversold 7 times in 7 years almost once every year except 2022.
Anticipating a retest to the 103 area if we fall back below 107- 105.50. If we get to 115 area we could easily keep moving up consolidation points 115, 119. Above neckline of 119 range we could continue to 128-131.
I am interested in 110-115 call dating out August 18th and so forth if we hold a consistent support.
Thoughts?
Allstate Corporation - 25% Shorting Opportunity?Following the crash in 2008 Allstate has enjoyed explosive rally with circa 800% gains.
Is is over and are we observing a global correction?
Fundamental indicators:
Revenue and Profits - demonstrated consistent long-term earnings growth over the past 10 years
Profit margin - quite low with 7% margin
P/E - good value with 10x ratio
Liabilities - debt to equity is considered to be high with 3.19
Technical Analysis (Elliott Waves):
Since 2008 fall we can observe a rapid impulse like movement with waves 1-2 completing in October 2011 followed by a clear wave 3 culminating in February 2020
A sharp drop in 2020 has created a first wave of a global correction in wave 4 which is currently taking shape of a Running Flat
It is likely that the high of April 2022 has completed wave B of a zigzag and since then wave 1 and 2 have already been formed in the upcoming impulse of wave C
The target of wave C and is in the range of $90-$95
What do you think about Allstate and its short term prospects?
Also let me know if you would like to see other stocks, indices, Forex or Crypto analysed using Elliott Waves .
Thanks
Not So Fast..Allstate Corp. has been on a tear over the past month breaking out of the $127 level and taking the express lane up 15% for the month of March. However the next road block will require alot more strength to move throgh as this will be the 3rd time in a little over a year that we attempt to break through the $140 level.
If the Relative Strength Index has anything to say about this approach this time around we certainly dont have the strength behind this move that we saw the first time...
The next few days should be telling.
LongThe stock broke through a good resistance zone. I'm considering an approach to the previous high. Possibly a renewal as well. The potential is good, if there will not be overbought on indicators.
❤️ If you find this helpful and want more FREE forecasts in TradingView
. . . . . Please show your support back,
. . . . . . . . Hit the 👍 LIKE button,
. . . . . . . . . . . Drop some feedback below in the comment!
❤️ Your Support is very much 🙏 appreciated!❤️
💎 Want us to help you become a better Stock trader?
Now, It's your turn!
Be sure to leave a comment let us know how do you see this opportunity and forecast.
Possible All State Trade SetupsI'm lookin at two possible All trade setups:
Long Swing Trade:
breakout from descending channel
Position: 7Dec 120 Calls
Entry: ~116
PT1: 120
PT2: 125
Long term Trade:
Holding support at 125 will trigger initial entry and DCA accumulation
Short Swing Trade:
PA back to bottom of channel
Position:
Entry: ~114
Position: 17Dec 110 puts
PT1:110
LONG ALLAt retracement levels for ABC on wave 4. At .236 levels for retracement end wave 2 to top of wave 3. STC is at low end, stoch RSI low end, coming out of squeeze, nearing 55 ema line. You can see the last 2 times RSI was this low with the black arrows it shot up. Taking a long position here, bought at 1.00 retracement level, currently losing a little but will not sell unless it becomes invalidated (below 1.618 retracement).
PT $157.32 (100% of wave 1)
SL $129.12 (invalidated retracement).
ALLSTATES CORP Estimates DailyHey guys, ALLSTATES CORP is in a fake bearish configuration with shadow made buyers and low volume of past sales. On the TIMEFRAME M1 we observed a marubozu with large purchase volume made at the end of the session, it is ready to breakout a balance zone. Strong possibility of recovering the losses of the before session and reaching the top by going on the last previous high. then see the TIMFEFRAME H4 for fit and finish on the H1. And if the buyers are at risk, repeat the same thing on the next point.
Please LIKE & FOLLOW, thank you!


