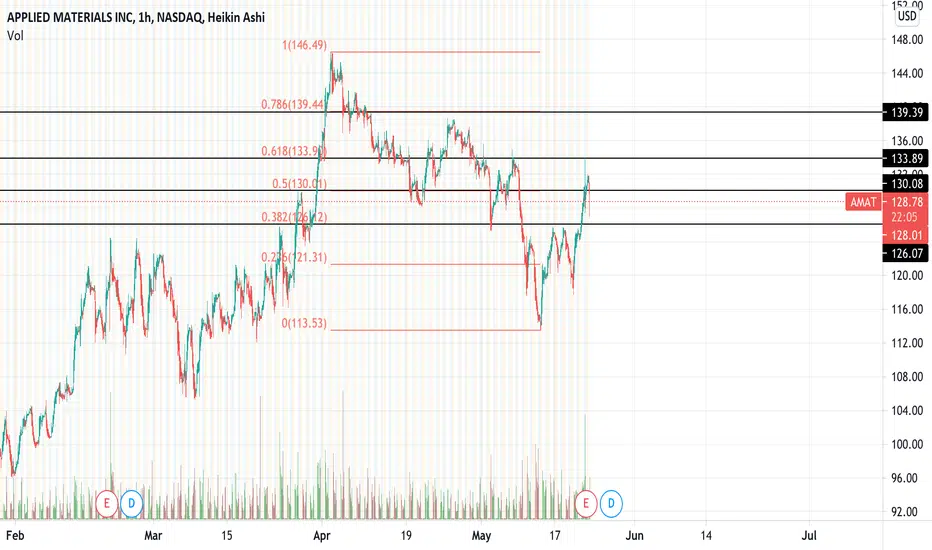
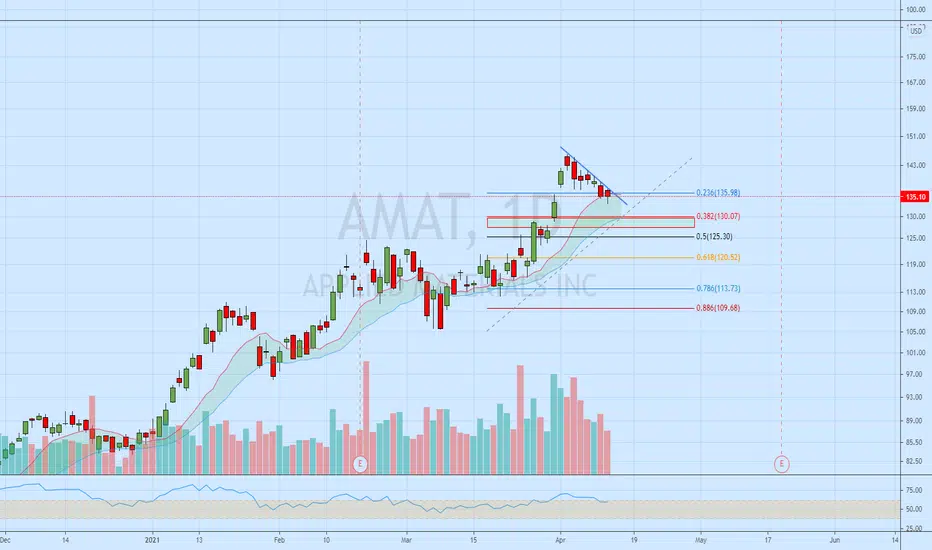
Long $AMAT This is a chart of $AMAT on a 4hr candlestick with a Fib Retracement too and the TradingView "Long Position" tool. As you can see, AMAT has just broken out of a pennant. I would wait for a pullback to the $130 level to add shares. If it goes to $125, I will add to my position. Keeping stops tight due to the uncertainty of this choppy and fearful market, I would set it at about the $121 mark right where a Fib line is. This analysis tells me $AMAT may be $171, which would be my PT level for a very successful trade.
If I were to take a position of 10 shares, I would be adding 7@$130 and then 3@$125, which would be a CBPS of $128.5. If I would then be risking $7.5 per share to potentially make $42.5 per share. I liked what I saw from Applied Material's recent earnings report, I think there is good sentiment around this name, this is a name I would go long on.
AMAT trade ideas


collecting that baggood quarter, scarce product. June 4th $132 calls + shares post earning + x-div 🤙🏽


$AMAT Chart request Clean set up off 89 ema touch (daily), risk reward not there for me w current market conditions+
Guys i do this private clients via video or chart, if they ok it i share(delayed) , even if it helps 1 person, i will try to, 🙏

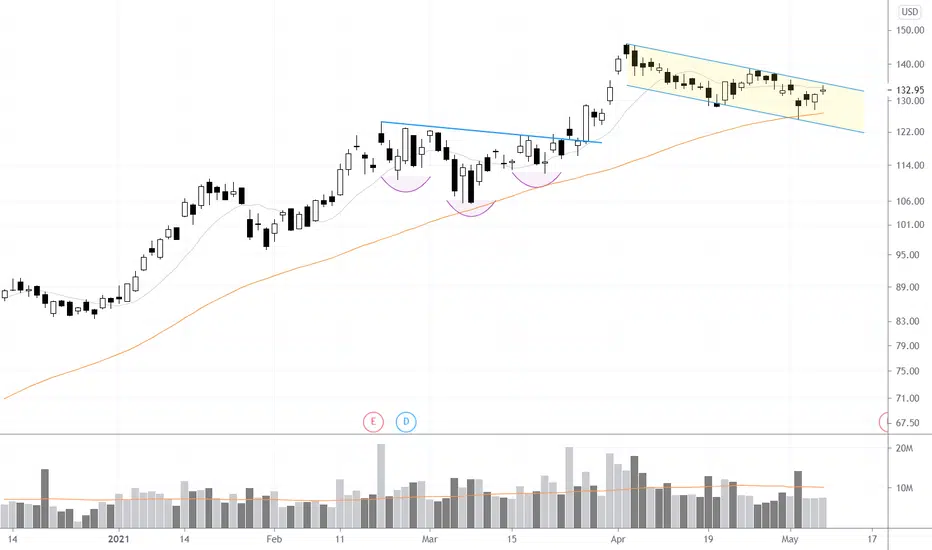
$AMAT Bull Flag SetupAnother semiconductor equipment leader setting up a bull flag trade setup after pulling back to its 50 MA. On focus list for this upcoming week.
Applied Materials Inc (AMAT)- MANUFACTURES DEPOSITION, INSPECTION AND ETCHING/CLEANING EQUIPMENT USED IN IC/FLAT PANEL DISPLAY FABRICATION.


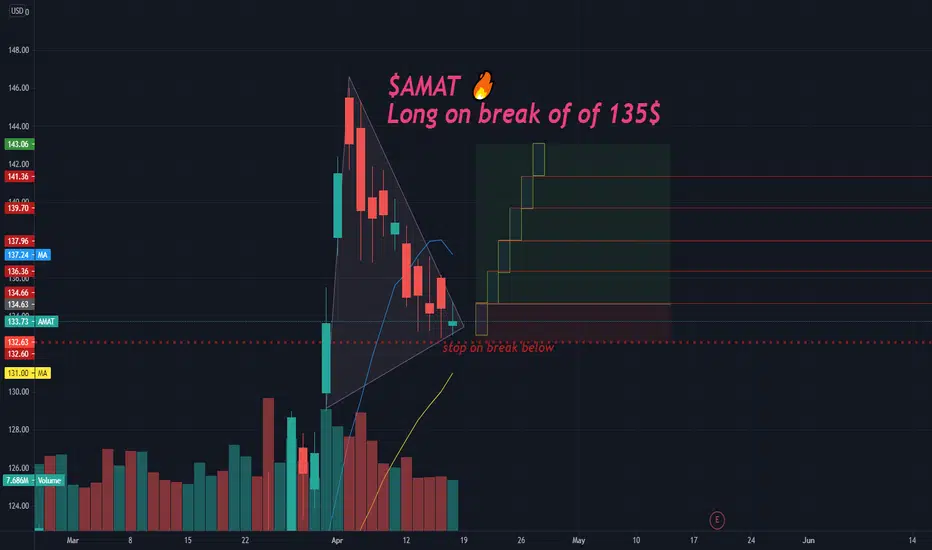
$AMAT Downtrend break w Daily inside bar trigger Buy stop on 135$ break, stop just below low, move stop to break even her and take some on a 4-5$ w volume, if it breaks low first pattern is negated
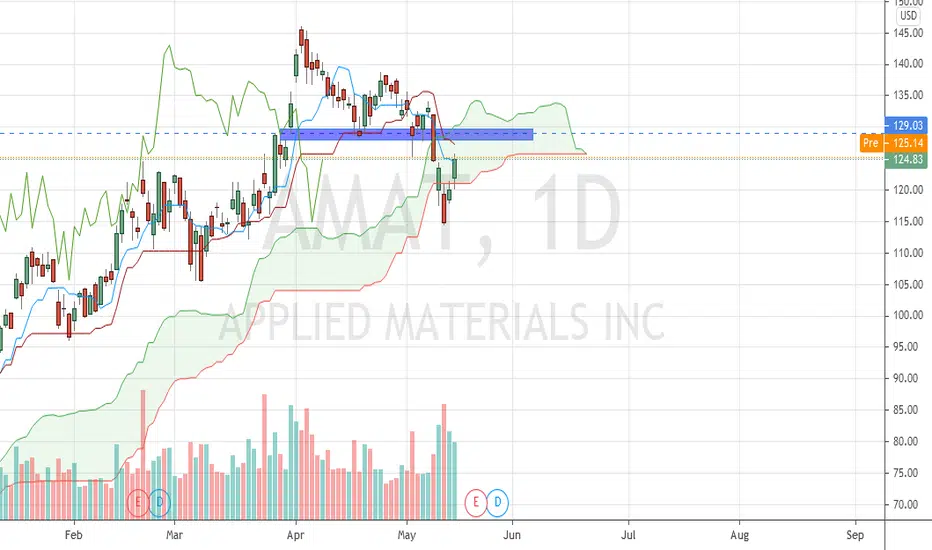
AMAT LongAMAT has been stair-stepping higher in a bull trend lately. In my opinion AMAT has been a leader in one of the stronger industry groups within tech (semiconductor equipment). Yesterday it printed an inverted hammer after failing to make a significant push below the previous low on 4/19. This is the line in the sand. Today it opened near those lows but pushed higher and out of the short-term downtrend on impressive volume. It has consistently found buyers at the 20-day EMA (see arrows) - this area has regularly been a great spot to initiate a long. Today represents a low-risk entry with a stop at the previous day's low (red dotted line).

AMAT LONGSeeing a great upside potential for AMAT,
Rejected many times off the support and just broke out of descending triangle.

AMAT just broke through the decending channel
I've been waiting for this! To the moon, please!
P.S. the Tradingview system thinks the word "channel" is not English... lol

AMAT on watchNice controlled pull back happening. I'd like to get this in the 130 zone for a pre earnings run. Could take off again any day though.
$AMAT is still in an uptrendWho knows when the trend will end.
What we do know AMAT is currently in an uptrend with good low risk entry here.
