AMAT trade ideas


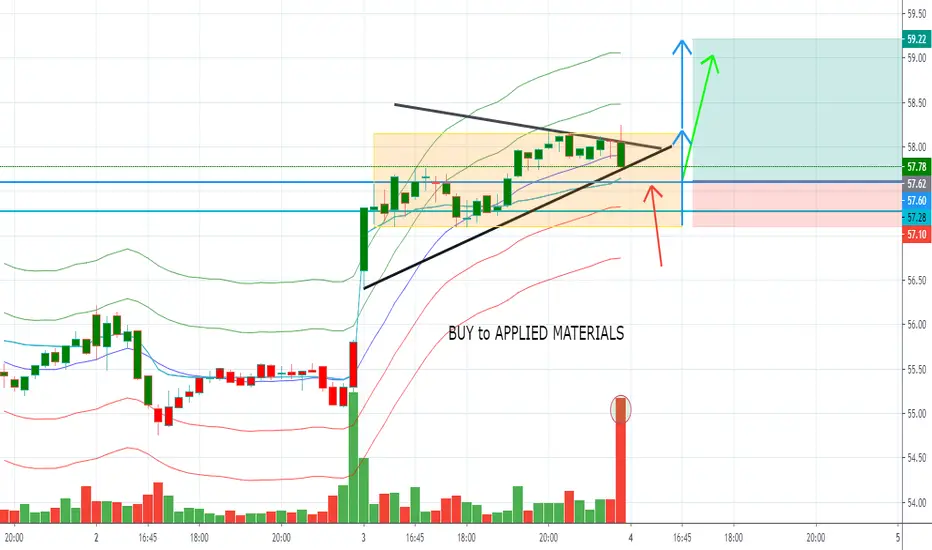
BUY APPLIED MATERIALSHey guys,**DISCLAIMER** content on this analysis is subject to change at any time without notice, and is provided for the sole purpose of assisting traders to make independent investment decisions. APPLIED MATERIALS is at the end of its consolidation and stabilization zone, it can break from the bottom make a pull back to go breakout from its top.
Please LIKE & FOLLOW, thank you!

AMAT doughAnalysis done on 25/05/2020
Fundamental
→ 20 & 40 SMA sloping up
→ 20MA > 40MA
Awaiting buy trigger
→ CCI <-100
→ Low of daily bar touches 20MA or goes below 20MA
→ Close above 40MA
Pull trigger
→ Buy 1 bid above previous day high
→ Sell 5 bars later exclusive of initial bar
Stop Loss
→ 50% below price bought


AMAT: Chip Giant Tries to Clear Bullish TriangleSeveral technology stocks have formed bullish triangles as they consolidate from the last few months’ of volatility. These include Microsoft , Salesforce.com and Mastercard – all playing out to the upside.
Today another appears on the list: Semiconductor-equipment firm Applied Materials .
AMAT has been trapped below its 200-day simple moving average (SMA) since mid-April. It’s also started making higher lows this month, resulting in an ascending triangle with the potential for a breakout to the upside.
The stock is also eclipsing its April highs now. That will likely trigger some alerts for momentum followers.
AMAT reported decent earnings on May 14. Given its central role in the chip space, it’s very much a play on semiconductors overall. If you’re a believer in the industry and not too worried about Trump and the Huawei threat, then you might want to check out AMAT as it attempts to clear this triangle.


$AMAT strong chart for Day or Swing Trading Go !There has been some positive earnings news on AMAT and got some premarket volume on today Friday the 16th. if you look at the daily chart you will see that its respecting the ascending support Trendline (blue). Currently its below the 20 daily EMA it needs to get above it and hold for me to go Long on it. It has open space from the 20 Daily EMA at 47.50 until around 52.50. The market needs to be in favour in order to propel it upwards.


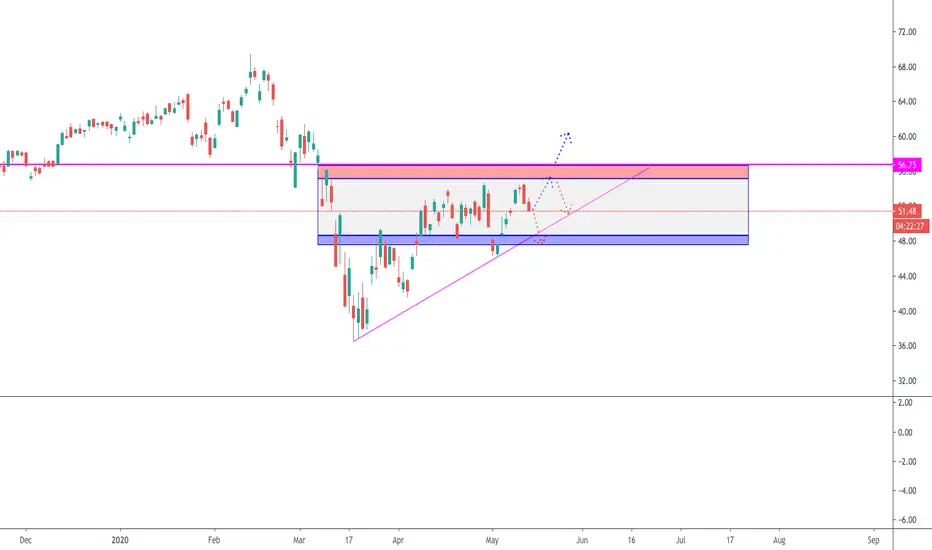
Applied Materials: watching behaviour in the resistence lineAfter the little downtrend from the last days I see a possible entry possition in this stock.
But, I will wait a little bit in order to see how it will bahve in the resistence line.
What do I mean?
If the RSI and Stochastic revert it might indicate that the trend is changing and the price will increase.
Besides, the stock is trading quite below the moving average from the bollinger band (important).
It is also worth to mention that the stock have had performed quite well during 2019 showing a bullish trend (which has been shown with the orange lines).

good report this one for the long runSemi-conductor company Applied Materials makes integrated circuit chips for a wide range of electronics, including TVs, smartphones and flat panel display screens. The $61 billion heavyweight’s robust start to 2020 is a direct continuation of 2019’s stellar performance; last year’s gains of 90% have been boosted by a further 9% year-to-date.
As per expectations, AMAT’s latest earnings results delivered a strong quarter and guidance. F1Q20’s revenue of $4.16 billion indicated a quarter-over-quarter increase of 11% and beat the Street’s estimate of $4.11 billion. At $0.98, EPS came in above the high end of the company's $0.87-0.95 guidance and above the Street’s call for $0.93. Looking ahead, galvanized by a continued robust foundry/logic business and the return of some memory spending, AMAT expects to see "strong double-digit" growth in its semiconductor business this year.


Buy itAMAT has effectively broken out and re-entered it's upward rising channel.
Current target is ~$100 (a 1.618 fib extension from that last downward correction April2018-Jan2019), but that could take until year end.
Elliott Wave pattern is screaming to me that this is a 5 of a 5, so watch out near that $100 target and get your sell limit orders placed beforehand.
Considering buying some calls for 6 months--a year out

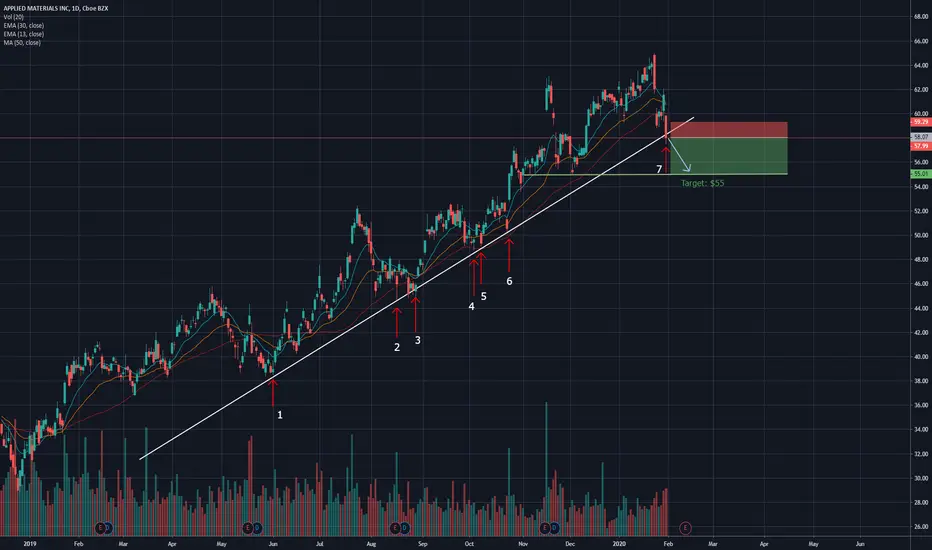
AMAT Breakdown 6+tapsAMAT has now touched its supporting trend line over 6times, the support today has been cracked, leading me to believe there is now downside pressure for a breakdown. Its price is also now under all the moving averages and has had increased sell side volume over the past several days. That paired with the SPY and SMH (semiconducter index) showing bearishness on all the daily, weekly, monthly timeframes... this has room to fall.
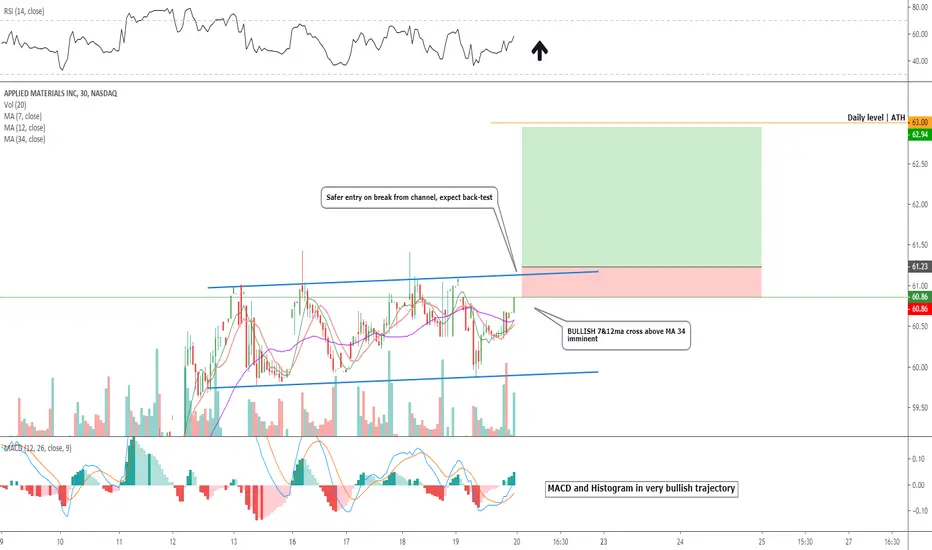
Applied Materials breakout trade $amat Entry level $63.25 ( dependent on the open) - Target price $76.16 = Stop loss $61
We either get a doublke top rejection or a major breakout, given the market strenght and
storn senbtiment in the sector we believes that the odds are a break to the upside is imminent.
Bullish cross of 50 & 100 moving averages.
RSI and Momentum in strong uptrend.
MACD at breakout level.
Needs a day of significant volume to make sustained breakout.

$AMAT Rising Channel or Wedge?I had drawn a rising wedge pattern a few weeks back. Then it broke higher than the wedge and pulled back in. I' asking for feedback from the community as to what we have now. Is it a wedge or channel. and if it's a channel, was that break above the wedge and pullback enough to change the picture?


