AMAT Big resistance above, earnings upcomingLooks bad on Daily, Downtrending RSI, peaked Accumulation, negative 21 day slope, piled on shorts. Much resistance above. Earnings up shortly. It is a good stock, it sits right on an upward sloping 52 week Exponential moving average, so I will buy one day. Now is not the time.
AMAT trade ideas

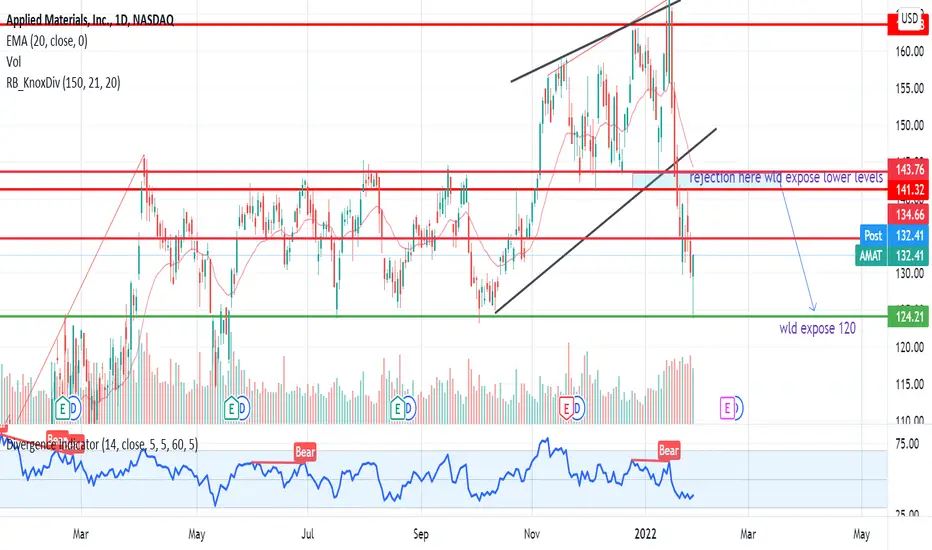
AMAT LONG Amat sell from 165 region met the target at 124. we are lookin to buy amat from 130 given the price action.
stay tuned.
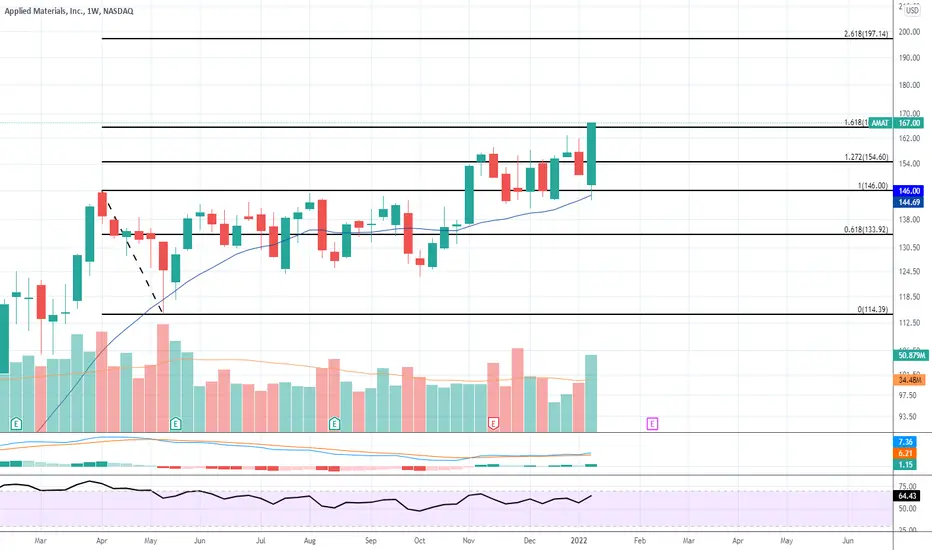
Zooming on Applied Materials. AMATGoing strong on this upgoing zigzag, and it looks like just a little bit more to go to hit our sole (just one) taget here. Never squeeze, rush or get greedy with the market. It is a beast with a mind of its own, and can be more cruel and unforgiving than any human opponent. This entity has no remorse, reason and it does not forgive impatience. Stay safe.
We are not in the business of getting every prediction right, no one ever does and that is not the aim of the game. The Fibonacci targets are highlighted in green with invalidation in red. Fibonacci goals, it is prudent to suggest, are nothing more than mere fractally evident and therefore statistically likely levels that the market will go to. Having said that, the market will always do what it wants and always has a mind of its own. Therefore, none of this is financial advice, so do your own research and rely only on your own analysis. Trading is a true one man sport. Good luck out there and stay safe!


AMAT run short?BM Team:
AMAT runing short?
DV- RSI
DV- MACD
res zone
whats your idea?
note: it can break ,we can buy till pullback.

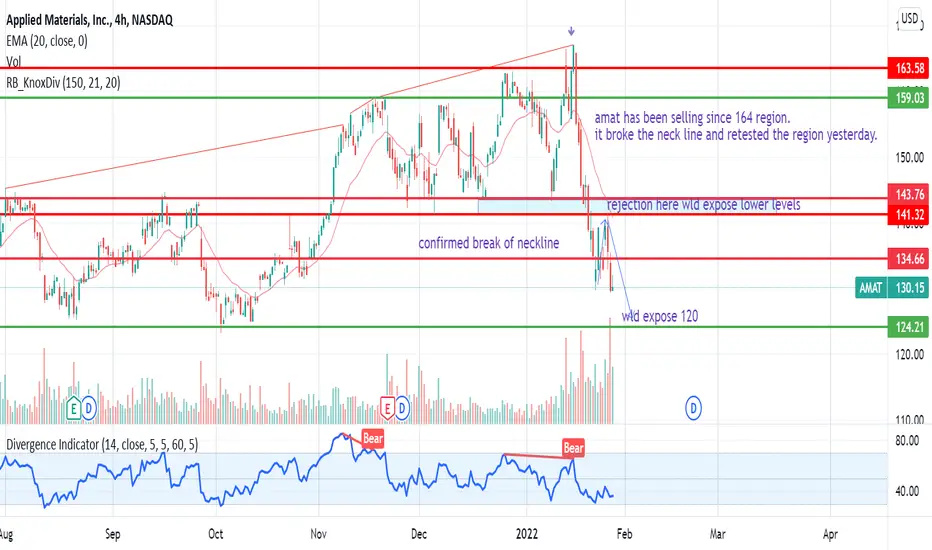
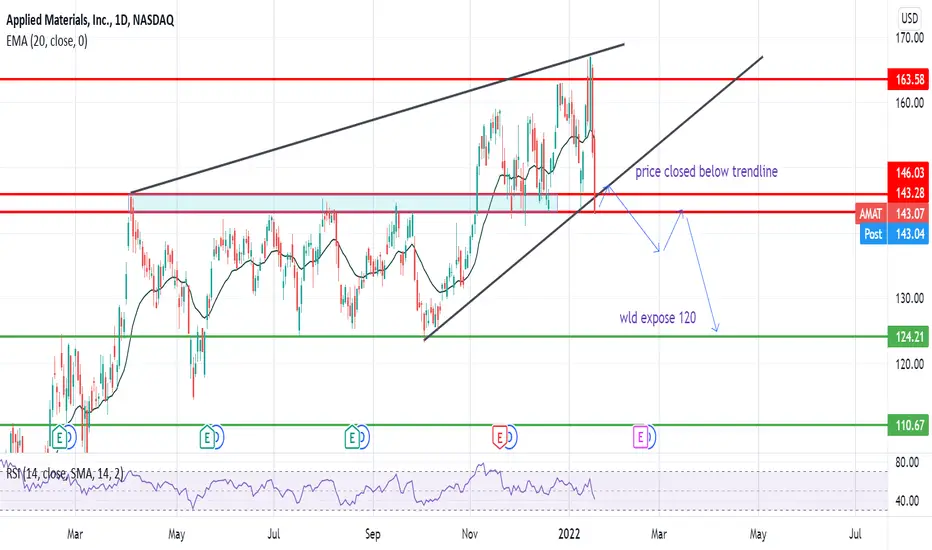
amat update sells onlyAmat broke down nicely as expected. price currently closed below the trendline. on the 4hr tf, price is at the neck line. would expect that to break tomorrow or b4 some time this week all things being equal.

Go to the ATH!After the fall of the index, the stock started to make a good convergence. I'm waiting for a renewal of the high. Upside +10%.
❤️ If you find this helpful and want more FREE forecasts in TradingView
. . . . . Please show your support back,
. . . . . . . . Hit the 👍 LIKE button,
. . . . . . . . . . . Drop some feedback below in the comment!
❤️ Your Support is very much 🙏 appreciated!❤️
💎 Want us to help you become a better Stock trader?
Now, It's your turn!
Be sure to leave a comment let us know how do you see this opportunity and forecast.


1/16/22 AMATApplied Materials, Inc. ( NASDAQ:AMAT )
Sector: Producer Manufacturing (Industrial Machinery)
Market Capitalization: 148.382B
Current Price: $167.00
Breakout price: $167.00
Buy Zone (Top/Bottom Range): $158.80-$152.40
Price Target: $196.20-$199.40 (3rd)
Estimated Duration to Target: 146-150d (3rd)
Contract of Interest: $AMAT 6/17/22 210c
Trade price as of publish date: $4.35/contract

I will be a buyerI will enter a long if the indexes hold green next week. Looks great with a breakout in Wave 3.

$AMAT — SHORTFib .50 and gap fill target to the downside; I just played AMAT calls and sold for +600% so I am trying to double whammy.

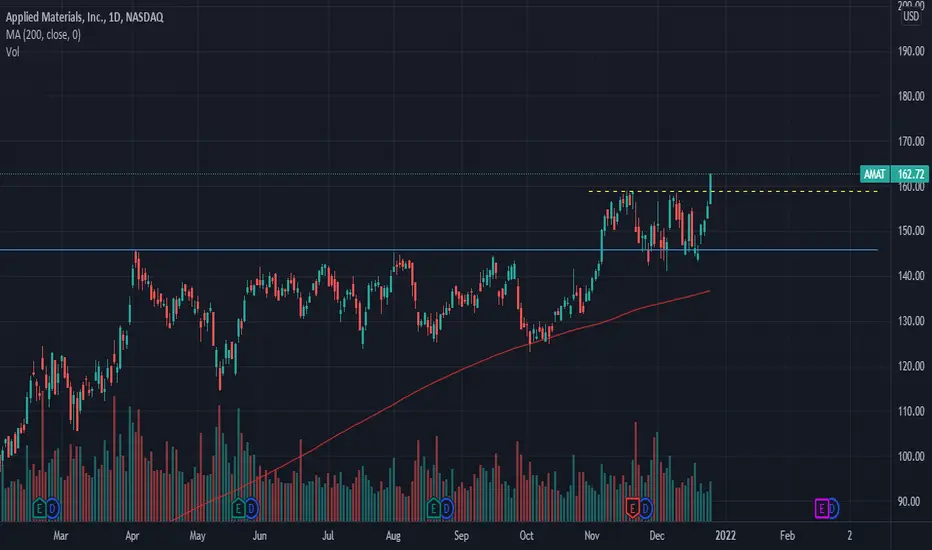
Applied Materials Is Fighting HigherTechnology stocks have struggled this week as interest rates rise. However, the selling has mostly targeted classic “growth stocks” like high-multiple software makers. Some of the more cyclical hardware/equipment names have fared better -- including Applied Materials.
AMAT more than doubled between November 2020 and April 2021. It spent the next half a year consolidating those gains. Prices tested and held their 200-day simple moving average (SMA) in October, followed by a new breakout in early November.
Notice how the stock then came down to test the old highs around $145. Buyers quickly stepped in, turning old resistance into new support.
Next, AMAT has made higher lows along its rising 50-day SMA and is now back above its 21-day exponential moving average (EMA).
TradeStation is a pioneer in the trading industry, providing access to stocks, options, futures and cryptocurrencies. See our Overview for more.
Important Information
TradingView is not affiliated with TradeStation Securities Inc. or its affiliates. TradeStation Securities, Inc., TradeStation Crypto, Inc., and TradeStation Technologies, Inc. are each wholly owned subsidiaries of TradeStation Group, Inc., all operating, and providing products and services, under the TradeStation brand and trademark. When applying for, or purchasing, accounts, subscriptions, products and services, it is important that you know which company you will be dealing with. Please click here for further important information explaining what this means.
This content is for informational and educational purposes only. This is not a recommendation regarding any investment or investment strategy. Any opinions expressed herein are those of the author and do not represent the views or opinions of TradeStation or any of its affiliates.
Investing involves risks. Past performance, whether actual or indicated by historical tests of strategies, is no guarantee of future performance or success. There is a possibility that you may sustain a loss equal to or greater than your entire investment regardless of which asset class you trade (equities, options, futures, or digital assets); therefore, you should not invest or risk money that you cannot afford to lose. Before trading any asset class, first read the relevant risk disclosure statements on the Important Documents page, found here: www.tradestation.com .

Bullish Flag pattern AMAT is forming the bullish flag pattern
Wait for the wedge break out for long.


$AMAT may be on another leg upLooks like it's moving away from that 6 week second base this year. Looking at 30 days horizon...
Target: $180
SL: $159.21

AMAT NEW ATH BreakoutAMAT made a new All Time Highs and had a big breakout yesterday
I don't normally trade small bases but the price action is so strong in this case
Closed at high of the day
200 DMA holding dips
Momentum is strong should see continuation form here

$AMAT - Caught at the Supply Zone$AMAT has been trading within this channel for nearly the past year before breaking out to the upside.
It's since come back to retest it's upper resistance, which should now act as support. Given that it holds, we should have a wonderful long entry into a potential 15 point trade!

$AMAT - Calls > 156 | Puts < 145$AMAT - Calls > 156 | Puts < 145
- Weekly channel break out & consolidating at retest level
- Weekly Inside bar
- Weekly levels posted in chart

AMAT going bunkers !Nice breakout today on volume.
Watching above today's high for a push towards next resistance (left)
