AMC AnalysisPrice has taken out liquidity built in April 2021 as targeted a few months back in my previous analyses. Price has recently taken external liquidity and I'm expecting price to retrace back into the bearish POI at 9.15 next.
AMC2 trade ideas

AMC | Its That Time of Year | LONGAMC Entertainment Holdings, Inc., through its subsidiaries, engages in the theatrical exhibition business. The company owns, operates, or has interests in theatres in the United States and Europe. As of March 1, 2022, it operated approximately 950 theatres and 10,600 screens. The company was founded in 1920 and is headquartered in Leawood, Kansas.

AMC ready to fade. Too Much Big Short Money to OvercomeI like the theory of beating the Hedge Funds and their over capitalized naked shorts
but the reality of the markets is that they exist to hurt us (the poor and middle class).
I'm expecting a fake breakout sometime between now and Christmas, this will pull in a final round of suckers.
then going into the new year, this will print a definitive new lower low on a ton of volume.
The AMC Movie Theatre business fundamentals don't matter at all, this is a meme asset that is narrative and emotion driven only

AMC: Hit our CRITICAL SUPPORT LEVEL! What to expect from here?• AMC hit our support level at $5.05, which I mentioned in our previous post, here on Tradingview (link below this analysis);
• Now, it seems it is stabilizing, but we don’t see any bottom sign yet (not confirmed, at least);
• If AMC does a bullish reaction above this support, we can expect a bounce, at least, to the 21 ema in the daily chart;
• A bullish reaction could be any bullish candlestick pattern/structure above this key support;
• On the other hand, if it fails in react around the $5 support, AMC would seek the next support around $3;
• Either way, AMC is in a critical situation, and it is an interesting to put on our watch list, as regardless of what happens, it has a lot of potential;
• So far, AMC’s movements have been easy to read. I’ll keep you posted on this.
Remember to follow me to keep in touch with my daily analyses!

AMC Bottom $ we have one level to confirm the bearish or the bullish control which is the level 7.10$, if we never over come this resistant, we going to see test for the 2 support levels around the 4.50$ and 3.33$.
however if we broke the 7.10$and held above this time , we going to have a bullish momentum to take us till the 10$ and to squeeze price for amc which is above the 18$+.

AMC AnalysisPrice has been playing out nicely according to my analysis. Price took out buy-side liquidity before taking the sell-side liquidity, to mitigate the current bullish POI at 5.05. If price wants to go higher, this bullish POI will be respected and we would see at least a reaction into the newly formed bearish POI at 6.96. I'm expecting price to do a bullish retracement from here anyway.

AMC + APE double bottom plus divergenceTitle speaks for itself. If AMC is worth AMC + APE, then it's forming a nice double bottom with bullish divergence in MAC D and RSI.
Good luck out there.

AMC: Triggered our REVERSAL SIGN! What’s next?• In our last analysis, we nailed the top on AMC, as it triggered its key reversal points. In addition, it is way below our original target – the link to my previous public analysis is below this idea;
• Now, AMC lost our first target (21 ema, daily chart), and it ignored all of its retracements, including the 61.8%, the last mid-term support level;
• Is there any bullish reaction on AMC? Not at all. What’s more, even if it reacts, the 21 ema and the black line at $6.80 are key resistances, and AMC could just bounce to this level to drop again afterwards, since there’s no clear bullish reversal structure on it;
• The next support is at $5.05, and if we don’t see any meaningful bullish bottom sign, that’s where we are heading to;
• What kind of bullish reaction on AMC could make it bounce again? If it does a bullish candlestick closing above the previous day’s high. This would be a good start. I’ll keep you posted on this.
Remember to follow me to keep in touch with my daily analyses!

AMC - Rejected at 200 SMAAMC - Rejected at 200 SMA. I expect short term retraction to 50 EMA and second push towards 200 SMA, if it breaks 200 SMA, high chances reaching top of the channel.

AMC Entertainment Faces Steep Drop Below $10Without securing price action above $60 during the pending upside swing, AMC faces a very steep drop below $10, more likely to find support near $5. Considering the trending upside move and its 3 wave structure, this eliminates the possibility of AMC being in true impulsive form.

AMC: We nailed the BOTTOM! What to expect next on it?• Last week, we nailed the bottom level on AMC, and it exploded since then, as it broke our resistance at the blue area – the link to my previous public analysis on AMC is below this post, as usual;
• Now, AMC is in a short/mid-term bull trend, doing higher highs/lows in the 1h/D charts;
• Since it is a bull trend, in theory, it is heading to the next resistance at $10.75, as we already mentioned last week (last week we hit $9.15);
• Although the trend is bullish, it seems AMC is doing a pullback, and in this case, the 21 ema in the 1h chart along with the blue area are going to work as support levels;
• What if AMC loses the blue area? Then it’ll probably seek the 21 ema in the daily chart around $7.30s;
• For now, AMC has been behaving as expected. I’ll keep you updated on this.
Remember to follow me to keep in touch with my daily analyses!

AMC Setting up for pullback scalp on lower time frames.AMC seems a bit overextended here and I think this tweezer top pattern is a sign of a local top. I think we can go down back into the consolidation zone for now. I don't expect AMC to moon unless the general market holds stable. Not financial advice, DYOR

AMC Bullish setupOn 4H $AMC shows a bullish flag. If we do not face new short attack, the possibility of staying above 200MA on 4H is very likely.
On the daily timeframe, we are still below 200MA. At this point 200MA acts like a major resistance.
I say we will test 9$ very soon.

AMC AnalysisPrice is consolidating in this tight range, building both buy-side and sell-side liquidity. I'm expecting price to take out the buy-side liquidity and to trap buyers first before heading down to take the sell-side liquidity, as well as to mitigate the bullish POI at 5.05.

AMC - I'm Saying There's A ChanceIf we can hold support on these higher time frames and stay within or above my green consolidation zone I think there's a good chance we can move towards that horizonal target. If we can break the sloping resistance I think we can see higher prices. Not financial advice. DYOR

AMC: The MOST IMPORTANT support levels to work with!• Since our last analysis, AMC has been respecting the 38.2% retracement. It hit the retracement at least 5 times in the past two weeks;
• Originally, I thought the 50% was the most powerful support (after all, it is a dual-support level), but the 38.2% is a dual support level too, as the 21 ema finally got there;
• This is a classic time correction, when the price moves sideways, until the 21 ema catches up with it. This is different than a price correction, when the price drops to hit its previous support levels;
• All of this means that AMC is quite resilient, and as long as it stays above its retracements, the bullish bias will persist – only if it loses the 61.8% I see it below $5 again;
• Right now, the key resistance is the blue area. By breaking this ceiling, AMC would seek the next target, around $10 again. I’ll keep you updated on this.
Remember to follow me to keep in touch with my analyses!

AMC Bull Flag BREAKOUTAMC has finally broken out of a multi-day bull flag and is headed to $10 or higher. 12/2 $10 calls is what I would buy and I’d sell at one of the Fibonacci take-profits targets or a solid reversal on the 15m chart with Heikin Ashi Candles next Week or Friday. Enjoy‼️

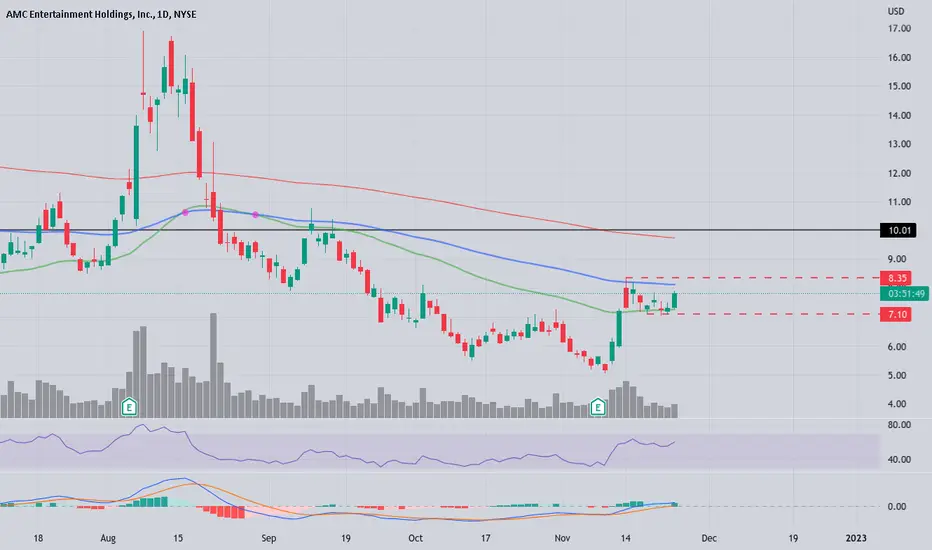
Great trade setup on $AMC!Enter when it break $8.35 , Stop will be $7.10 ..
Targets $9,$10,$11..
Play it small until you practice these setups!
Good luck ..
Inverse BTC IndicationThe last time this happened, we ran to 70+$.
This has to be it. Still balls deep in AMC/APE and still convinced that this is the end game. Btc drops, we fly. It‘s really that simple, my friends.
Spy looks juicy, crypto looks dead and AMC is more alive than ever!
Stay zen my friends, good times are ahead!
Nfa.


AMC bull flag to $10Bull flag leading to fibonacci level $10ish first. After that it may go to the next one or consolidate.

AMC - Bullish Trend to ContinueAMC price has moved back up into the mid $7 range after recently dipping below $6. This upward trend included a potential break-out on 11/11, and this upward trend is looking like it could continue based on technical indicators I watch.
The regression trend midline as presented is providing support on the daily and prior to release of APE this stock had significant price support in the mid-$7 price range. Stoch RSI a tad high but has cooled off slightly, and the stock price could easily continue to move up from here. The Volume Accumulation % has turned bullish as buyers appear to be taking over and the MACD is about to flip above zero. The MACD going positive has resulted in substantial price gains the last two times it has occurred.
Price may want to retest the break-out early next week. Will look at the Option chains on a back-test or pull back for a potential good options play next week. Will likely also look to add to shares. Given the overall chart dynamics, technical indicators, and a uber-resilient OBV, seems to be a fairly low risk entry. Further, have to wonder what the on-going demise of FTX and the associated AMC stock tokens traded on that exchange may have on the price.
Not financial advice.

AMC (December Point of Interest)Potential +100% rally early December time. We are about to enter the macro point of interest on AMC's 2 month cycle.
