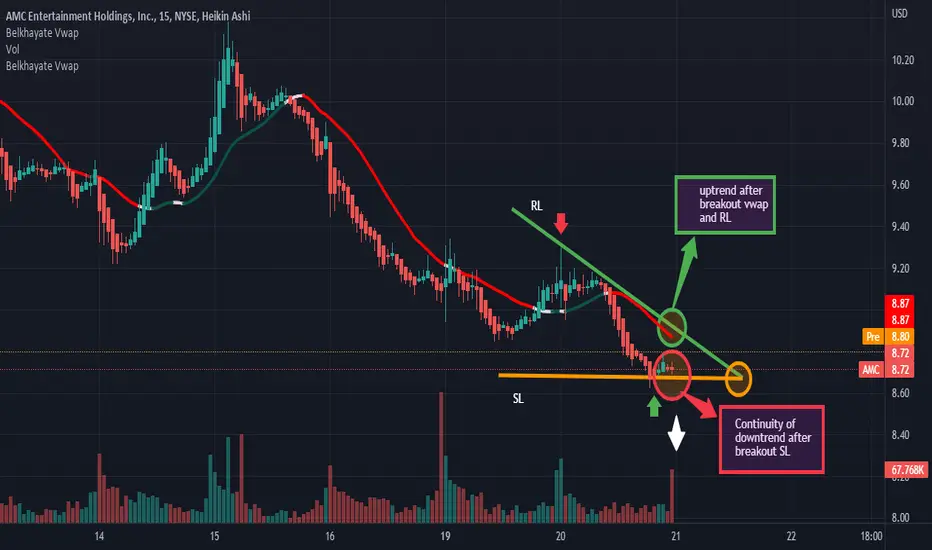
AnalysisHello everybody!! As you see on the chart we are in a downtrend and also we are under the vwap indicator. So we will have a continuity of a downtrend if the support line is broken with force by a big red candle with a large volume. In other hand, we will have a big probability of an uptrend if we have the breakout with force the vwap indicator and also the resistance line by a big green candle with a large volume.Thanks.
AMC2 trade ideas
Let‘s move up!Despite the FOMC meeting today, I believe the markets will rally. AMC still looks good and holds up support. I previously stated that the squeeze could happen this month but I‘ll have to correct my statement. Squeeze will probably occur in october!
Let‘s go my friends!

Maybe now the Shortsellers seeWhen in doubt, flip the chart. Maybe this way the bears can see what we see.

Will AMC's Short Squeeze Continue?Primary Chart 1 : AMC Price on the Daily Chart with Significant Fibonacci Levels Noted
Will AMC's Short Squeeze Continue?
Another short squeeze has successfully launched a few lucky traders into the stratosphere. Maybe more than a few if some take profits timely. AMC has risen about +183% above its low on May 12, 2022. In the past several days since July 27, 2022, it has risen about 99.06%. All signs point to another short squeeze similar to the prior ones. Even volume patterns look the same—albeit much smaller than prior volume patterns.
The short squeeze could continue as it did in June 2021. Short squeezes don't necessarily stop because everyone things price has gone too high. This article does not take a position on whether AMC is destined to revisit this year's lows or make new all-time lows. And predicting the behavior of numerous market participants—the retail buyers looking for a squeeze and the short sellers looking for a flush—and analyzing how such behavior is affected by other macro issues such as interest rates and liquidity in light of tightening Federal Reserve monetary policy would be a futile endeavor.
As a result, one may look to technical analysis to try to make a prediction about the probabilities.
Note on Primary Chart 1 how the price patterns at the prior short squeeze on March 29, 2022, and today's short squeeze, look nearly identical. Compare the two yellow ellipses on Primary Chart 1 above. Both peak candlesticks have an extremely tall bullish candle preceding them. And both sport a long upper shadow (or wick).
Some technicians call this a Pinocchio candle or bar. This type of price bar shows up when the bar breaks temporarily above a level of resistance and then falls back below it. It also can appear when the bar breaks temporarily below a key support level, and then reclaims that level by the close of the bar. Some basics of Pinocchio bars follow below for those unfamiliar with the term:
Martin Pring, a technical expert, writes that these bars "give a false sense of what is really going on." Pinocchio bars tend to create bull or bear traps depending on the direction the long upper shadow points.
Upside breakouts, such as here with AMC, lock in unwary longs with a loss by the close of the bar. Shorts similarly get stopped when intraday bars pierce well below support and then whipsaw back above that support by the close.
In Martin Pring's books, he further explains that the "false break" that develops is " indicative of exhaustion since the price cannot hold above the strong resistance reflected by the line ."
In short, like the character Pinocchio's nose that grows when he lies, the price move beyond the resistance / support ends up being a false move, and the bigger the false move, the bigger the lie.
In summary, the Pinocchio bar with a long upper shadow, especially when viewed along side other similar bars over the past year, imply that price has likely exhausted to the upside for the time being.
Further support for exhaustion is evident. Note how the Fibonacci projection levels have provided strong support and resistance repeatedly since the all-time high in June 2021. Primary Chart 1 labels those levels and points out their operation as strong resistance on multiple occasions.
The last two rally attempts occurred in December 2021 and March 2022. Both these rally attempts failed at the .50 Fibonacci projection (green line shown on Primary Chart 1). For the current rally, the price bars with the long upper shadow pierces the next Fibonacci level of importance in the sequence: the .618 level which lies just below the .50 level . This also supports at least a temporary pullback or consolidation.
Additional evidence supports exhaustion. Note below how AMC's price has now risen to +5 ATR on the daily and its candle has a long upper shadow. Moves to +3 ATR are rarely sustainable for long much less +5ATR. In the chart below, note the location of price relative to the +3 ATR Keltner Channel. The +3 ATR KC is the outermost band on the upper edge of the KC bands.
Supplementary Chart 2.1: AMC's price well above +3 ATR band on the Daily Chart using Keltner Channels
Supplementary Chart 2.2: AMC's price relative to the +5 ATR band on the daily chart using Keltner Channels
Finally, note the declining volume on each successive short squeeze. This suggests that the buying pressure has waned as short squeezes have continued following each major decline.
Supplementary Chart 3.1: AMC's price well above +3 ATR band on the Daily Chart using Keltner Channels
But the persistence of the buyers squeezing the shorts should be recognized as something that is a new force in markets since what occurred in 2021. Price could indeed push higher if enough collective buying force continues in stock and options markets sufficient to overwhelm all supply. Price can do a lot of things no one expects.
But based on technical analysis alone, however, price likely falls lower from here. This author makes no argument that new lows will be reached. It will be important to watch the pullback to answer that question. A reasonable price target would seem to be 16.50 near the .618 retracement of the rally from the May 12, 2022, low to the August 8, 2022 high.

A New Pitch ForkI drew up a pitchfork at the start of this bullish momentum a few months ago and it tracked very well, so let's see how this one does.

AMC gearing up to make another big move towards the upsideLooks like AMC might be pushing $30 by the 22nd of sept. Here's the chart with the important numbers marked.
Look for some slight resistance around $13.

AnalysisHello! As you see on the chart we have a continuity of a downtrend after the breakout of the support line.Thanks.

Soon it'll be overYou can either spend your time looking at charts, trying to predict the next few seconds, minutes or hours or you can decide to enter long term investments based on fundamentals.
But you can also buy up the whole damn float of a company because of memes.
How many companies are owned by the public?
Even if I don't condone burning money with shady stocks and crypto-coins, it's is impressive to say the least, that some redditers, men and women,
across all ages and from every place of this magical world bought more than 90% of a the float.
Imagine if more companies were owned by the public. What a world we'd live in!
Don't EVER underestimate the power of the masses.
Apes now own AMC.
Beautiful times are ahead, my friends.
Stay focused, stay zen. See you on the moon.

amc sellsentiment and news says sell, indicators from daily to 45 min says sells, price action says sell, tarot indicator says sell, reactions off the trend lines and heading to the bottom trend line liquidity

Analysis-sell ideaHello ! As you see on the chart we have the breakout with force the vwap indicator and also the support line so it's mean that we will have a big probability of a downtrend.Thanks.

Falling Wedge Alternate IdeaI've gone and adjusted some of my trendlines and based on trendlines, we may be seeing a bounce off that golden line. It has been a very important level for months. There is the smallest uptrend in both OBV and RSI that may indicate a bounce. If we clear the falling wedge, ideally with some volume, this may indicate a bullish divergence. I would be looking for a consolidation phase between $8.18 and $10.10.
If we can match that bullish trend line we had again, or potentially break it in the next 1-2 months, that would be where I'd expect the next rally. If you believe in the T90 on APE coming to fruition, this would be in the ballpark for a run simultaneously.

Analysis-PullbackAs you see on the chart, if we have a pullback on the vwap indicator and also on the support line, the market will goo up.Thanks.


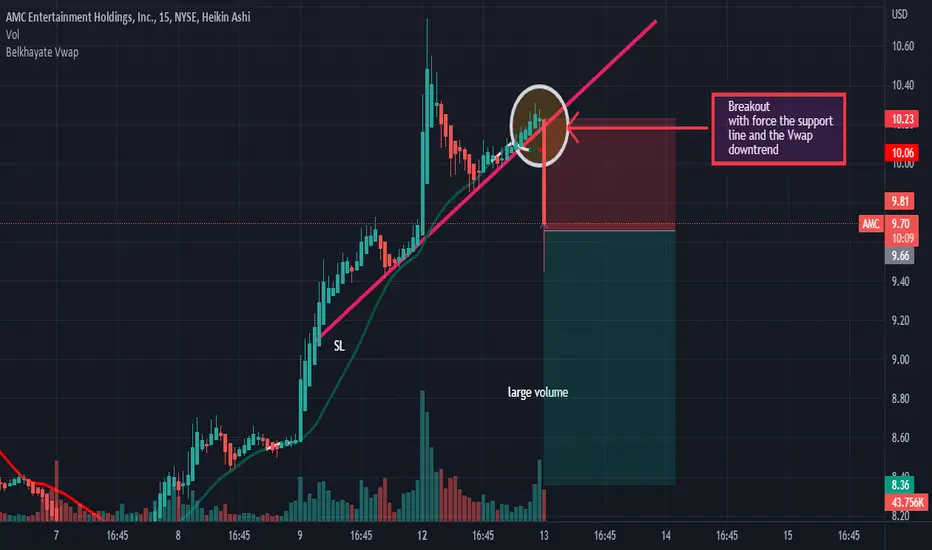
Illustration-uptrend-buy ideaBreakout with force the resistance line by a big green candle with a large volume.So we will have agood uptrend.Thanks.

AnalysisHello!! as you can see on the graph we are in an uptrend and on top of that we are above the vwap indicator. Thus, the market may continue to rise if the resistance line is forcefully broken by a large green candle and followed by large green volume. On the other hand, we could have a reversal of the trend if and only if the vwap indicator as well as the support line are forcefully broken by a large red candle and accompanied by a large red volume.Thanks.

AMC Squeeze $ Target we need to hold this week above the 10$ level to. confirm the bullish momentum is back and going. to the squeeze level around the 12$, our current support we should hold to see this reaction is above the 9$ level.

$AMC: Breakout to 15$?⚡200 Weekly level mounted (huge resistance now became support)
⚡Support trendline held with a bullish engulfing + volume + bullish divergence on the MFI
⚡Golden pocket fib resistance
⚡Ichimoku Cloud broken
⚡VPVR support mounted at 9-9.7$
⚡10.86$ resistance confirmed by 0.5 fib + VPVR node
⚡12$ resistance confirmed by 0.382 fib + VPVR node + Ichimoku cloud resistance at 11.5$
⚡Moving towards the upper trendline which is located at the 15$ level
*WARNING* This thread is not financial advice. I am not a financial advisor.

Buyers are thereThe buyers are in the process of imposing themselves in front of the sellers. But let's remain vigilant.!!! Thanks...


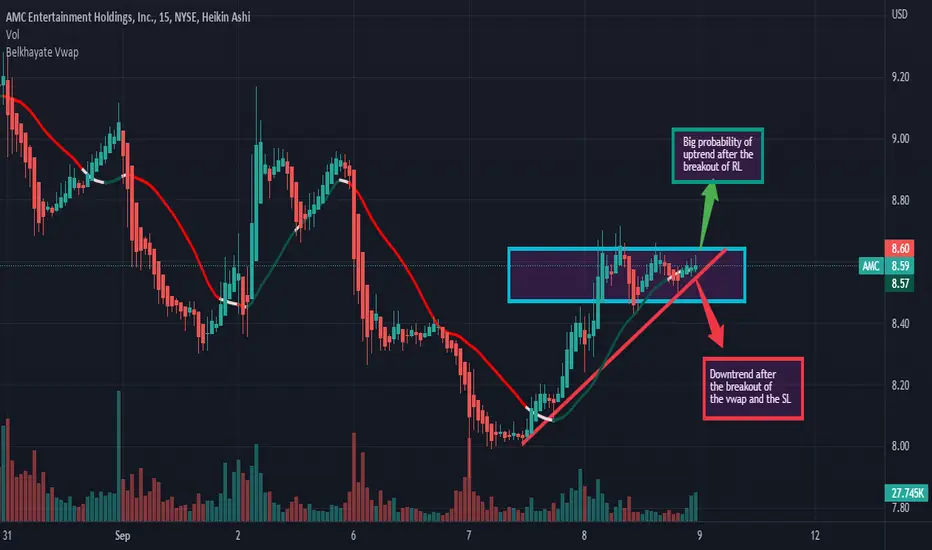
Analysis-Big probability of an uptrendAs you see on the chart we will have a big probability of an uptrend after the breakout of the resistance line by a big candle with a large volume. In other hand, we will have a downtrend after the breakout of the vwap indicator and the support line by a big candle with a large volume. Thanks.
AMC AnalysisPrice is playing out according to my last analysis. Right now, I'm expecting price to continue lower into the bullish POI at 6.59, possibly to take the lows at 5.96 before continuing higher. If price breaks above 9.64, we could see price initiating an uptrend.

AMC algos got cracked! .this was simple! I hope it will sell off today and continue another week a downtrend before explosion.
