Amazon Stock Trapped in a Bearish ChannelOver the past two weeks, Amazon's stock has declined by more than 13% , forming a new bearish channel. Selling pressure has intensified as concerns about potential tariffs begin to affect investor confidence in Amazon's multinational operations. The possible onset of a new trade war could seriously impact some of Amazon’s business model, which relies on importing products from other countries into the United States. This could eventually reduce demand and continue to reinforce the bearish bias in stock movements.
Bearish Channel
Since late February, shortly after the earnings report, Amazon's stock has entered a clear short-term bearish channel, reaching a low of $197 per share. Currently, a minor bullish correction is emerging, approaching the upper boundary of the bearish channel. However, as long as bullish momentum fails to break this upper level, it is likely that the channel will remain the dominant formation, maintaining downward pressure on the stock.
ADX Indicator
The ADX line continues to rise above the neutral level of 20, reaching levels not seen since December 2024. This reflects the momentum of current price movements and the increase in volatility affecting the stock. If the ADX line remains elevated, volatility could either support or challenge the current trend, depending on market dynamics.
MACD Indicator
Lower lows in price movements and higher lows in the MACD histogram have formed a divergence between the indicator and price movements. This imbalance of forces could signal the continuation of short-term bullish corrections.
Key Levels:
$230: Major resistance. This level corresponds to the highest price zone recorded in December 2024. If the stock returns to this level, it could reactivate a previously forgotten uptrend.
$216: Current key resistance. This level aligns with the upper boundary of the bearish channel and the 100-period simple moving average. Sustained buying pressure above this level could put the bearish channel at risk.
$197: Near-term support. This level corresponds to November 2024 lows. If the stock breaks below this support, it could lead to new lows on the chart, reinforcing the ongoing downtrend.
By Julian Pineda, CFA – Market Analyst
AMZN trade ideas

Bull/Bear case of AMZNKey Resistance Levels: $221, $215
Key Support Levels: $188, $184
Bull Case
The stock has been on a consistent upward trajectory since late 2022, forming higher highs and higher lows.The trend remains intact unless it breaks major support levels.
If AMZN holds above $215, it could retest the $221+ resistance zone and push toward new highs.May target $230+ if momentum continues.
The 38.2% Fib retracement (~$195) held as strong support.If AMZN stays above $212–$215, we could see a higher breakout.
Bear Case
AMZN has retraced from recent highs (~$243), showing some weakness.A failure to reclaim $215 could trigger further downside.
If AMZN breaks below $188–$184, it could trigger a larger correction to $168(Fib 0.786).
Heavy volume in the $125-$135 range suggests strong historical buying interest, but it’s far below.
Final Verdict
Bullish Bias Above $215: If AMZN holds above this level, expect a push to $221–$230. Above $231 we can expect $254.
Bearish Below $188: A drop below $188 could lead to further selling down to $165–$160.
Best Trading Approach
Agressive Bulls :- Buy dips near $202.51 with stop loss of $199
Conservative Bulls:- $188–$184 with stop-loss below $180.
Bears: Wait for a breakdown below $184 before shorting.
NOT FINANCIAL ADVICE

Amazon Bullish
Current Market Position
The speaker is analyzing Amazon's stock performance, noting that since August 2024, Amazon has been in an upward channel pattern. While the price action hasn't been consistently dominant on the upside, the support line of this channel has been particularly reliable.
Key Support and Resistance Levels
- **Critical support level**: $216.57
- **Recent resistance**: $219.62 (approximately $220)
- **Lower support level**: $204.79
## Recent Price Action
Amazon's stock recently experienced the following movements:
- Rallied after touching the $216.57 support level
- Later broke below this support
- Reached around $233 before falling back to $216.57
- Created a higher high on a second attempt upward
- Eventually broke below both the $216.57 level and the supporting trend line that had been in place since August
- Found buyers around $204.79
- Rebounded to pierce through $216.57 again, reaching approximately $220
- Fell back to the $216.57 level
- Importantly, has now created a higher low, which the speaker considers significant
## Bullish Outlook
The speaker believes Amazon stock currently has a bullish sentiment. For this bullish trend to continue, three key conditions need to be met:
1. Breaking above $216.57
2. Breaking above $219.62
3. Breaking through the downtrend on the technical indicators
If these conditions are met, the speaker anticipates upward momentum with a double bottom formation, potentially moving beyond the $220-237 range.
## Bearish Alternative
If the stock fails to break through these levels and instead hits the back end of the supporting channel trend line (shown as a black line in their analysis), the speaker believes a significant downward movement could occur.
## Conclusion
The speaker sees a good opportunity to enter a trade now to potentially capture upward momentum, especially if the stock moves past the identified resistance levels. They believe momentum will be strong if the stock can clear these hurdles.

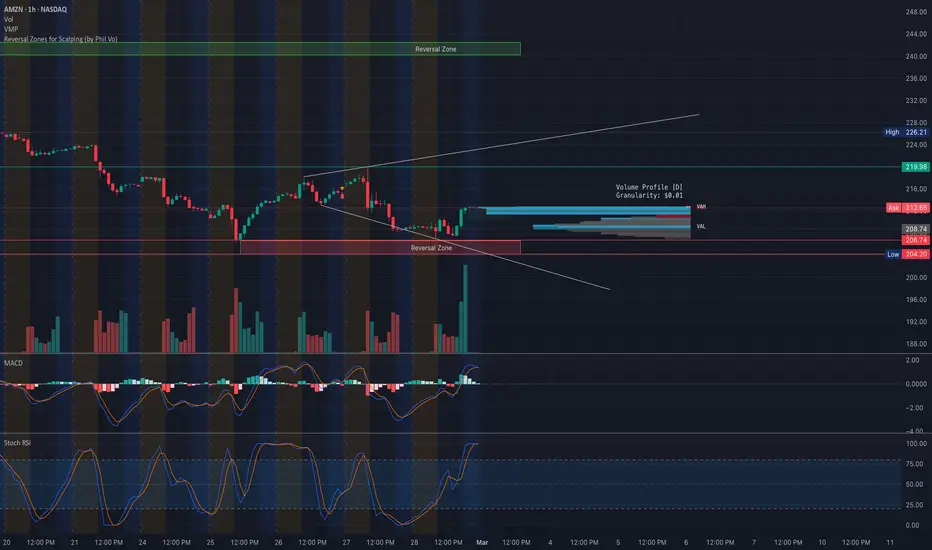
AMZN at a Major Turning Point! Key Reversal or Breakdown?📊 Technical Analysis (TA) for AMZN
* Current Price Action: AMZN is attempting to recover from a downtrend, showing signs of a reversal after hitting the reversal zone near $204-$206. The price has broken out of a falling wedge, signaling a potential short-term upside.
* Key Levels to Watch:
* Resistance 1: $212.50 (Volume Profile POC) – A breakout could confirm bullish momentum.
* Resistance 2: $220 (2nd Call Wall) – Price may slow down or reject here.
* Major Resistance: $225-$230 – A strong resistance area and gamma wall.
* Support 1: $210 – If AMZN pulls back, this is the first key level to hold.
* Support 2: $205 (Put Support) – A breakdown below this would signal further downside risk.
* Critical Breakdown Level: $200 – Losing this level could trigger a larger sell-off.
📌 Indicators:
* MACD: Bullish crossover, indicating early momentum shift.
* Stochastic RSI: Overbought near 99, suggesting a possible short-term pullback.
🔎 Options Flow & GEX Analysis
* GEX (Gamma Exposure) Key Levels:
* 88.08% Call Resistance at $220 → Breaking above could fuel upside momentum.
* 71.12% 3rd Call Wall at $230 → A strong gamma resistance area.
* Highest Positive NetGEX / Call Resistance at $225 → Dealers could hedge against further upside.
* Put Wall Support at $205 → A strong support area from options positioning.
* 3rd Put Wall at $200 → Breaking this level could accelerate downside volatility.
📌 IV & Sentiment:
* IV Rank (IVR): 41.7 → Moderate implied volatility, options are reasonably priced.
* IVx Avg: 41.4 → Steady, indicating a stable options environment.
* Options Sentiment: Calls = 3.3% → Very low bullish bias in options flow.
📈 Trade Scenarios & Strategy
📌 Bullish Scenario (Breakout Play):
* Entry: Above $212.50 with strong volume.
* Target: $220, then $225.
* Stop Loss: Below $210.
📌 Bearish Scenario (Rejection & Breakdown):
* Entry: Below $210.
* Target: $205 or $200.
* Stop Loss: Above $212.50.
🔥 Final Thoughts & Suggestion
* AMZN is testing a key reversal zone. A breakout above $212.50 could push it toward $220+.
* If it fails to hold $210, expect a retest of $205-$200, which is a major support zone.
* Volume and options flow will be key – if gamma levels start unwinding, expect volatility to spike!
🚨 Disclaimer: This analysis is for educational purposes only. Trade responsibly and manage risk! 🚨
2 years Up For over two years, Amazon's price has been moving within the green channel, with the only exception being in August 2024 when a panic selling affected all markets after the poor US employment data.
At the moment, it is likely that after touching the bottom of the channel at $204, it will rise to $250 in the coming weeks
In case the price drops below $204, this idea is void

AMZN Trade Plan Looking for buy opportunities on AMZN at key levels:
✅ Entry Points: 211 - 203 - 190
🎯 Profit Targets: 218 - 227 - 241
Stick to the plan, manage your risk, and let the trade play out! 📊📈
⚠️ Disclaimer: This is for informational purposes only and not financial advice. Always do your own research and trade responsibly! 💡

AMAZON ($AMZN) Q4—$187.8B REVENUE UPSWINGAMAZON ( NASDAQ:AMZN ) Q4—$187.8B REVENUE UPSWING
(1/9)
Good afternoon, TradginView! Amazon ( NASDAQ:AMZN ) posted Q4 ‘24 net sales of
187.8 B,up 10 637.959 B here’s the breakdown.
(2/9) – REVENUE GROWTH
• Q4 Sales: $ 187.8B, 10% up from $ 170B 📈
• Full ‘24: $ 637.959B, 10.99% rise 📊
• AWS: $ 28.8B, 19% YoY boost 💻
NASDAQ:AMZN ’s steady climb continues.
(3/9) – EARNINGS LIFT
• Q4 Op. Income: $ 21.2B, up from $ 13.2B 💰
• NA Op. Income: $ 9.3B, from $ 6.5B 🌞
• AWS Margin: 38%, decade high 🌟
NASDAQ:AMZN ’s profit engine hums strong.
(4/9) – KEY MOVES
• AI Push: GenAI apps rolled out 📡
• AWS: Cash flow dynamo shines 🌍
• Stock: 207−230 range 🚗
NASDAQ:AMZN ’s tech bets fuel growth.
(5/9) – RISKS IN FOCUS
• Spending: Retail feels price pinch ⚠️
• Regs: Antitrust looms large 🔒
• Comp: Azure, Walmart press hard 📉
NASDAQ:AMZN ’s solid, but hurdles lurk.
(6/9) – SWOT: STRENGTHS
• Retail: $ 115.6B Q4 NA sales 💪
• AWS: $ 28.8B, 38% margin 🏋️
• Scale: Ads, subs diversify 🌱
NASDAQ:AMZN ’s a titan, built to last.
(7/9) – SWOT: WEAKNESSES & OPPORTUNITIES
• Weaknesses: Capex weighs 📚
• Opportunities: AI, emerging markets 🌏
Can NASDAQ:AMZN vault past the risks?
(8/9) – AMZN’s $ 187.8B Q4, your view?
1️⃣ Bullish, $ 300+ by ‘26 😎
2️⃣ Neutral, Steady, risks balance 🤷
3️⃣ Bearish, Growth stalls 😕
Vote below! 🗳️👇
(9/9) – FINAL TAKEAWAY
NASDAQ:AMZN ’s $ 187.8B Q4 and $ 637.959B ‘24 stack up, tech titan 🪙 AWS shines, risks loom, gem or pause?

So much support for Amazon, bulls have complete control!boost and follow for more ❤️🔥
Amazon continue to bounce its trend support from 2023, and well above its major trend support from 7+ years ago 👀 Worst case scenario I see it dipping to 200-208 levels then continuing higher.
A slower mover but I believe we should see 250-300+ by years end, maybe much sooner depending on future earnings reports..
that's about it.. I may update this post with other timeframe in the future so stay tuned ✌️

AMZN Bouncing Off Lows! Can Bulls Reclaim $220?Technical Analysis for February 27, 2025:
1. Current Price Action:
* AMZN bounced off $204.16 after a strong downtrend, now consolidating near $214-$215.
* A falling wedge breakout attempt is forming, with resistance at $217-$220.
* Volume indicates buyers stepping in at lower levels.
2. Key Levels to Watch:
* Support: $210 (POC), $205, $200 (Major downside risk if broken).
* Resistance: $217-$220 (Breakout confirmation zone), $226-$230 (Major resistance walls).
* Upside Targets: $225, $230.52.
3. Indicators Analysis:
* MACD: Attempting a bullish crossover, momentum still weak.
* Stoch RSI: Moving higher, indicating upside potential.
* Volume Profile: Price needs to hold above $214 for a continuation move.
GEX & Option Strategy for Tomorrow and the Week:
1. Gamma Exposure (GEX) Insights:
* Call Walls: $220, $225, $230 → Resistance areas; breakouts could trigger a gamma squeeze.
* Put Walls: $205, $200 → Key support zones.
2. IV & Sentiment:
* IVR: 35.9 (low)
* IVx Avg: 35.4 (stable) → Neutral volatility environment.
* Call Positioning: 6.7% bullish sentiment (weaker than other stocks).
* GEX Sentiment: Slightly bullish; if $220 breaks, more upside could follow.
3. Trading Suggestions:
* Bullish Setup: If AMZN reclaims $217-$220, consider long positions targeting $225-$230, with a stop at $212.
* Bearish Setup: If AMZN rejects $220, short opportunities targeting $210-$205, stop at $223.
* Options Play: Selling put spreads at $205 support or call spreads near $230 resistance.
📌 My Thoughts & Suggestion:
* AMZN is showing signs of strength, but it needs to break and hold $220 to confirm bullish momentum.
* Failure at $217-$220 could lead to a pullback to $210 or even $205.
* IV is low, making long options attractive for directional bets.
⚠️ Disclaimer:
This analysis is for educational purposes only and does not constitute financial advice. Always do your own research and manage your risk before trading. 🚀

Elliott Wave View: Amazon (AMZN) Short Term May See Further UpsiShort Term Elliott Wave View in Amazon (AMZN) suggests that rally to 242.52 on 2.5.2025 high ended wave III. The stock then did a double three Elliott Wave correction ((W))-((X))-((Y)). Wave ((W)) ended at 221.77 and wave ((X)) ended at 234.81. Wave ((Y)) lower unfolded as a zigzag Elliott Wave structure. Down from wave ((X)), wave (A) ended at 225 and wave (B) ended at 234.81. Wave (C) lower subdivided into 5 waves impulse.
Down from wave (B), Wave 1 ended at 228.06 and wave 2 ended at 233.92. The stock then resumed lower in wave 3 towards 210.7 and wave 4 ended at 213.18. Final wave 5 lower ended at 204.16 which completed wave (C) of ((Y)) of IV in higher degree as the 30 minutes chart below shows. The stock has turned higher in wave V. Up from wave IV, wave (1) ended at 218.16. Pullback in wave (2) is now in progress to correct cycle from 2.26.2025 low before the stock resumes higher. Near term, as far as pivot at 204.16 low stays intact, expect dips to find buyers in 3, 7, or 11 swing for further upside.

Amazon (AMZN) Scalping Strategy🔥 Market Overview:
Trend: Short-term recovery, but overall bearish structure still present.
Key Levels:
Resistance: $215.80, $218.50
Support: $213.00, $210.00
Indicators:
EMA9 near EMA200 → No strong trend, price testing equilibrium.
MACD slightly negative → Weak momentum, no clear trend.
RSI at 52.98 → Neutral, no divergence.
Risk of Short Squeeze? Low—only if price breaks $215.80.
Market Maker Activity: Some accumulation, but still in range.
🔥 Scalping Strategy:
🩸 1. Momentum Scalping (If Breakout Above $215.80)
Buy near: $215.80
Target: $218.50
Stop-loss: $214.50
Risk-to-Reward: 1:2
🩸 2. Range Scalping (If Price Holds $213 - $215.80)
Buy near: $213.00
Sell near: $215.80
Stop-loss: $211.80
Profit Potential: ~2.4%
🩸 3. Breakout Scalping (If Below $213.00)
Short below: $213.00
Target: $210.00
Stop-loss: $214.50
Risk-to-Reward: 1:3
🔥 Mid-Term Trend Forecast (1-3 Weeks):
If $215.80 holds, Amazon could push towards $218.50 - $220.00.
If $213.00 fails, expect a drop to $210.00.
🔥 News & Market Context:
Investors filed a lawsuit against Amazon for misleading shareholders → Negative sentiment.
Stock up 0.73% today → Weak bullish momentum, but lawsuit risk lingers.
Earnings in 57 days → No immediate catalyst for a big move.
👑 Trade Rating (1-10):
Range Scalping: 7/10 (Good but needs confirmation).
Momentum Long Above $215.80: 8/10 (Stronger confirmation needed).
Short Below $213.00: 9/10 (Best risk-reward setup).
🔥 Decision:
🩸 Short-term Play: Best for range scalping $213 - $215.80.
🩸 Mid-term Play: Break above $215.80 = long; below $213.00 = short.
🩸 Ideal Play: Wait for breakout confirmation.
👑 Final Verdict: Play the range or wait for a trend shift.
🔥 LucanInvestor's Quote:
"Patience and precision—two weapons of a master trader."

Amazon ($AMZN) – Breakdown Signals Deeper Correction Ahead?NASDAQ:AMZN
The stock broke key support at $216.20, confirming the potential for a deeper correction. This move follows the completion of a Bearish Shark pattern at $227.76, reinforced by a strong bearish divergence that has been unfolding since late June 2023.
🔹 Bearish Scenario – Fibonacci Targets Below:
The Bearish Shark pattern has a default target below $180.91, with a key focus on the 50% retracement level at $161.97 , marking a potential -27% correction from recent highs.
🔹 Key Levels to Watch:
📉 Support: $216.20 (broken), $180.91, $161.97 (50% retracement and 5-0 bullish sequence)
📈 Resistance: $242.52
💡 As long as $216.20 remains broken , bearish momentum should dominate. We should watch for a reaction near $154.53, if reached, where a 5-0 pattern could potentially emerge, signaling a technical bounce. Until then, price remains under pressure.
Happy Trading,
André Cardoso
💡 Risk Warning: Trading financial assets carries a high level of risk and may result in the loss of all your capital. Make sure to fully understand the risks involved before you start trading and carefully consider your investment objectives, level of experience, and risk tolerance. The data and information provided in this content do not constitute financial or investment advice and should not be considered as such. Only invest what you can afford to lose, and be aware of the risks associated with trading financial assets.

MORE BEARISH CALLSWhy Amazon Is Going Down?
While Amazon.com, Inc. posted solid revenue of $187.79 billion, its Q1 2025 sales forecast of $151 billion to $155.5 billion fell short of Wall Street’s $158.5 billion expectation. Add in concerns over a $100 billion 2025 spending plan…for AWS and AI $83 billion in 2024—and a $2.1 billion foreign exchange headwind, and you’ve got a recipe for market unease. Analysts on Nasdaq note this volatility, alongside competition from Microsoft and Alphabet, has sparked bearish sentiment, even as the company’s market cap holds strong at $2.23 trillion.
MORE SELLS can be taken below the neckline once it breaks out. those looking for buys .wait for it to fall to support

AMZN Disappointing Earnings? Looks like the Market did not like the earnings. How far will the pull back go? AMZN has been in a rising wedge on a 24hr chart, can it hold or has the market already determined its fate. $231 seems to be the important level to watch. If it continues to flush i will be targeting $208 area and a max down to $185 area.

Amazon (AMZN) Scalping & Mid-Term Analysis🔥 Market Overview
Trend: Strong Bearish 📉
Resistance: $208.50 → EMA 9, acting as short-term resistance
Support: $205.00 → Local demand zone
Indicators:
MACD: Bearish with no reversal signal
RSI: 22.63 (Oversold) – high chance of a short-term bounce
VWAP: Below average, selling pressure dominates
🩸 Risk: Wells Fargo lowered price target to $203 → Bearish pressure
🔥 Scalping Strategy (5x Leverage)
🩸 Momentum Scalping:
Buy: Near $205.50–$206.00, targeting $208.00 (+1.2%)
Sell: Near $208.00–$209.50, targeting $205.50 (-1.3%)
Stop-loss: Below $204.50
🩸 Breakout Scalping:
Above $210.00: Long to $214.00 (+1.9%)
Below $205.00: Short to $203.00 (-0.9%)
🔥 Mid-Term Trend Forecast (1-3 Weeks)
Bullish above $212: Potential recovery to $220+
Bearish below $205: Possible slide to $200
🔥 News & Market Context
🩸 Wells Fargo lowered price target to $203 → Negative sentiment
🩸 AMZN is in an oversold zone but lacks a strong catalyst for reversal
🔥 Decision:
🩸 Short-term: Scalp long near $205.50, sell at $208.00+
🩸 Mid-term: Watch for a $205 breakdown before major moves
🩸 Ideal Play: Short bounces cautiously, confirm reversal before longs
👑 Final Verdict:
"The market rewards the patient and punishes the impulsive." – LucanInvestor

Elliott Wave View: Amazon (AMZN) in Support ZoneShort Term Elliott Wave View in Amazon suggests the stock has reached support zone from 5 February 2025 high in 3 waves. Down from there, wave (A) ended at 221.77. Rally in wave (B) ended at 234.81. Wave (C) lower is in progress with subdivision as a 5 waves impulse. Down from wave (B), wave 1 ended at 228.06 and wave 2 rally ended at 233.92. The stock extended lower in wave 3. Down from wave 2, wave ((i)) ended at 221.81.
Rally in wave ((ii)) ended at 224.06. Stock resumed lower in wave ((iii)) towards 214.74 and wave ((iv)) rally ended at 218.35. Final leg wave ((v)) lower ended at 212 which completed wave 3. Rally in wave 4 is in progress to correct cycle from 11 February 2025 high before it resumes lower. Near term, as far as pivot at 234.89 high stays intact, expect rally to fail in 3, 7, or 11 swing for further downside in wave 5 of (C). Pair has currently reached 100% – 161.8% Fibonacci extension from 5 February 2025. This support area is at 200.6 – 213.6 where wave (C) is expected to end and the stock can at least turn higher in 3 waves.

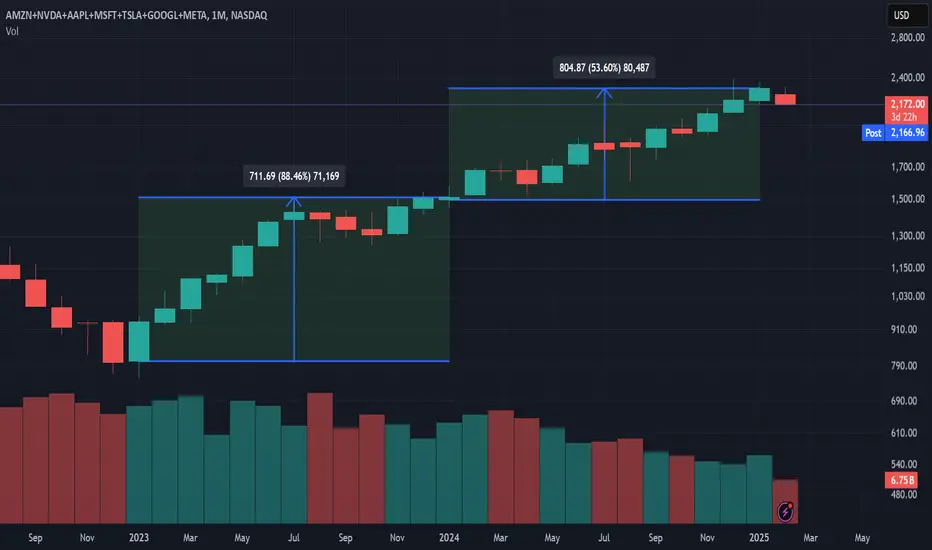
Mag 7 performance for 2023 and 202488% for 2023 and 53% for 2024
Holding the magnificent 7 in 2023 was better than The Turtles' average of 80% back in the day.
AMZN 24 hr potterboxesAMZN Amazon 24 hr potterboxes it looks like amazon has broke thru the floor of the top box and thru the roof of the lower box. its still above the 200 day moving average, so theres that. there is some resistance to the left but it looks like the next stop is $211.01 ish. or it could go lower to the $205.54 ish area which is the 50 percent line or cost basis. until it finds a nice stopping point. well just keep a eye on it. Happy trading.

Amzn still a no buy for meAmazon still under selling pressure. Give it some time before going long. Trade the charts.

$AMZN #AMZN Possible path $MAZN #AMZN we could possibly see this in 190-195..ish area .... check it out

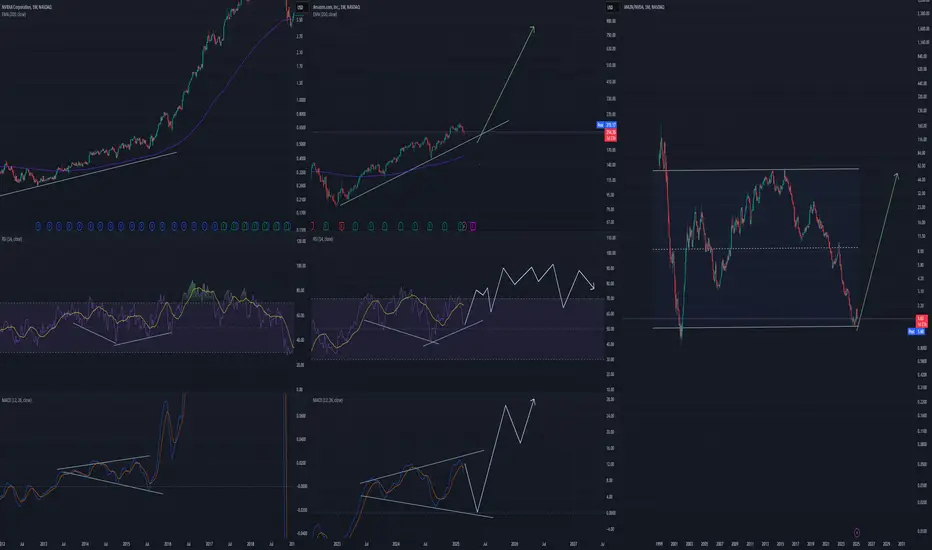
AMZN to snap back
Hi
I am very encouraged by my PLTR trade idea to test 116, 121 in my previous post. They certainly do respect the Fib Extension levels.
This time, I am applying Fib Retracement to AMZN, which I think will bounce back to 0.28 (222) , 0.38 (226) and even 0.5 (229) , from it current levels of 216.
Secondly if you observe the daily charts, everytime RSI dips below 30, it's a buying opportunity.
(Do note: there are a couple of times when RSI double dipped to present a buying opportunity.)
All the best!!!!

