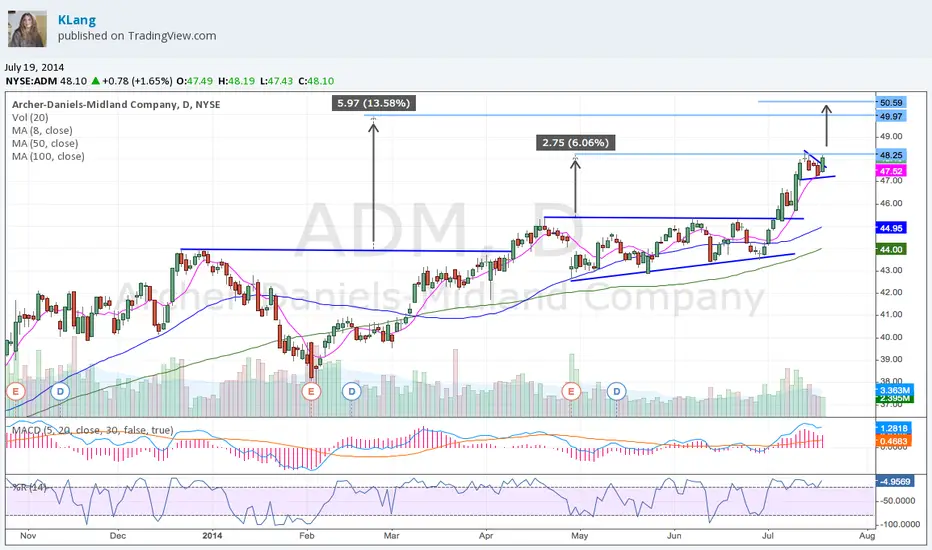
ADM - holding up quite well, but capped by 200 MA...Some stocks seem to show weakness after the bull run off the February lows, but ADM seems to holding up quite well. I still like the gradually emerging new " inflation coming " theme, I will therefore closely monitor ADM, DBA, MON, MOS, VALE, FCX, Rio Tinto, BHP Billiton and several other names, including ETF`s.
ARDA trade ideas

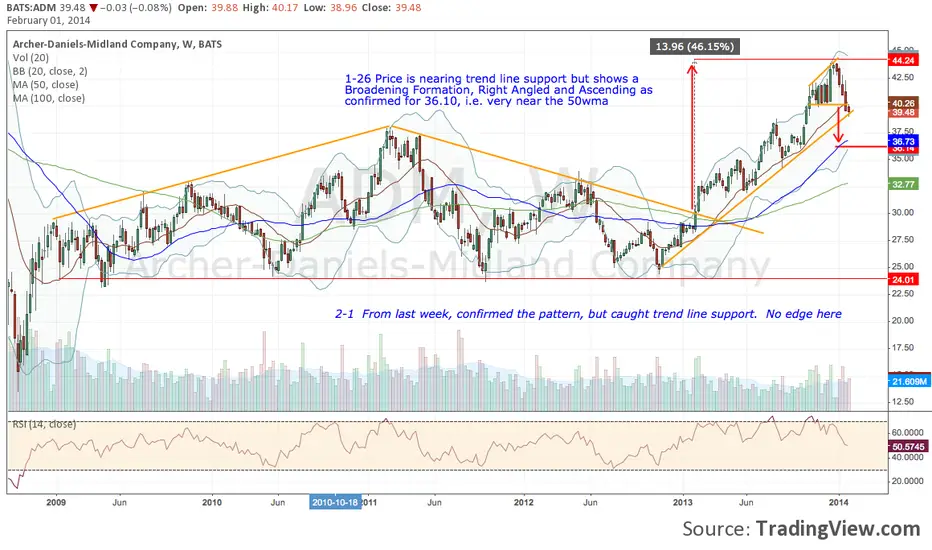
ADM - weekly swing trade, prepare for LONG.Price was rejected by the WEEKLY 200 MA at approx. 39.90 - 40.00USD, but I expect re-accumulation in the course of this year. I will watch this each week and post if I see a better entry level.

On the border, as something missingthe game of probabilities, the fact is, we have a local trend, and the fact is, it's a nice pullback. At break of 38 I would sell

$ADM potential for long positionPrice from 39 to 35 and moving from upper parallel of upsloper (blue/red) to lower parallel and now a move above yellow upper parallel of downsloper: Odds for higher prices are increasing.

A Bottom Bullish Triangle DetectedV-not yet confirmed but it looks this bullish bottom triangle has some upside merits and has a projected upside target $40 zone with tight stop at recent swing low at $31.5 zone

BULLISH WOLFE WAVE. BUY ADM:FTSE 100Aggressive Entry @ 32.00 with STOP @ 31.00
Conservative Entry @ 37.00 with STOP @ 35.00
Target @ 47.00
Time-frame: Hold for 2/3 Months.


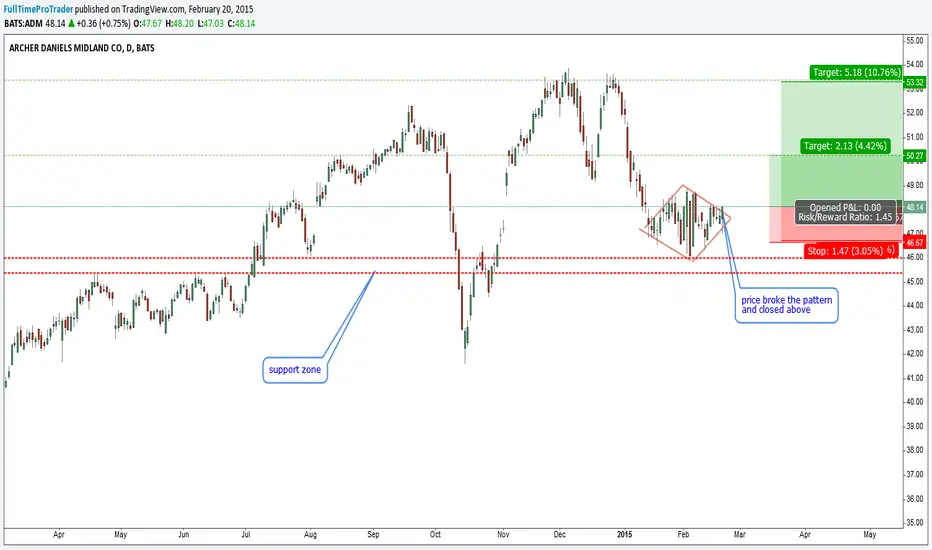
ADM-nice diamond brokenAfter some consolidation the pattern was broken today to the upside.
This usually means a trend change or deeper correction.
The weekly chart analisis supports also a bullish bias:
Good luck

Looks like a reliable indicator. At least in this case.To open a long position now and close when the histogram will change its color to gray.