ASML HOLDING daily analysisHi friends
the daily chart of this market shows that it will experience an uptrend in the next few days but at the same time
it is necessary to be vigilant of the placement of the stop loss and the level of profile to be gained. consequently the reversal of the market towards the opposite direction
please subscribe to receive more analysis
ASMN trade ideas

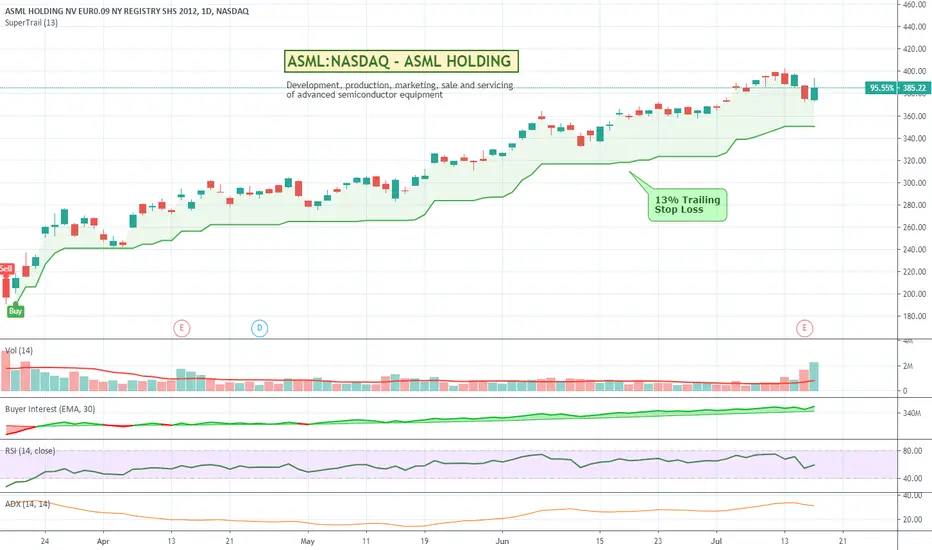
ASML:NASDAQ - ASML HOLDING - Up 95% since Covid reset.ASLM is in the development, production, marketing, sale and servicing of advanced semiconductor equipment. Nice volume spike post earnings could help make it a stock to watch.
ASML --> POTENTIAL POSITEVE REVERSAL TARGET €335 / $375Strong positive bias --> possibility of a new reversal with target €335 / $375

$ASML: some strength at ATH, but pullback likely dueASML showed weakness a couple of times between $280 and $300, before breaking out.
Key levels:
$309
$295
If these key levels hold, ASML could head higher.
The current price action still show some strength, but not as much as one would like to see at ATH.
This suggests that a pullback is due. It should take some time before the market is ready for another ATH.

ASML - Relative Expensive but can still go up further.ASMA Price to Sales to Ratio during Dot Com Bubble was 15. The current Price to Sales is 10. So, the stock fundamentally need to go up another 50% before reaching Dot Com bubble level.
However, that does not incorporate the facts the growth in revenue and profitability.
The market is telling us that it is business as usual. With more money being printed, more money will flow into equities.
The majority of people will remain poor because they don't have any strategy or plan to ride this wave up. It's all about being emotional and blaming the 1% for every misery they have in life (even though they have the options to open brokerage accounts and buy stocks, unlike majority of people in the world that is unbanked and don't have access to capital)
Stop playing the blame game. Make money from capitalism and do what the fuck you want to do in life.

Positive Reversal ASML -> Target $360ASML Break out; Positive Reversal target $360; strong positive bias

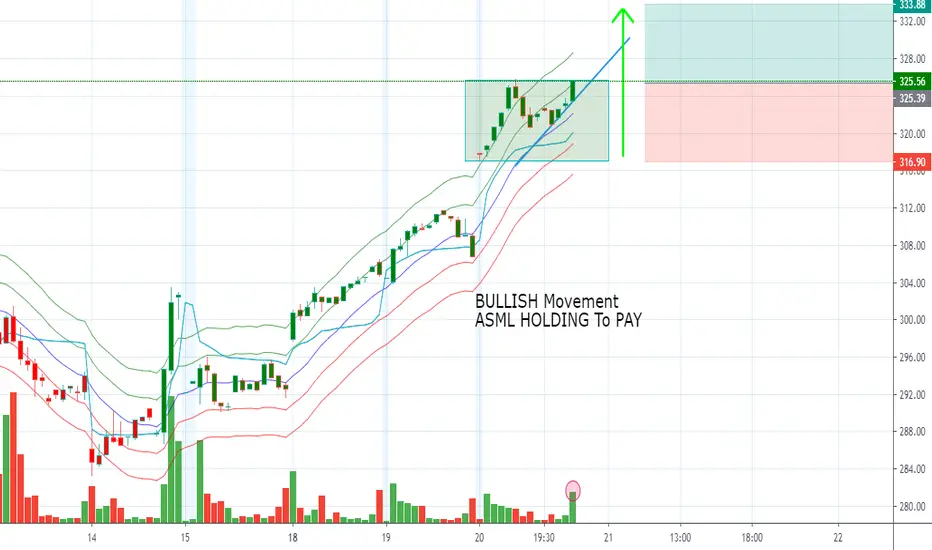
The Movement of ASML HOLDINGHey traders, **DISCLAIMER** content on this analysis is subject to change at any time without notice, and is provided for the sole purpose of assisting traders to make independent investment decisions. ASML HOLDING is in a good uptrend to see if it breaks its resistance.
Please LIKE & FOLLOW, thank you!

ASML buying opportunity As shown in this TA, ASML just broke out of its downtrend, just bouncing off the support on its way back up again. Furthermore, the RSI has restored to a rather neutral position.

ASML weekly trend about to flip bearishI’m short ASML as of now (271.90) weekly is maxed out and showing s lot of bearish signals. Looking to short it down to 208 as main target.
Let’s see what stock gonna bring

ASML: Sort opportunityAn intraday high potential, Back Tested Sort Analysis.
We ll try to enter into the correction of the uptrend movement.
DETAILS ON THE CHART
NOTE: Entry range area above the entry point, is calculated upon 80% of the recorded pullback back tested past performances
DISCLAIMER: This is a technical analysis study, not an advice or recommendation to invest money on.

ASML Pullback strategyASML May sell off a bit until 240 into support
Nov 15 EXP, Cheap spread 250/240 $2.84 Max risk is $1.5 if it stays at this level.
Max gain is going to be $3.

ASML holdings in breakout. ===target price $280 - Entry level $240====
Company Profile
ASML Holding NV engages in the development, production, marketing, sale and servicing of advanced semiconductor equipment, consisting of lithography related systems. It mainly caters the makers of memory chips and logic chips. The company was founded on April 1, 1984 and is headquartered in Veldhoven, Netherlands.

ASML (Heading towards $300)ASML Holdings is a parabola, an aggressive one and next target will be $300.

Achat - ASMLLe titre ASML passe au dessus d'un important overlap à 190 ,70€ et avec une bonne impulsion, nous anticipons une continuation de la tendance avec:
TP=235,50 €
STOP= 190 €
Ratio = 2

ASML - Short - PT $ 130 - $100Double top. Pattern shows correction ahead!
Semiconductors like Intel dropped also! AMD is also next to drop.
ASML Price target: $ 130 - $100

ASML nice gap up in after hours session!!ASML actually it's a stock traded on more then one market thus does not have the best price action ever especially for a swing trade, but for studying purposes and with earnings today I would like to make a little review. Gap in after hours sessions breaking and consolidating above previous pivot at 203.65. The shares traded in after hours session around 800K would predict if broke and consolidate above 209.44 (next coming pivot) a nice move all the way up to 221. Earnings, volumes and price action are there hopefully it will work nicely!!!


BREAKOUT OPPORTUNITY!!!NASDAQ:ASML Buy above $178.25 after a pullback.
Please like and comment if you like my ideas. THANK YOU!!!
Please note that this information is not a recommendation to buy or sell. It is to be used for educational purposes only.

ASML LONG on TrendlineA Clear trendline from the bottom of 2009 to the bottom of 2016 to the bottom current at 2019.
If it holds then we could see a nice uptrend, if not then we could see a loss of 50% of it's value.

WATCH FOR POSITIVE REVERSAL ASML HOLDING This company produces machines for leading semiconductor chipmakers (memory & logic) in the world. Still a very positive outlook for the future. Interesting if the recent fall can hold and positive reversal in weekly chart can be a strong buy possibility.

[ASML] Phase 4 began 2 months ago -> Don't buy!The price is below to MM30 and it's clearly a phase 4, the RSI is low so don't buy.
