AXP| Strong Bearish Scenario; Go Short!If you find this technical analysis useful, please like & share our ideas with the community. Coming to the technical analysis of AXP American Express , I think we are going to strong bearish movement. If you are going to go short, make sure to place the stop above the previous rejection area .
What do you think is more likely to happen? Please share your thoughts in comment section. And also give a thumbs up if you find this idea helpful. Any feedback & suggestions would help in further improving the analysis.
Good Luck!
Disclaimer!
This post does not provide financial advice. It is for educational purposes only! You can use the information from the post to make your own trading plan for the market. But you must do your own research and use it as the priority. Trading is risky, and it is not suitable for everyone. Only you can be responsible for your trading.
AXP trade ideas

AXPI must be losing it, time to go to bed. You see that 1k 2034 target idea!! We love debt but that's wild. Besides that, it broke out of the ascending channel, the next stop should be the top of its MACRO ascending channel. Should double in price. Cheers!

American Express (AXP) bearish scenarioThe technical figure Channel Up can be found in the US company American Express (AXP) at daily chart. The American Express Company is a multinational corporation specialized in payment card services. The company was founded in 1850 and is one of the 30 components of the Dow Jones Industrial Average. The Channel Up has broken through the support line on 27/11/2021, if the price holds below this level you can have a possible bearish price movement with a forecast for the next 57 days towards 141.13 USD. Your stop loss order according to experts should be placed at 189.03 USD if you decide to enter this position.
Risk Disclosure: Trading Foreign Exchange (Forex) and Contracts of Difference (CFD's) carries a high level of risk. By registering and signing up, any client affirms their understanding of their own personal accountability for all transactions performed within their account and recognizes the risks associated with trading on such markets and on such sites. Furthermore, one understands that the company carries zero influence over transactions, markets, and trading signals, therefore, cannot be held liable nor guarantee any profits or losses.


American Express - BreakoutAXP moves and forms new based at every 20$. i.e 90. 112,136,160,180, 200
It took 30-50 bars to move from 1 level to another.
Gap up and breaks 180 resistance after earning report.
MCDX Banker spike settling at 50%
Strong Uptrend, Bullish and Strong Bull.
Plan:-
Wait for pullback to at least close the gap around 180 for trade decision.
Below 179 is tight stop loss. Another option is below 167

AXP Weekly Options PlayDescription
A close < 176 triggers a short position.
Using expiration two weeks out for a little additional time on this slow mover.
Put Debit Spread
Levels on Chart
SL > 176
*Stops based off underlying stock price, not mark to market loss
The Trade
BUY
11/12 172.5P
SELL
11/12 157.5
R/R & Breakevens will vary when filled.
The long put is placed ATM for higher chance of profit,
Short put is placed at the support established in August - September.
Always implement proper risk management
Only invest what you are willing to lose

AXP - Needs to come down moreAXP - Daily/Weekly H&S setup with weekly EMA cloud turning over to red. MACD cross down. Currently holding the 10/15/21 160P but will be buying the 11/19/21 160P for additional contracts if it decided to bounce higher but remains under stop loss.
Entry: Between now and 167.15
SL: Just above 167.15 on daily candle close
PT: 131.15 - 140.25

10/24/21 AXPAmerican Express Company ( NYSE:AXP )
Sector: Finance (Finance/Rental/Leasing)
Current Price: $187.08
Breakout price trigger: $179.70 (hold above)
Buy Zone (Top/Bottom Range): $183.20-$177.20
Price Target: $193.00-$194.40 (1st), $216.00-$218.00 (2nd)
Estimated Duration to Target: 21-24d (1st), 94-101d (2nd)
Contract of Interest: $AXP 11/19/21 190c, $AXP 1/21/22 200c
Trade price as of publish date: $3.50/cnt, $4.13/cnt


American Express : Good prices to buyAmerican Express best stock to buy at current levels with maximum downside upto 162...may see upside of 20-25 percent in next 6 months

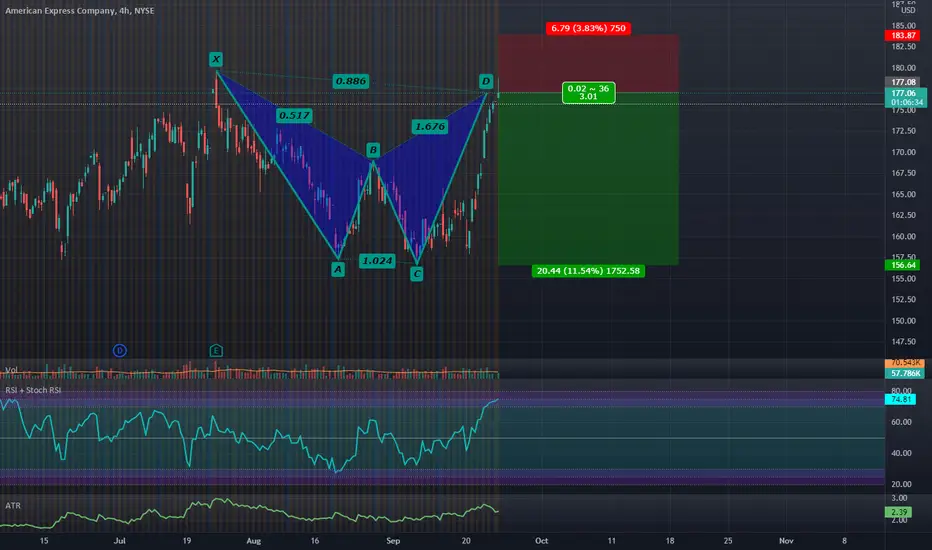
4 Hour RSI Overbought at PCZ Of Bearish SharkI have my stop above the 1.13 fib extension and will be looking to buy reasonably striked puts expiring around November and December
American Express: Potential upward movementExpecting the price to move more upward due to increasing buyer volume.

AXP, process of topping?AXP is one of the Dow30 components.
If the channel is drawn correctly, topping process could be in the making.
Although DJIA is still making all time high
Estimated AXP can push upwards towards 185 - 190, stabilizes and retrace to ~140, and if 140 fails to support, next level is around 95
Worst case scenario will be 65 which is highly unlikely
It is purely my own analysis which should not affect your own decision to invest or not invest


American Express (AXP) bearish scenarioThe technical figure Triangle can be found in US company American Express Company (AXP) at daily chart. The American Express Company is a multinational financial services corporation best known for their credit business. The Triangle has broken through the support line on 14/08/2021, if the price holds below this level you can have a possible bearish price movement with a forecast for the next 6 days towards 159.47 USD. Your stop loss order according to experts should be placed at 171.70 USD if you decide to enter this position.
Risk Disclosure: Trading Foreign Exchange (Forex) and Contracts of Difference (CFD's) carries a high level of risk. By registering and signing up, any client affirms their understanding of their own personal accountability for all transactions performed within their account and recognizes the risks associated with trading on such markets and on such sites. Furthermore, one understands that the company carries zero influence over transactions, markets, and trading signals, therefore, cannot be held liable nor guarantee any profits or losses.


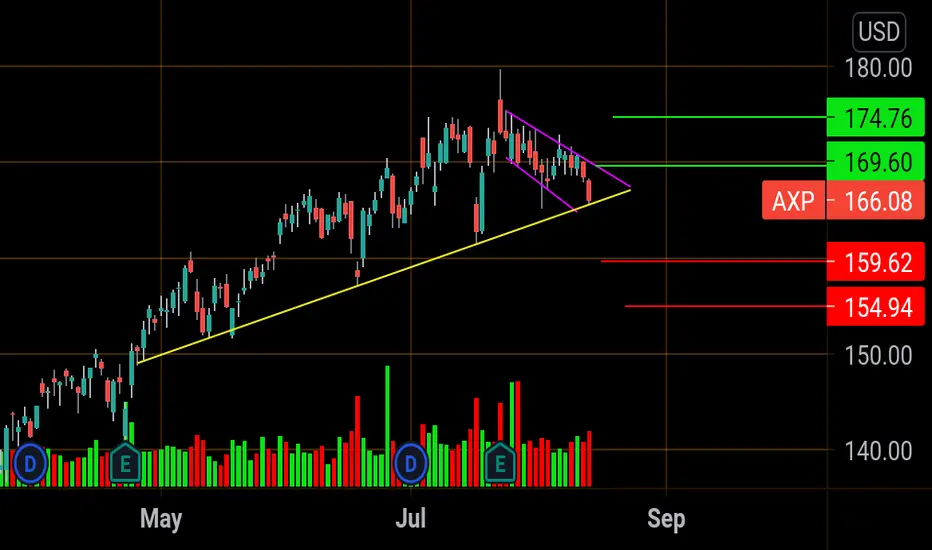
AXP at a pivot
Closed Below 50 ma today but bounced off trendline (Yellowline ).
Has been trading inside this many channel (Purple lines) ever since its last earnings.
green lines -Long targets
Red lines - Bear targets
Short entry - Below 165.41
Tp #1. 159.62 (Fib support , 100ma daily, 20ma weekly)
Tp#2. 154.94
Long entry - If it bounces off yellow trendline id go long up until Purple channel resistance at 169.50. If it gets rejected, cover. If AXP breaks through 169.50 go long up to 174.

Correction = overbought.Price correcting to the top to form a double top. Waiting for candle formation to short.

AXP (Short it)Fell thru weekly support. wedge pattern
20% retracement expected .
Wedge can be seen on RSI.

Amex Trade IdeaStock is in upward trend
I recommend buying at 164.51 with stop loss at previous higher low i.e. 162
Target to be determined

