BA - Breakout from rectangleUpside target still remains 230. Clear view of risk/reward....great setup.
BA trade ideas

BOEING looks ready to explodeBoeing looks technically good and after so much consolidation, it is ready to breakout. Risk to reward ratio is amazing and very less risky trade.

$BA LONG SETUPBoeing has held its $190 support for about 3 months now but has held below its $230 resistance as well. We are now near the midpoint of this range and seeing a bull flag forming on the daily chart with the 50DMA and 20EMA curling upwards. Look for a breakout Monday or Tuesday for this trade to flourish.

Boeing - Cup and HandleThe overall market continues to digest an increasing rate environment. The S&P retraced to the Golden Mean and quickly reversed into a choppy zone, driven by the surprise jobs increase. The CPI /PPI for January is up next. This is creating the Super Bowl of Bond Yields as the 10Y has been making bull moves toward the .214 Target, above 2.0%, of the Weekly iH&S break-out. Boeing is showing a reversal pattern with a Cup and Handle , confirmation would include a break and a back-test of the handle with volume .

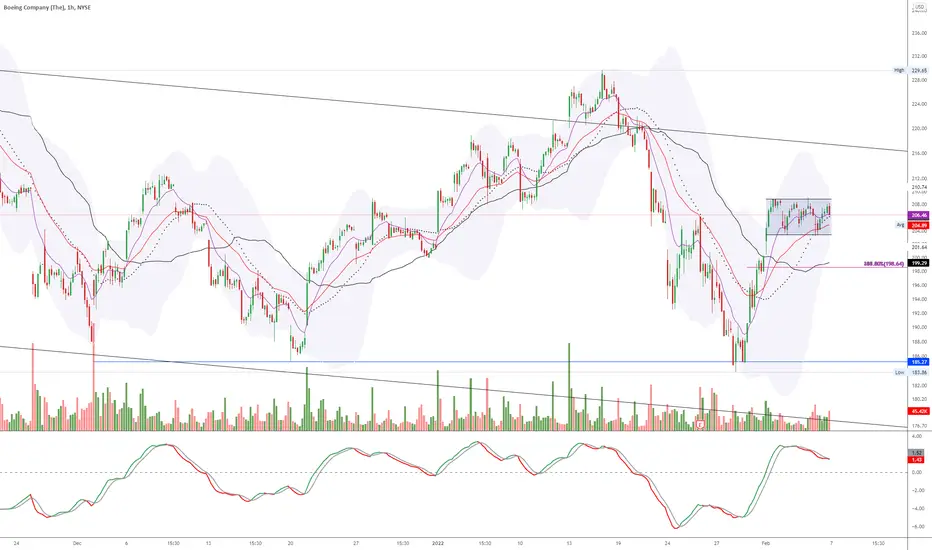
BA Smush ZoneBA smush zone setup I still really like - will need a close over 209 for the bulls, a close under 203 for the bears to try and get a good swing in either direction - you can also top fish/bottom fish against those to try and better the position
Bull target 218, with swing potential to 230, 252

strategy for BA for monday 02/07/2022BA: entry to buy above ( 210.00 )
BA: entry to sell below (203.00) support area (201.25)
Strategy: In case of a bullish opening above (210.00) our possible profit taking is close to the 200 MV daily chart area.
bearish entry: below sell price (203.00) and support (201.25). above the sell price is a buy zone.

BA - Bullish rectangle on 1H Charttight price action in the previous sell-off zone. perhaps some news is on the way to push this to 216 and 220.
Upside target - 220
Downside - 200, 192
Took a Chance! With BA I generally play price action. I spent some time last evening modelling it in SPSS for intra-day trading (I have a long term regression model of BA already). Came out with some intra-day price target regression formulas. I did some testing last night but got tired and went to bed. Today, I decided to try them out IRL (Which I usually never do without fully testing!) and man, pretty spot on!
My lows (where I was looking for support) were 202.16.
When it hit 203 for the second time and I saw that V shape pattern being respected on the 3 minute chart, I got long.
My price target was 208 based on the formula. It was touchy at first, it looked like it wasn't going to make it! But it did! YAY! :D IT WORKS!
If you're interested here are the formulas:
Low: y = 0.9798x + 1.2992
High: y = 0.9847x + 6.5212
Where X = open price.
So for today, projected low would be:
Y = 0.9798(205) + 1.2992
Y = 202.16 (Projected)
My aim was :202-203
Actual: 203.28
My projected high was:
y = 0.9847x + 6.5212
= 0.9847(205) + 6.5212
= 208.38
My aim: 207.90-208
Actual: 208.24
Have a great weekend everyone!

Failed reversal on top of missed earnings BA was set up for a nice run after placing a double bottom in at 188. Rejected from the 200 day, showing signs of breaking down now. Expecting a possible bounce to 200 from here, but keep an eye for a stronger downside move.

It’s time to fly with BoeingI have waited quite a while for Boeing to look like a buy and i believe it’s time. The falling wedge has showed slowed selling into support and fib’s 382. Monthly and weekly stochastic are also converging to upside. The safe thing to so may be to wait for the wedge to break, but I am of the belief that the time is now. Also, I have considered $XLE breaking out already and see $BA following suit.
Not financial advice. I have linked my past Boeing charts.
Happy Trading.

strategy for BA Thursday 02/03/2022BA: bullish entry above ( 209.00 )
BA: bearish entry below ( 203.00 )
strategy: in case the opening is above ( 209.00 )
possible profit taking in the area of mv 200 daily chart
bearish entry: we will only enter to sell below ( 203.00 ) not before

BA levelBA looking good for a move from 210--> 220 area, also triple bottom formed on daily. Should be a good move with people buying. Weekly looking like its at bounce spot also

$BA - channel break out watchWhat a month! It basically reshaped the chart. BA is in descending channel and heading towards the upper trend line. Breaking above the $220 will confirm the pattern break out and could propel the stock towards $260.
Target 1 - $220
Target 2 - $242
Target 3 - $260
Risk - Rejection from $220
———————————————————
How to read my charts?
- Matching color trend lines shows the pattern. Sometimes a chart can have multiple patterns. Each pattern will have matching color trend lines.
- The yellow horizontal lines shows support and resistance areas.
- Fib lines also shows support and resistance areas.
- The dotted white lines shows price projection for breakout or breakdown target.
Disclaimer: Do your own DD. Not an investment advice.

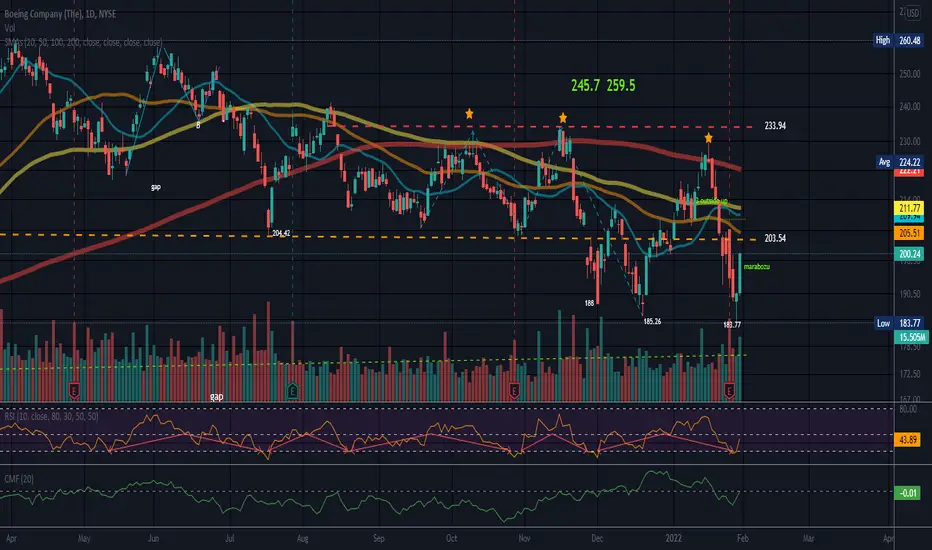
Rectangle/Triple BottomBA broke to the downside from what appears to be a rectangle which is a horizontal trading channel and price stayed in it for quite a while before breaking down. Consolidation patterns like rectangles and triangles will eventually break one way or the other. The bottom of that rectangle was support, which is now resistance.
Probable triple bottom with the last bottom being the lowest of the 3. I would place my stop below this lowest bottom and tuck it away somewhere safe where Mr. Market can not find it if I wanted to hang long term..
This particular stock has been struggling for quite some time it seems.
Bullish Marubozu candle today with both heads being shaven.
Price needs to re-enter rectangle by breaking that former support line which is now resistance and break through top trendline of 233.94 for a longer term type long entry. Some would swing this inside the rectangle if it does not make it through the top trendline. But price has not made it back in to the rectangle yet. There is a suspicious top inside the rectangle marked with orange stars.
BA is opening a little bit lower tomorrow but there was a big gain today.
Short interest is low/less than 1%. Earnings 4-27 BMO.
Price is below all of the longer term moving averages. The 20 is trying to tilt upward. The 100, 50 and 200 definitely need some work.
No recommendation.
An airplane takes off against the wind and not with it.
We know what to do here..I was not going to post this one... but decided, ehh.. why not. I think we know what to do here. I will be jumping in this morning pretty quickly... I think the smart people can see it. Watch and lean how it's done if not... like my stalker boy who will be getting a knock on his door and a little wake up call.

$BA if this is a bounce...Then the next stop is about $225 and we stay in this range, you don't really need to be bullish, just believe that this stays in this range. It could have gone all the way down to $175, but held low $180's and now looks to be making the next push back up. A lot of psychological marks to get through though, $200, $205 $210 etc. Unless we get a big news item (like this Qatar deal) that helps big buying, maybe we can push through several in one day.

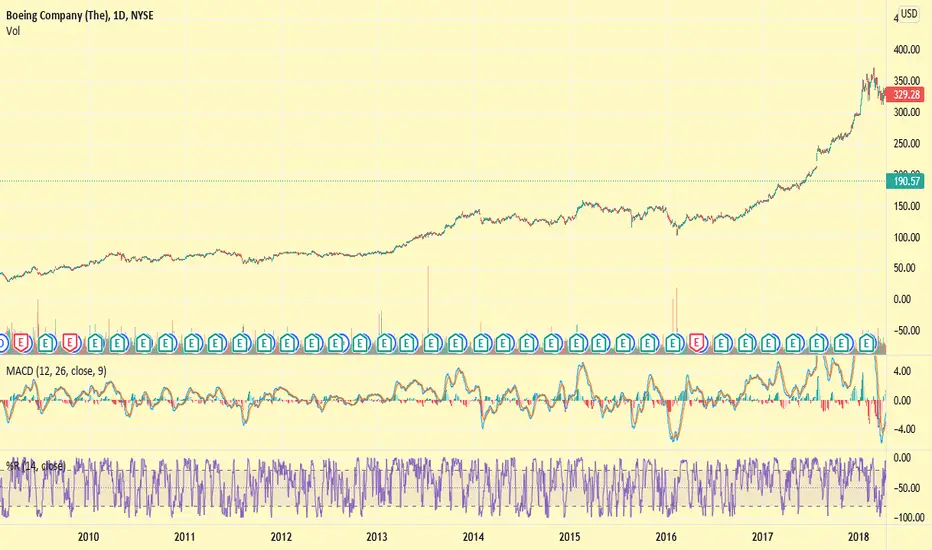
BA: What Traders Are Missing About Boeing (pt. 6)From early 2017 to March of 2019 Boeing went soaring to almost 3 times the price from $150 to $440, but why? People were traveling more than ever, planes needed to be replaced, new technology was increasing profit margins. There were numerous reasons to be long transportation stocks, especially Boeing. Boeing was king and had the shiniest bike on the block. Every airline wanted what Boeing was putting out! Then came the fall of the MAX. Two crashes in 6 months and airlines lost all their confidence in Boeing's new commercial airliner. Hundreds of planes grounded in 24 hours and Boeing was now under the microscope by every airline and Government travel safety authority. Boeing's reputation was destroyed. There's a great quote by Warren Buffet, "it takes 20 years to build a reputation and 5 minutes to ruin it." That is exactly what happened to Boeing.
So...let's look at the numbers!
As it stands currently, Boeing's revenue is LOW. We are talking 2010 low. They've taken off a 35% haircut in annual revenue since the glory years of 2017- early 2019 and have repeatedly reported negative earnings. What people fail to realize in Boeing is that (like NVDA) stocks get hyped up and people flood their money into stocks irrationally. Boeing was just the next target for this buying frenzy. Before the major run-up Boeing presented better earnings and was AT BEST a $140-$150 stock, so why are traders thinking it'll go back to above $300? Could be they don't know any better, could be they believe BA will go back to it's former glory days in a matter of a few months, could also be that their just brain washed "BTFD-ers". Any way you look at it, BA isn't that shiny bike anymore and all it's luster has faded. Sure numbers will pick up eventually, but it'll be a long time before we ever see Boeing above $300 again. If BA is going in any direction it's back to $100-$150 or even lower.
Not financial advice

strategy for BA monday 01/31/2022BA: sell zone ( 206.00 ) ( 204.00 )
uptrend start above ( 192.00 )
BA: buy zone ( 185.00 ) ( 184.00 )
bearish continuation below ( 183.00 )
strategy: bullish entry above (192.00) possible profit taking next sell zone. As always the market has the last word.

Just wait two months for BA!Not sure how much it will go up when it does but if that past chart is any sign, it will most likely go up past the 230 mark as it is trending upwards. Nothing can go down forever and a loss isn't a loss unless you sell!

Get ready for take offBoeing has been a sell for some time now and as we approach the 382of the structure shown i plan to go full bull.. be patient....
i have link past boeing ideas
happy trading

Short BA (Pt. 5)Boeing missed earnings and it wasn't even close. Follow the chart and draw the lines on your own chart. Once BA falls below that line, expect a fall to the 3.618 fib retracement level ($155). And @ktaba in the words of the Ukuk-hai from LOTR, "MEATS BACK ON THE MENU, BOYS!"
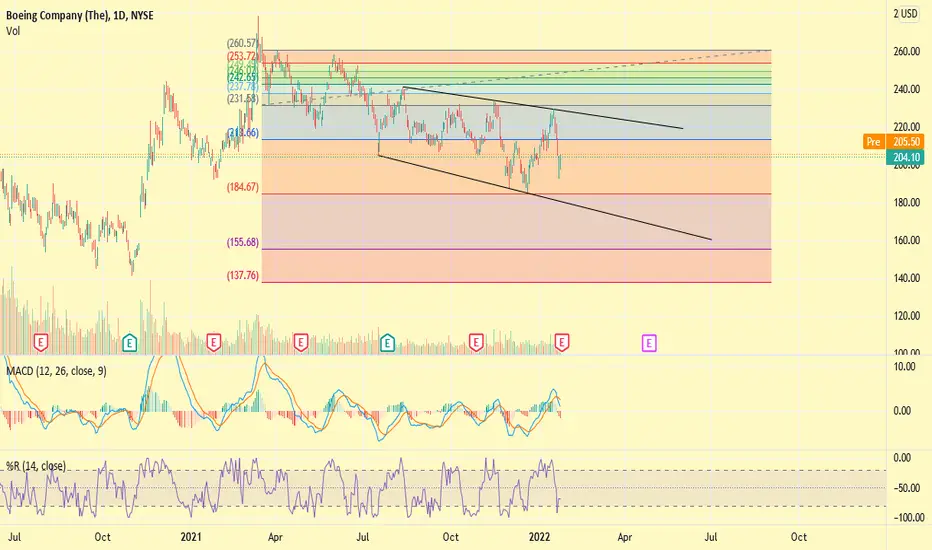
$BA - Can we see it as trend line retest?In my previous chart, I mentioned that BA could play out double bottom and it did.
Since then, BA has pulled back and now retesting the descending wedge. Will it bounce from here, or will it break down like it did before?
It seems $230 area has been painfully stubborn area.
If it bounce from here and break above $210, there is a chance that it can see $230 again. If by some miracle, it breaks through $230, we can expect $245 area.
On the other hand, if it breaks down from here, it can revisit $185 area.
It's all depends on whether we stay above $199 or breaks below it.
Bullish target 1 - $230
Bullish target 2 - $245
Bearish target - $185
Earning on 01/26 (tmr) will determine if we see $230 or $185. We won't have to wait long.
———————————————————
How to read my charts?
- Matching color trend lines shows the pattern. Sometimes a chart can have multiple patterns. Each pattern will have matching color trend lines.
- The yellow horizontal lines shows support and resistance areas.
- Fib lines also shows support and resistance areas.
- The dotted white lines shows price projection for breakout or breakdown target.
Disclaimer: Do your own DD. Not an investment advice.
