Citigroup - nice catch a wave hi,
looking on ticker c Citigroup, I see positive move up, I don't know if it is a long wave up or a short term but, I hope that we will go to 56 USD or 60 USD.
There are rates from FED to be raised and as we know banks will increase their income with the rising of them.
Also the stock is undervalued, and we see that there is long term of accumulation of it and moving in the same range.
Please be advised that this type of stock is one of the "biggest" one in the NYSE. In long therm I hope to gain some money on it.
Like always we can see "play" of algorithms and computers - it likes to play with SME - moving average in range M15 and H1.
I hope that it will help.
Look on it in long term.
it is not a investing advise, it is only my opinion, please do not consider it in the light of law for any advise how to invest your money, it is your risk and your luck.
CITI trade ideas

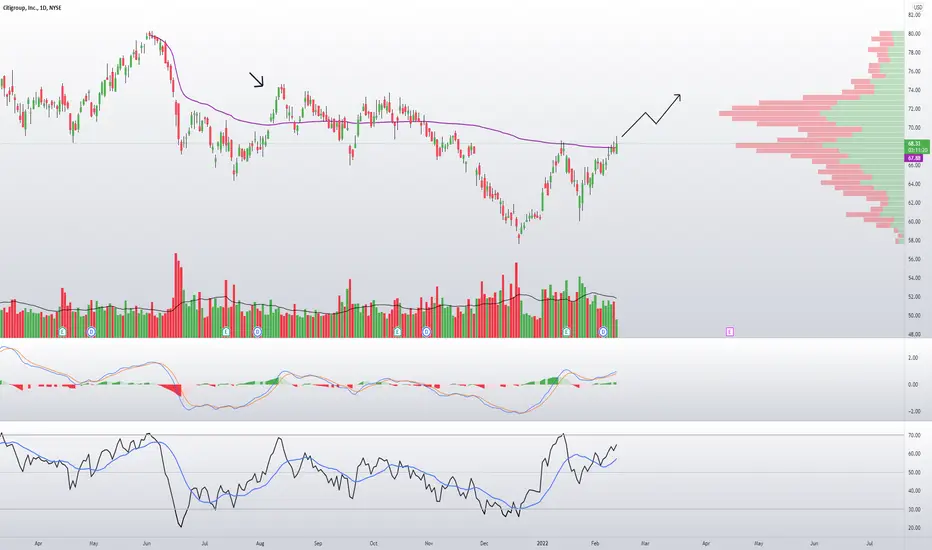
Citigroup, Inc. Bank Stocks to BuyMACD shows a bullish confirmation.
Traders can buy stocks when the price breaks above the downward sloping resistance line.
Target price is defined by Fibonacci retracement 50% level.
Position: LONG

$C with a Bearish outlook following its earnings #Stocks The PEAD projected a Bearish outlook for $C after a Positive Under reaction following its earnings release placing the stock in drift A with an expected accuracy of 33.33%.

CMID-TERM: Bullish cypher with double bottom at PCZ, 4hr and daily classic bullish divergence, wedge breakout. (not financial advice)

C BUY - 50, TP - 58, SL - 47Citigroup Inc (C)
Report on 14.04.2022 banking
BUY - 50
TP - 58
SL - 47
The idea is more based on technical analysis. At present the price stands on the cross of two support lines and we can see oversold Stoch. Thats why i am waiting for at least a speculative bounce in the region of 58$.
Macroeconomic issues, such as raise of FED rate, inflation, recession risks, Ukreaine-Russia conflict, to mind mind are mostly priced in, as we have experienced 25% decline since last quarterly report.
Fundamentials on bank itself:
+ The bank is evaluated at 60% of its book value;
+ Dividends of 4% - the highest yield among top 5 US banks
+ Beating analysts' forecasts of 4 quarters in a row
- Increase of operational expenses
- Risks of closing business operations in Russia
Conclusion:
In the ideal scenario the idea will come true if tomorrow's quarterly report is stronger than expected. But in the same time You should be ready to hold the stock for a little while in mid or long term.

CITIGROUP - SHORT TERM BULLISH SCENARIOCitigroup Inc is expected to release Q1 earnings on Thursday before the market open.
The forecast is for 1.51 EPS and 18.32B revenue.
On the chart, the price is above the support level of $49 near the 0.618 Fibonacci level
Strong results will push the price to the next resistance of $56.30.
In case the investors are not satisfied with the report retest of the support level will be inevitable.
Risk Disclosure: Trading Foreign Exchange (Forex) and Contracts of Difference (CFD's) carries a high level of risk. By registering and signing up, any client affirms their understanding of their own personal accountability for all transactions performed within their account and recognizes the risks associated with trading on such markets and on such sites. Furthermore, one understands that the company carries zero influence over transactions, markets, and trading signals, therefore, cannot be held liable nor guarantee any profits or losses.

CITIGROUP: earnings coming soonNext week will be published the US most important banks earnings and among them, Citigroup is for sure the one with the best focus. In particular, the US bank is the one with higher exposition in Russia: almost 10 billion dollars.
So, what can be the next scenario?
I'm short on CITI due to both fundamental reason and technical reason:
We are in a short trend, so basically, being trend follower, I will search for retracement to be in.
CCI oscillator gives long signal plus bullish divergency on the price. This can give the necessary boost to the stock to retrace up to 56-58 dollars before getting back to its lowest price.

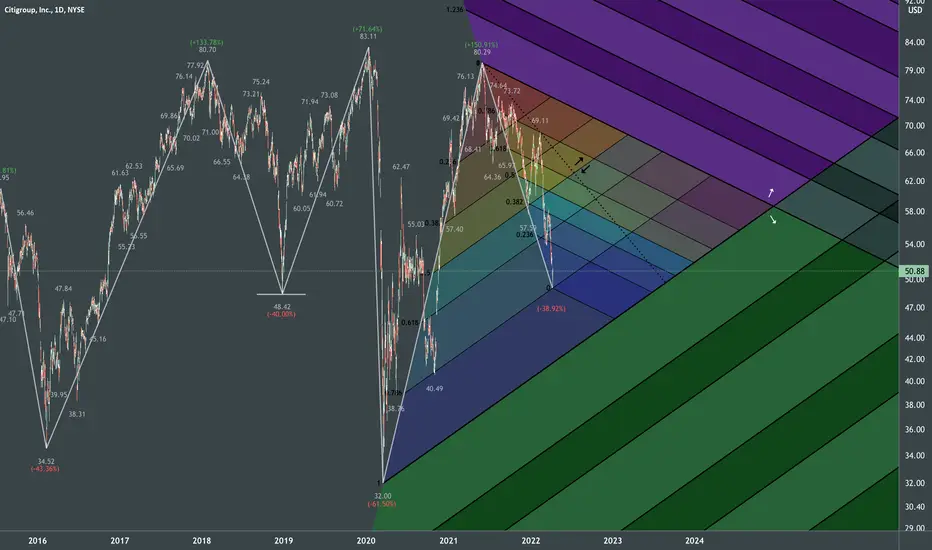
Citigroup Inc Fractal MapFractal analysis based on recent notable impulsive and corrective waves. Angle of fibonnaci channels are adapted to general volatility that makes up triangle which indicates the timing.
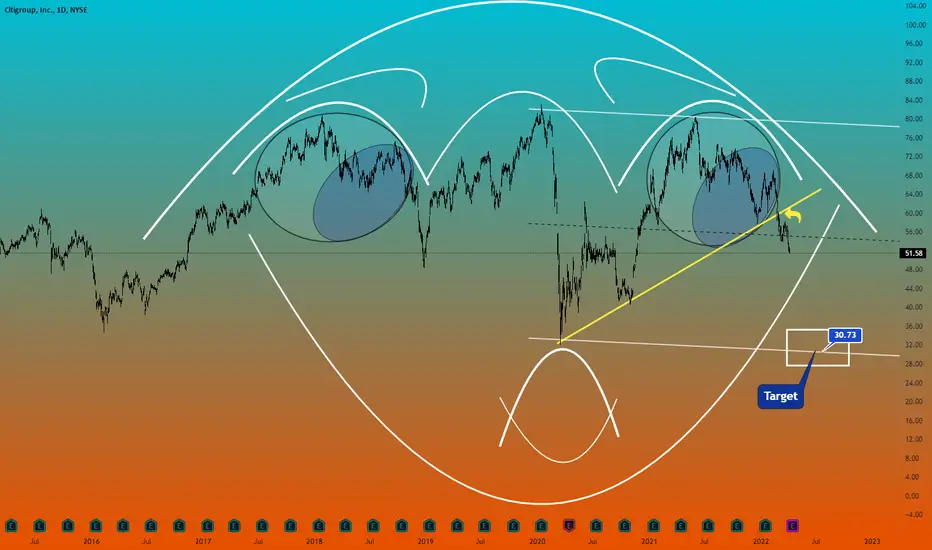
CiitiGroup Bank UpdateBank Stock Charts Not Looking Good
Trendline break as noted on chart
Target box with approximate price level


10-20%Risk long CitiIn this week you can share a small amount from your risk in Citi reversal.Hold from one to 3 weeks.

Citigroup going to town. CShort term only. NFA
Goals 66, 69. Invalidation at 57.
We are not in the business of getting every prediction right, no one ever does and that is not the aim of the game. The Fibonacci targets are highlighted in green with invalidation in red. Fibonacci goals, it is prudent to suggest, are nothing more than mere fractally evident and therefore statistically likely levels that the market will go to. Having said that, the market will always do what it wants and always has a mind of its own. Therefore, none of this is financial advice, so do your own research and rely only on your own analysis. Trading is a true one man sport. Good luck out there and stay safe

CITI GROUP FORECAST MEDIUM TERMHello,
Citigroup currently trading at ($59.23) is trading below our estimate of fair value ($77.38). I however set a target of USD 92.42. earnings are expected to be released in the next few days (14th April 2022) for the period ended March 2022.
I still continue to look closely the impact of the banking system being used as a weapon of war in the Russia-ukraine crisis.
Also key to look at is the impact of the global commodities rising on the banking stocks.
Good luck.

C Citigroup Long IdeaCitigroup recently broke through swing high AVWAP implying a nice chance for more upside.
I'm in May 70/75 Debit Spreads here to play any run up to ER as well.
Looking for a move similar to AUG price action .
Rejection at AVWAP invalidates the trade . Emergency FED meeting and rate headwinds, along with Russia and Covid - keeping positions small and respect stop losses !
$C - Breaking outCitigroup has had some management and policy errors (IMO) over the last several years but this consolidation has been going on for a long time. This is always nice to see and you can have a stop around $60-65 depending on risk. I think if it drops back to 65 it will continue lower so not a bad stop. GLL
This is not intended as a recommendation to buy or sell. It is for informational purposes only.

$C Key levels, Analysis & Targets$C Key levels, Analysis & Targets
Positively impacted by Fed interest rate hike.

CitiGroup Monthly Chart.Bullish Cup and Handle. Bull above $70ish, Super Bull above $80 to complete reverse H&S.

$C with a Bullish outlook following its earnings #Stocks The PEAD projected a Bullish outlook for $C after a Negative over reaction following its earnings release placing the stock in drift C with an expected accuracy of 100%.
If you would like to see the Drift for another stock please message us. Also click on the Like Button if this was useful and follow us or join us.

Short Citigroup regarding channel!Short the C regarding descending channel and ichi leading span B.
Take profit at around next level.
Enter the market between 66.00 to 67.81

Citigroup Is Seen to Have an 18% Upside PotentialJPMorgan, Citigroup and Wells Fargo are going to publish their quarterly earnings reports on Friday.JPMorgan’s Earnings per share (EPS) is expected to be at $3.03 and its revenue is forecasted to be $29.89 billion.
Wells Fargo is expected to report EPS at $1.12 and revenue at $18.9 billion, while Citigroup is seen to report EPS at $1.38, and revenue at $16.75 billion.According to Refinitive polls the strongest upside potential is expected to be seen from the Citigroup stocks at $80.47 per share, or with an uprise of 18.72% of the current prices.
Let’s look closer at the technical incentives of this possible spike. Firstly, stocks are moving within the upward trend that started in March 2020, and the last time this trend line has reached was at the end of 2021. The recent upside wave started on December 20, 2021.
However, the upside potential at the moment is limited by the resistance line of the junior downside trend from February 2021. This junior trend was approached by the price from the downside for the fourth time. This increases the chances of a possible breakthrough. Once successful, if the price surpasses the $68.70-69.00 area, it would lead the price to the previous highs at $80-83 per share. The last time Citigroup stock prices were located at $80.29 and at $80.70 was in June 2021 and January 2018 respectively. The all-time high for the stock prices was established at $83.11 in January 2020.
So, technically there are no reasons to stop the climb after stock prices would break above $69.00 per share. However, even the ongoing attempt of a breakthrough would be less successful this time so Citigroup stocks should not be left behind, as they may perform a short downside correction to $64.50-65.00 to the crossing of the EMA21 and EMA55 moving averages on the daily chart. From this zone buy operations could be resumed as the next attempt of an upside breakthrough could finally succeed.

c buyc buy .. buy after the break above the resistance level and 200ma at 68.90 .. target point 73.19 .. possible target 79.00 ..

