COSTCO: $COST PPI reading optionsI am quite bullish on Costco wholesale, they have show amazing growth this year to date and continue to demonstrate strength in the retail world. I am bullish regardless of the reading in the long term. I beleive we have to case scenarios for NASDAQ:COST
Option 1: Good Reading, will casue this stock to continue to pump up about 1-1.5%. This could create enough momentum to complete the butterfly pattern.
Option 2: Bad Reading, will cause the stock to drop and fill the gap at 714. This could present an excellent long opportunity if the double bottom plays out correctly. Timing and patience will be key before we start our accension upward.
I will try my best to update on this. be smart, be patient, and trade on!
-Whales
COST trade ideas

$COSTLong above weekly Cloud trim at resistance. Get involved again on a daily close over resistance
- Call debits to allow it to wiggle or 2 weeks Delta 35-50

COST broke the trendline, now it is going to go downCostco stock fell 7%+ today, breaking the overall trendline on the D and 4H graphs. I predict that it will have a green day on Monday because the market will retest/correct itself, and after touching the R1 price on pivots (Fibonacci), we can short COST. With a risk-reward ratio of 1:3, less risky traders can exit at a given price in the image, and if you can hold more, the exit price would be $671 (but don't do this because if the overall market is up, COST will have a hard time touching this FVG).

$COST Misses Holiday-Quarter Revenue ExpectationCostco ( NASDAQ:COST ) missed Wall Street’s revenue expectations for its holiday quarter, despite reporting YOY sales growth and strong e-commerce gains.
NASDAQ:COST Shares fell about 4% in aftermarket trading on Thursday but the stock bounced and surged by about 1.6% in Premarket trading on Friday. The company’s stock had hit a 52-week high earlier in the day.
Earnings per share: $3.92 vs. $3.62 expected Revenue: $58.44 billion vs. $59.16 billion expected
In the three-month period that ended Feb. 18, Costco’s net income rose to $1.74 billion, or $3.92 per share, compared with $1.47 billion, or $3.30 per share, a year earlier.
Costco’s revenue for the quarter increased from $55.27 billion in the year-ago period.
Comparable sales for the company increased 5.6% year over year and 4.3% in the U.S. Excluding changes in gas prices and foreign currency, the metric increased 5.8% overall and 4.8% in the U.S.
Sales of food and sundries, a category that includes snack foods and beverages, were up by mid single digits in the quarter, CFO Richard Galanti said on the company’s earnings call. Fresh foods were up high single digits and nonfoods were up mid single digits.
Ancillary businesses, which includes more service-related purchases like travel, were up by low single digits, he said. Costco’s food court, pharmacy and optical centers were top performers in the quarter and gas was down low single digits as the price per gallon fell.
Costco ( NASDAQ:COST ) has 875 warehouses, including 603 in the U.S. and Puerto Rico. It also has clubs in about a dozen other countries, including Canada, Mexico, Japan and China.
In the second quarter, Costco ( NASDAQ:COST ) opened four new clubs, including three in the U.S. and one in Shenzhen, China. That marked its sixth club to open in China, Galanti said. Two of the three new U.S. locations were Costco Business Centers, which are specifically geared toward small business owners like restaurant operators.
Costco ( NASDAQ:COST ) shares have risen nearly 19% since the start of the year. The stock touched a 52-week high of $787.08 earlier in the day and closed at $785.59, bringing the company’s market value to nearly $350 billion.
Costco's Digital growth
Costco ( NASDAQ:COST ) has made changes to its website to improve the experience for online shoppers. It’s also tweaked its business to be more digitally savvy.
E-commerce sales grew 18.4% in the quarter compared with the year earlier. For example, Costco ( NASDAQ:COST ) rolled out a new mobile app homepage in February, which loads in less than two seconds compared with eight seconds previously — a move he said was crucial since about 60% of its e-commerce business is done through its mobile app and mobile browser.
It rolled out Apple Pay last week to all members online. And it’s adding more merchandise to Costco Next, a seller platform that allows members to buy directly from some of the retailer’s suppliers at a discounted price.
E-commerce sales have also gained momentum as Costco ( NASDAQ:COST ) has gotten better in recent months at touting the value of its online merchandise, particularly for big-ticket items like appliances, mattresses and tires.
App downloads were up 2.8 million in the quarter and and currently total about 33 million, Galanti said.
Membership fees
Costco ( NASDAQ:COST ) has seen more membership sign-ups as the company has cracked down on membership sharing, Galanti said. During the pandemic, he said the warehouse club noticed more people using their mom or dad’s membership card and let it slide. Then, he said, the membership sharing grew because self-checkout became more common at clubs.
Investors have been waiting for Costco ( NASDAQ:COST ) to raise its membership fees for more than a year. The company has typically increased its annual fee roughly every five and a half years. It last hiked fees in June 2017.
But Galanti said the company is not hiking the fee yet. Though he added, “It’s when, not if.”

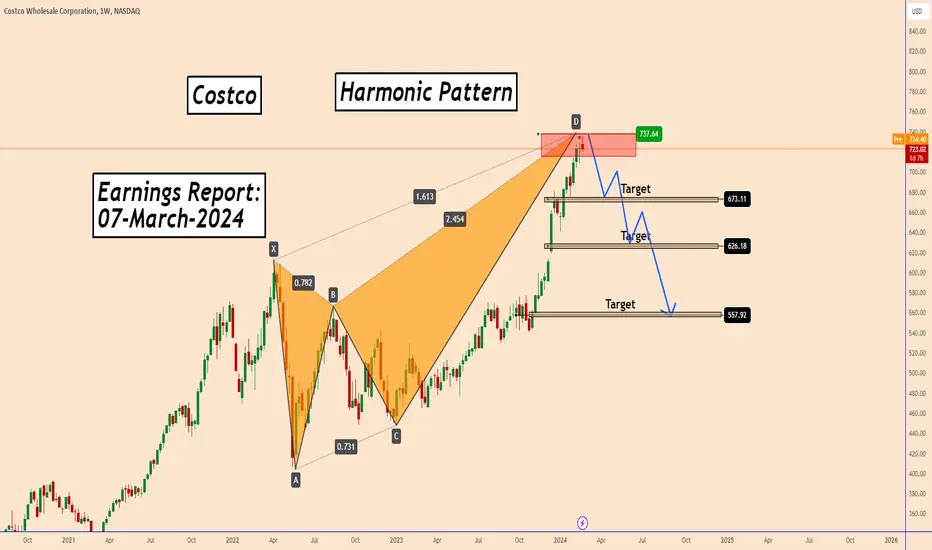
Costco Completed a Harmonic PatternCostco Completed a Harmonic Pattern
It is one of those stocks that since COVID-19 the price increased by nearly +130% and it keeps rising.
So far the price stopped at the pattern completion zone and probably it can wait in this zone for the Earnings report which will be released on 07-March-2024
I am not expecting the price to move down like a rocket
but from this zone near 725 - 737, we can see any correction.
The market participants have to take profits time after time and I think that this is one of those moments, before Costco grows more.
If you are in this trade as a long-term trader it is better to know that we may see any bearish correction.
You may find more details in the chart!
Thank you and Good Luck!
❤️PS: Please support with a like or comment if you find this analysis useful for your trading day❤️
COSTSee chart. Nice Wyckoff spring and markup. The consolidation wave may take until May to wrap. Start hunting quality entries.

Costco About To Complete a Harmonic PatternCostco About To Complete a Harmonic Pattern
Costco looks unstoppable since a long period of time.
It is one of those stocks that since Covid-19 the price increased by nearly +130% and it keeps rising.
At this moment I spotted this Bear Harmonic Pattern.
I am not expecting the price to move down like a rocket
but from this zone near 715 - 737 we can see any correction.
It is normal that someone will take profits time after time and I think that this is one of those moments, before Costco grows more.
If you are in this trade as a long term trader it is better to know that we may see any bearish correction.
You may find more details in the chart!
Thank you and Good Luck!
❤️PS: Please support with a like or comment if you find this analysis useful for your trading day❤️

COSTCO: Potential BuyPrice broke above from the bullish pattern supported by the Ichimoku cloud. I'm expecting the upside momentum to continue. First target around 700 USD.

Watch and wait for CostCost has moved to the breaking target, there is a profit taking signal in the weekly RSI, our job is to wait for the weekly candle to close below 683, we can consider selling Cost shares to the 2 targets below.

Top stock picks for the next years No. 4 Costco WholesaleI am publishing a series of the best stocks with the highest growth rates that I expect over the next few years. Today with the Costco share with a target price of 1024$

COST Symmetrical TriangleNASDAQ:COST
Costco Wholesale Corporation is one of the most successful companies in the US. Costco investors have seen a return of 453% over the past 10 years, while the S&P 500 has moved roughly 206% over the same period.
Despite the impact of inflation, Costco has continually offered lower prices relative to their competitors, yet their net margins are 2.65%, the highest they have ever been.
Technical patterns suggest a symmetrical triangle pattern on the weekly timeframe, which could indicate a retracement to all time highs ($612.27). A breakout and rally is very plausible, with a potential price target of $700.

Looking for a counter trend pullbackCOST has one of the cleaner structures in the market and is a great long term ticker, as well as a shorter term speculative ticker. Ultimately, looking for a wave 4 of 3 pullback toward the .764 extension around 586, which is also heavily supported by the volume profile. Short term bearish / longer term bullish.

The Ghost of Charlie Munger Drives $COST to new highCostco is up 15% since Munger passed away on November 28th.
Market cap rose from $255B to $300B.
Supernatural move. ;)

COST Costco flap and poleHey folks
Back with my signature flag and pole. Not into using crazy indicators here but just pure tech analysis.
COST giving a weekly flag and pole with divergence on macd.
Wait for 8-9 weeks for the next earning season and see it pop. Feel free to checkout my previous ideas and see how they faired.
Leave a comment and a subscribe for more ideas
Cheers
A

COST - seasonality and special dividendsI recently posted about the potential to take advantage of seasonal weakness for $NASDAQ:COST. I'm embarrassed to say that I had lost track of them being overdue to offer a special dividend. Since 2015 they have offered a special dividend every 2-3 years.
Let's look at how the special dividend announcements have influenced sentiment and interacted with seasonal behavior. Recall that COST sees November as an incredibly strong month, and December through February and August as weaker months. But what happens when there is a special dividend?
February 2015 - $5 special dividend
Price surged $13 (9%) between announce and ex-dividend date
Dec-Feb period ended 5% higher
After payment price remained ~$2 higher than close of the announce date until Aug
May 2017 - $7 special dividend
In between seasonal periods. The prior 2016-2017 Dec-Feb had ended higher.
Price increased $10 (6%) between announce and ex-dividend date
Price flattened and then dropped after ex-dividend date
Price increased briefly after payment and then gapped down until November
The following 2017-2018 Dec-Feb season ended slightly higher
December 2020 - $10 special dividend
Price increased $13 (9%) between announce and ex-dividend date
Price dropped after ex-dividend date and was flat by payment date
Dec-Feb ended $57 (14.7%) lower
December 2023 - $15 special dividend
December was trending higher prior to the special dividend announcement
Price has increased $19 (3%) from announcement
There are currently 7 trading days until ex-dividend date
This is obviously a very small sample size. In every situation the price has increased to a level greater than the special dividend in between announcement and ex-dividend date, but corrected by payment date, or shortly after. The special dividend that was announced in the middle of the year saw the least impact on seasonality. The February 2015 special dividend saw a less common strong Dec-Feb period, while the December 2020 special dividend was followed by a weaker than normal Dec-Feb period.
I'll conclude that a conservative approach is to take profit in between announcement and ex-dividend and continue to look for an opportunity to capitalize on potential seasonal weakness in the coming months.

$COST weekly breakoutNASDAQ:COST weekly breakout post earnings. Will look to add if it pulls back to test breakout zone.

For the believer of GOD (Allah)Please it is not a financial advice
I'm sharing my estimated price action
Best of luck,
Your fellow brother 😁

$COST Keeps the Momentum going Despite Market Volatility Despite market Volatility NASDAQ:COST is exhibiting a bullish bias based on the following indicators:
Price Momentum
COST is trading near the top of its 52-week range and above its 200-day simple moving average.
NASDAQ:COST is trading above all of its moving Averages indicating a Bullish Bias.
NASDAQ:COST 50-day Moving Average is above the 200-day moving average also indicating a Bullish Bias.
NASDAQ:COST 50-day Relative strength index is 63.59% higher than the 100-day RSI at 58.84%.
What does this mean?
Investors have been pushing the share price higher, and the stock still appears to have upward momentum. This is a positive sign for the stock's future value.

COST - heading into seasonal weaknessNASDAQ:COST is a core holding of mine and one that I use technical analysis to continue building. I've reported multiple setups to build a cost position and recently shared the strong seasonal outlook for November.
We have earnings after the close on 12/14, a quad withing on 12/15, and a history of seasonal weakness between December and March. I'll take this opportunity to sell some of the position into strength and look for opportunities for additional accumulation over the next 3 months.
Note on the daily chart that we're just above a range that I targeted on the breakout of a descending wedge. We can also see that price has pivoted in alignment to the fib time zones and that the next one is 12/15 (day after earnings and on quad witching).
On the weekly chart we are at the top of a measured range, which has typically signaled the start of a secondary downtrend.

Costco still eager to push up ahead of earningsShares in Costco Wholesale Corp (symbol ‘COST’) reached 18-month highs in the last fortnight amid ongoing strong sales. Recent general positivity in stock markets comes mainly from the likelihood that the Federal Reserve has reached its terminal rate for this cycle and might start to pivot from the second quarter of next year.
Costco’s earnings report for the financial quarter ending in November is expected on Thursday 14 December after hours. $3.44 is the consensus EPS: the 15 estimates range from $3.25 to $3.66. One estimate was revised down in the last four months.
‘One of the negatives for buyers of Costco’s stock is that, considering the sector, its dividend history doesn’t compare favourably with EPS,’ said Michael Stark at Exness. ‘The company’s fundamentals, in terms of revenue, sales, memberships and other numbers, look good, but PE around 40 raises some concern over valuation.’
A double top is visible on the chart; however, this pattern has not completed yet so acting based on it would usually be risky, especially in the runup to earnings. As above for Broadcom, $600 for Costco is an important resistance as a round number which might resist testing without a significant new driver.
The long uptrend in 2023 remains valid for now, but buying the CFD just below an all-time high isn’t a typical approach except for short-term traders attempting to exploit a potential breakout. A retest of the area around $575 might give a better entry for buyers, but that depends on how shareholders perceive the earnings report.

Possible strangle on COSTThis is a "copper condor" not an iron one.
Creating 2 debit spreads that one pays off well IF COST gaps nicely and breakout out of this triangle in a nice fashion?!?!

COST - Short Position Despite the negative news, market has its own mind. Its been only going higher.
COSTCO seems to have ran out of gas, and shorts may be taking over soon. The idea is to get in as early as possible, and get out when the rest start to jump in.
Shorting COST to the $530 area. Since risk management is key, and COSTCO is an expensive stock, Iam going to purchase a debit spread OTM mid Nov expiry, that is suitable to my risk tolerance.
best of luck.

Costco (NASDAQ:COST) Indicating Positive Sign of a Bullish Trend
Costco wants your loyalty
To some extent, Costco's sales will ebb and flow along with the economy. That's natural for a retailer. But what won't change over the next three years is the company's focus on keeping its customers happy, because that supports an important income stream. And you can keep tabs on that by watching its membership renewal rates.
Costco's Growth
Costco's growth opportunities reside in increasing membership by incremental amounts and opening new stores. Comparable-sales growth is strained right now due to inflation, but the company typically demonstrates mid- to high-single digit percentage comparable sales growth. Membership increased 7.9% year over year in the fiscal fourth quarter (ended Sept. 3), and membership fee income increased as a percentage of sales from 1.88% to 1.95%. It will also likely raise its annual membership fee, which stands at $60 for a basic membership, sometime soon. That will lead to an increase on the bottom line.
If you own this stock, or are considering buying it, making sure that Costco generates consistently high renewals may actually be more important than monitoring its product sales.
Price Momentum
COST is trading near the top of its 52-week range and above its 200-day simple moving average.
What does this mean?
Investors have been pushing the share price higher, and the stock still appears to have upward momentum. This is a positive sign for the stock's future value.
