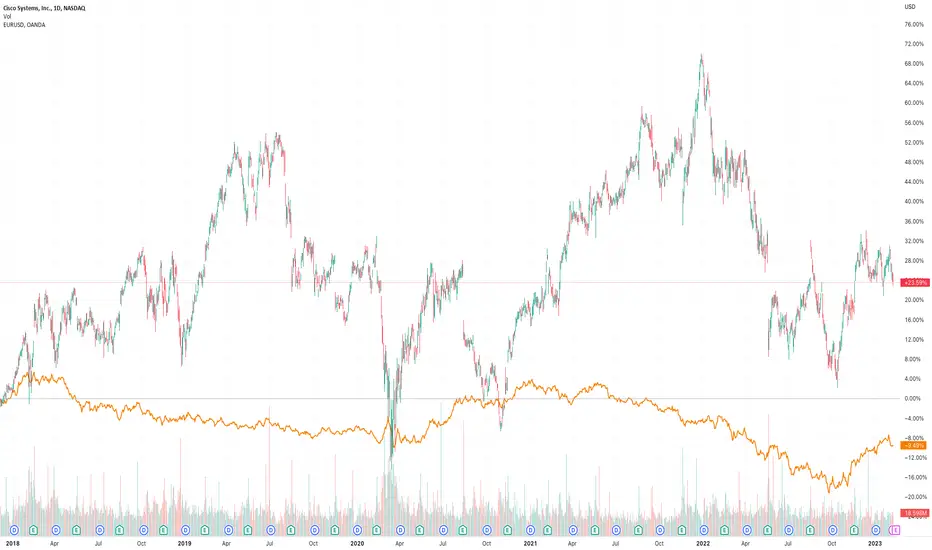
CISCO Strong price jump. Still high upside potential.Cisco Systems (CSCO) opened today considerably higher leaving behind both the 1D MA200 (orange trend-line) and 1D MA50 (blue trend-line) which was its Resistance this week. The price even broke above the 0.5 Fibonacci retracement level for the first time since May 04 2022. Needless to say this is a major bullish break-out from all perspectives.
We expect a pull-back only after the 1D RSI hits 74.00, which has been the overbought level that caused major corrections. Up until that overbought level, the stock rose every time (3 occasions) by a minimum of +22.50% (others +26% and +30%). Assuming we see another (minimum) +22.50% rise before an overbought 1D RSI rejects the uptrend, we can expect a new High around $56.80, which is exactly at the bottom of a Resistance Zone holding since February 18 2022 (almost a year!) where 4 rejections took place a little after the peak of the market.
Notice that a 1D Death Cross on March 21 2022 was what really made the price collapse aggressively during the Bear Market and a 1D Golden Cross (December 28 2022) is what can potentially make it recover the full distance to the prior market High.
-------------------------------------------------------------------------------
** Please LIKE 👍, FOLLOW ✅, SHARE 🙌 and COMMENT ✍ if you enjoy this idea! Also share your ideas and charts in the comments section below! **
-------------------------------------------------------------------------------
💸💸💸💸💸💸
👇 👇 👇 👇 👇 👇
CSCO trade ideas

DunnoI am not sure the structure up there is a flag because if it it is a heavy flag.
Flags are great but when they go on and on and on, they can make the pole fall down.
Neither here nor there, CSCO beat earnings today so curious to see if this will hit EL.
I have been eyeballing this one for a while now and it has been a bit stagnant.
Good dividend and as a rule, this stock is not volatile.
No recommendation.
EPS (FWD)
3.55
PE (FWD)
13.45
Div Rate (FWD)
$1.52
Yield (FWD)
3.19%
Short Interest
1.01%
Market Cap
$195.96B

CSCO Cisco Systems Options Ahead of EarningsAfter my last Price Target was reached:
Now looking at the CSCO Cisco Systems options chain ahead of earnings , I would buy the $45 strike price Puts with
2023-4-21 expiration date for about
$1.57 premium.
If the options turn out to be profitable Before the earnings release, I would sell at least 50%.
Looking forward to read your opinion about it.

Short term outlook on CSCO - EW analysisOn friday january 20 I posted an idee in the German version of Tradingview calling for a bottom in CSCO. Since then CSCO rallied in two distinct upward waves, which I would identify as a double 1 - 2.
If you look at a seasonal chart of CSCO it suggests another trough around january 30 - 31 before further rally up until may. If the rally from january 25 is an impulse wave, then the target would be around 48 USD, the low of the preceding wave 4 of one lesser degree.
In a more bearish scenario the whole advance from january 24 could be labeled as an overshooting wave b or x. In that case the correction could extend into the area of 47 - 47,5 USD.
So CSCO is up for further declines on monday and probably into early tuesday. In late trading on tuesday we might already see a turnaround leading us into a wave 3 rally.

Cisco’s strength to be challenged coming into the new yearCisco Systems, Inc. (symbol ‘CSCO’) made somewhat consistent profits throughout the last quarter of 2022 with some sideway movement on the share price in the last month and a half. The company’s earnings report for the fiscal quarter ending December 2022 is set to be released on Wednesday 15th of February, after market close. The consensus EPS for Q4 is $0.76 compared to Q4 2021’s $0.77.
‘The latest current ratio of the company ( meaning the ability of the company to repay its short term liabilities) is at 1.43 which in combination with a payout ratio of 54.51% shows that the company is healthy at least in the short term. This in combination to the dividend yield of 3.20% make the company an attractive addition to an investors portfolio. ’ said Antreas Themistokleous at Exness.
Based on technical analysis the share price is trading on a major technical resistance which consists of the 20 and 100 day moving average and the 23.6% of the daily Fibonacci retracement level.
The Stochastic oscillator is not indicating any overbought or oversold levels so based solely on technical analysis principles the most possible scenario could possibly be the continuation of the bearish movement at least in the short term. If this scenario is confirmed in the following sessions we might expect some support around the $46 price area which consists of the 38.2% of the Fibonacci and also the lower band of the Bollinger bands.
CSCO SetupCisco Setup
1- Current trend is sideway, it was bullish Previously
2- Consolidation mode, let the price break the rectangle from upwards
3- Next resistance is at 50 and then 54
4- Next Support is at 46
5- if price goes above 50 then you can enter
Entry: 50.5
SL: 47.6
TP: 54
RRR: 1:1

CISCO SISTEMS new bullish push, high acc. expected
Hi viewers, CSCO technically watched here now expecting new bullish push
TP1:52
TP2:53
TP2:54

Cisco to stall at previous highs.Cisco Systems - 30d expiry - We look to Sell at 50.29 (stop at 51.58)
50 continues to hold back the bulls.
Trading close to the psychological 50 level.
We look for a temporary move higher.
Preferred trade is to sell into rallies.
A bullish reverse Head and Shoulders has formed.
Our profit targets will be 47.07 and 46.07
Resistance: 50.00 / 50.71 / 52.00
Support: 48.00 / 46.70 / 45.70
Please be advised that the information presented on TradingView is provided to Vantage (‘Vantage Global Limited’, ‘we’) by a third-party provider (‘Signal Centre’). Please be reminded that you are solely responsible for the trading decisions on your account. There is a very high degree of risk involved in trading. Any information and/or content is intended entirely for research, educational and informational purposes only and does not constitute investment or consultation advice or investment strategy. The information is not tailored to the investment needs of any specific person and therefore does not involve a consideration of any of the investment objectives, financial situation or needs of any viewer that may receive it. Kindly also note that past performance is not a reliable indicator of future results. Actual results may differ materially from those anticipated in forward-looking or past performance statements. We assume no liability as to the accuracy or completeness of any of the information and/or content provided herein and the Company cannot be held responsible for any omission, mistake nor for any loss or damage including without limitation to any loss of profit which may arise from reliance on any information supplied by Signal Centre.

CSCOA good opportunity to long position and get a good profit from the attractive American stock market
Stay with me to get more analysis after following me by sharing with friends and leaving a comment.
According to my risk and capital management system, the risk of each trade is one percent per position.
What do you think about this analysis and other analyses?
What symbol would you like me to analyze for you?

CSCO short setup Bearish momentum is expected in this stock because
1. Harmonic pattern AB=CD completed
2. Rejected from resistance
3. Made double top
4. trend line broken
5. strong support of fib line broken

Cisco Systems CSCO Analysis over 10 Years (2013-2022)Seasonal Pattern Observations:
1- over the 10 years stock value went from 20 to 50 usd (150%) while the highest was 64 in Jan 2022
2- 5 out of 10 times Jan was Bullish
3- 9 out of 10 time Feb was in Bullish
4- 10 out of 10 times July is Bullish
5- 5 years was in profit and 5 years in loss
Behaviour & Nature Observations:
1- whenever the Year is in Loss the most lost weeks are from Jul-Aug-Sep
2- 8 out of 10 there are chances that there will be a dip in 4th Q, and when there is no dip you can expect a continuation bullish run till Dec
3- 4th Quarter is the correction phase
4- When Mar is bearish a big dip is expected
Time Cycle Observations:
1- Feb & Mar are normally accumulation phase
2- Aug & Sept are usually bearish

CSCO retraceIn weekly chart, it is at the resistance from the red trend line and green band, means high potential a retrace will be formed in weekly chart.
In daily chart, TD 13 shows the rebound could be terminated after it break out the red color long term down trend band, the upward momentum could be reduced due to it. It is time to take profit before the announcement of US election's result.

CSCO | Bullish Trend | 02\12\22
CSCO will remain in a bullish trend for the coming week.
Hammer candle is spotted at HL.
It is not a financial advice.

CISCO in UptrendCISCO is in an uptrend and making new HH and HL. Short term gain as mentioned on chart is expected.

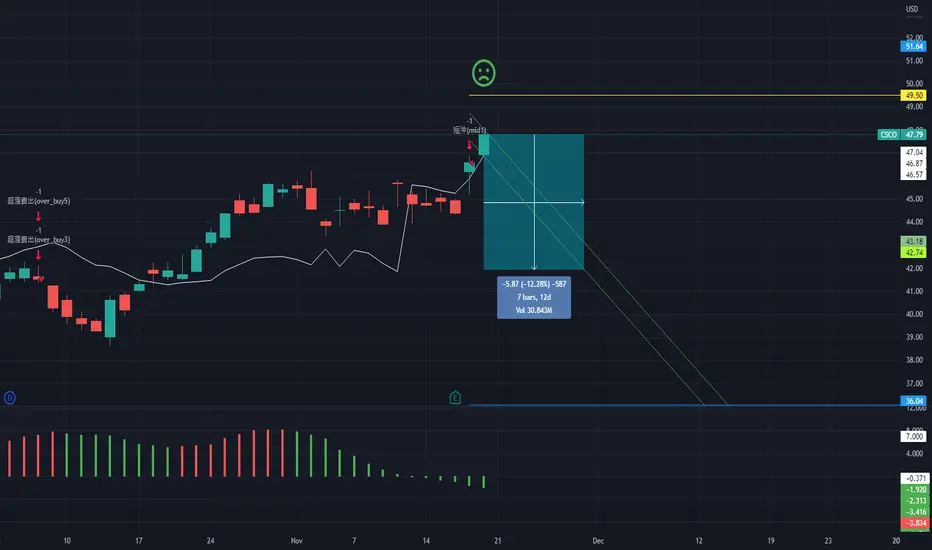
CSCO, 7d/12.28%falling cycle 12.28% in 7 days.
==================================================================================================================================================================
This data is analyzed by robots. Analyze historical trends based on The Adam Theory of Markets (20 moving averages/60 moving averages/120 moving averages/240 moving averages) and estimate the trend in the next 10 days. The white line is the robot's expected price, and the upper and lower horizontal line stop loss and stop profit prices have no financial basis. The results are for reference only.
CSCO Cisco Systems Options Ahead of EarningsLooking at the CSCO Cisco Systems options chain, i would buy the $42.5 strike price in the money Calls with
2022-11-18 expiration date for about
$3.00 premium.
If the options turn out to be profitable Before the earnings release, i would sell at least 50%.
Looking forward to read your opinion about it.


$CSCO with a Bullish outlook following its earnings #Stocks The PEAD projected a Bullish outlook for $CSCO after a Positive Under reaction following its earnings release placing the stock in drift A.

CSCO - attractive at these prices.We like this here for a move into the mid-50's. P/E at around 14, 3,3% dividend and nice stable ROE.

Cisco.. for the small accounts This stock is traded on the dow and the if you put the charts side by side they are a mirror
Stop loss 45$..
Target 43$
2nd target 42$

Cisco Systems (CSCO) bullish scenario:The technical figure Falling Wedge can be found in the daily chart in the US company Cisco Systems, Inc. (CSCO). Cisco Systems, Inc., commonly known as Cisco, is an American-based multinational digital communications technology conglomerate corporation. Cisco develops, manufactures, and sells networking hardware, software, telecommunications equipment and other high-technology services and products. Cisco specializes in specific tech markets, such as the Internet of Things (IoT), domain security, videoconferencing, and energy management with leading products including Webex, OpenDNS, Jabber, Duo Security, and Jasper. Cisco is one of the largest technology companies in the world ranking 74 on the Fortune 100 with over $51 billion in revenue and nearly 80,000 employees. The Falling Wedge broke through the resistance line on 29/10/2022. If the price holds above this level, you can have a possible bullish price movement with a forecast for the next 69 days towards 50.28 USD. Your stop-loss order, according to experts, should be placed at 38.61 USD if you decide to enter this position.
For the July quarter, adjusted earnings came in at 83 cents per share, down 1% from a year earlier. Revenue was flat at $13.1 billion, including acquisitions.
Analysts estimated that Cisco would earn 82 cents per share on revenue of $12.73 billion.
For the October quarter, Cisco forecast profit in a range of 82 cents to 84 cents vs. estimates of 84 cents. Cisco projected revenue growth of 2% to 4%, compared with projections for flat sales growth.
Risk Disclosure: Trading Foreign Exchange (Forex) and Contracts of Difference (CFD's) carries a high level of risk. By registering and signing up, any client affirms their understanding of their own personal accountability for all transactions performed within their account and recognizes the risks associated with trading on such markets and on such sites. Furthermore, one understands that the company carries zero influence over transactions, markets, and trading signals, therefore, cannot be held liable nor guarantee any profits or losses.

CSCO - Weekly chart in exhaustion range1. Fortune_TD, Fortune Banker trend, Fortune Crown stage:
Analysis on weekly chart
03 Oct 2022, Fortune TD 13 show the trend exhaustion range, the green bar shows this is a potential share pull back.
03 Oct 2022, Fortune Crown security line is at bottom, still going down, there is no red dot yet.
03 Oct 2022, Fortune Banker trend, green line shows the banker chips flow in, but the short money still not yet gold cross its 5 days average.
2. Potential opportunity:
waiting for the share price break out the green bar high 42.25.
3. Summary:
Based on above analysis, the share price is downtrend in daily and weekly chart, so using weekly chart to identify the bottom area instead of using weekly chart.
Disclaimer : no recommendation of buy/sell, purely for TA learning and sharing.

CSCO Analysis - 27 OctoberHello Guys, Today's Analysis is on the CSCO Symbol in a 4H Time frame, I Hope it Will be Useful for You, Don't Forget to Like, Follow, Comment
